CO Cameron band and CO UV doublet emissions in the dayglow of Venus: Role of CO in the Cameron band production
Abstract
Present study deals with the model calculations of CO Cameron band and CO ultraviolet doublet emissions in the dayglow of Venus. The overhead and limb intensities of CO Cameron band and CO UV doublet emissions are calculated for low, moderate, and high solar activity conditions. Using updated cross sections, the impact of different e-CO cross section for Cameron band production is estimated. The electron impact on CO is the major source mechanism of Cameron band, followed by electron and photon impact dissociation of CO2. The overhead intensities of CO Cameron band and CO UV doublet emissions are about a factor of 2 higher in solar maximum than those in solar minimum condition. The effect of solar EUV flux models on the emission intensity is 30-40% in solar minimum condition and 2-10% in solar maximum condition. At the altitude of emission peak (135 km), the model predicted limb intensity of CO Cameron band and CO UV doublet emissions in moderate (F10.7=130) solar activity condition is about 2400 and 300 kR, respectively, which is in agreement with the very recently published SPICAV/Venus Express observation. The model limb intensity profiles of CO Cameron band and CO UV doublet are compared with SPICAV observation. We also calculated intensities of N2 Vegard-Kaplan UV bands and OI 2972 Å emissions during moderate and high solar activity conditions.
keywords:
Venus , Venus Atmosphere , Ultraviolet observations , Upper atmosphere , Aeronomy , CO emission, Dayglow1 Introduction
Several spacecraft, viz., Mariner 5 (3-channel photometer: 1050–2200 Å, 1250–2200 Å, 1350–2200 Å); Venera 4 (1050–1340 Å, 1225–1340 Å); Mariner 10 (200–1700 Å); Venera 9 and 10 (visible spectrometers 3000–8000 Å and Lyman filter photometer); Venera 11 and 12 (300–1700 Å); Pioneer Venus Orbiter (1100–1800 Å and 1600–3300 Å); Cassini (561–1182 Å and 1155–1913 Å) have visited Venus so far. A review of past observations of Venus missions is given by Fox and Bougher (1991). Currently, the Venus Express (VEx) is orbiting Venus which has an experiment (SPICAV, 1100–3100 Å, 7000–17000 Å, 23000–42000 Å) for aeronomical studies of Venusian atmosphere. The major emission detected in the dayglow of Venus include HeI 584 Å and HeII 304 Å lines, OI 989 Å, OI 1304 Å triplet, OI 1356 Å, OI 2972 Å, OII 834 Å, CI 1561 and 1657 Å, H Lyman-, and CO fourth positive and Hopfield–Birge bands (e.g., Broadfoot et al., 1974, 1977; Bertaux et al., 1981; LeCompte et al., 1989; Gérard et al., 2011a, b; Hubert et al., 2012).
Theoretical calculations have shown CO Cameron band to be one of the brightest features (18–20 kR overhead intensity for low solar activity condition) in the UV dayglow of Venus (Fox and Dalgarno, 1981; Fox and Bougher, 1991; Gronoff et al., 2008). The production sources of CO Cameron band () on Venus are expected to be similar to those on Mars, viz., photon and electron impact dissociation of CO2, dissociative recombination (DR) of CO, and electron impact on CO (e-CO). Since is a forbidden transition, resonance fluorescence of CO is not an effective excitation mechanism. The CO UV doublet emission originate due to transition from B state of CO to the ground state (). Theoretical calculations predicted an overhead dayglow intensity of around 7–10 kR for UV doublet, with photoionization being the dominant production mechanism (Fox and Dalgarno, 1981; Gronoff et al., 2008).
The main objective of the present study is to understand the role of various processes governing the production of CO Cameron band and CO UV doublet emissions in the dayglow of Venus in the light of updated cross sections and reaction rates. Recently, we have developed a model for the CO Cameron band and CO UV doublet emissions in the dayglow of Mars (Jain and Bhardwaj, 2012). In the present study this model is applied to Venus to calculate the CO Cameron band and CO UV doublet dayglow emissions for low, moderate, and high solar activity conditions.
After submission of this paper, the first observation of CO Cameron band and CO UV doublet emissions in the dayglow of Venus using the SPICAV aboard Venus Express were reported (Chaufray et al., 2012). Keeping the structure of the paper unchanged, we added a section in the revised version, where we compared model prediction with the SPICAV observation. Details of the model are given in Section 2, followed by results and discussion in Section 3 and 4, respectively. The summary and conclusions are presented in Section 6.
2 Development of Model
Primary photoelectron production rate is calculated using
| (1) |
| (2) |
where and are the total photoabsorption cross section and the photoionization cross section of the th ion state of the constituent at wavelength , respectively; is the unattenuated solar flux at wavelength , is the neutral density of constituent at altitude Z; is the solar zenith angle (SZA); is the delta function, in which is the incident photon energy, Wjl is the ionization potential of the th ion state of the th constituent, and is the energy of ejected electron.
To calculate the photoelectron flux we have adopted the Analytical Yield Spectra (AYS) technique (cf. Bhardwaj et al., 1990; Singhal and Bhardwaj, 1991; Bhardwaj, 1999, 2003). The AYS is an analytical representation of numerical yield spectra obtained using the Monte Carlo model (cf. Singhal et al., 1980; Singhal and Bhardwaj, 1991; Bhardwaj and Michael, 1999; Bhardwaj and Jain, 2009). Using AYS the photoelectron flux has been calculated as
| (3) |
where is the total inelastic cross section for the th gas with density , and is the two-dimensional AYS, which embodies the non-spatial information of degradation process. It represents the equilibrium number of electrons per unit energy at an energy resulting from the local energy degradation of an incident electron of energy . For the CO2 gas, the AYS is taken from Bhardwaj and Jain (2009), and for other gases, viz., O2, N2, O, and CO, we have used the AYS given by Singhal et al. (1980). The ion and electron temperatures for solar minimum and maximum conditions are taken from Fox (2009).
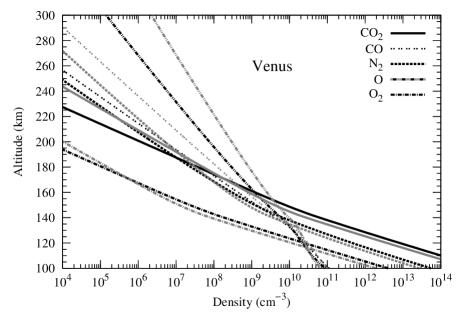
Model atmosphere (considering CO2, N2, CO, and O) of Venus is taken from the VTS3 model of Hedin et al. (1983) for solar minimum (F10.7 = 60), moderate (F10.7 = 130) and maximum (F10.7 = 200) conditions, for equatorial region and local time of 1500 hrs, which corresponds to the solar zenith angle of around 45∘. Based on the study of Fox and Bougher (1991) the density of O2 is taken as times that of CO2 density. Figure 1 shows the model atmosphere of Venus for low and high solar activity conditions. Below 160 km (150 km in case of high solar activity) CO2 is the major atmospheric species, but above this altitude atomic oxygen becomes the dominant neutral in the atmosphere of Venus.
In the present study, solar EUV flux from EUVAC model (Richards et al., 1994) is used for low, moderate, and high solar activity conditions. To assess the impact of solar EUV flux model on the calculated intensities, the solar EUV flux from SOLAR2000 (S2K) v2.36 model (Tobiska, 2004) is also used. The solar EUV flux is taken at 1 AU and then scaled to the Sun-Venus distance (0.72 AU). There are substantial differences in the solar EUV fluxes of EUVAC and S2K models; moreover, these differences are not similar in solar minimum and maximum conditions (e.g., see Jain and Bhardwaj, 2012; Bhardwaj and Jain, 2012a). In both solar minimum and maximum conditions, the solar flux estimated in bins is higher in S2K than in EUVAC over the entire range of wavelengths, except for the bins below 250 Å (150 Å for solar minimum condition), whereas solar fluxes at prominent lines are higher in EUVAC model for entire wavelength range (see Figure 1 of Jain and Bhardwaj, 2012). The higher solar fluxes above 250 Å in S2K cause more photoionization. Higher photon fluxes below 250 Å (during solar maximum condition) in EUVAC model produce more high-energy electrons causing secondary ionizations that can compensate for the higher photoionization in S2K model. A major difference between solar EUV flux of S2K and EUVAC models is the solar flux at bin (1000–1050 Å) containing H Ly- (1026 Å) line, which in both solar conditions is around an order of magnitude higher in S2K compared to EUVAC solar flux model. The solar fluxes at longer wavelength are very important for dissociative excitation processes. Hence, contribution of photodissociation (PD) of CO2 in CO(a) production would be higher when the S2K solar EUV flux model is used.
Due to its long lifetime, cross section for the production of CO(a) due to electron impact dissociation of CO2 (e-CO2) is difficult to measure in the laboratory. Ajello (1971a) reported relative magnitudes of the cross section for the (0, 1) transition of CO Cameron band at 215.8 nm and reported a value of cm2 at 80 eV. Erdman and Zipf (1983) later criticised the cross section obtained by Ajello (1971a) and advocated a value of cm2 at 80 eV due to a re-evaluation to 9 ms of the radiative lifetime (Johnson, 1972). They subsequently multiplied this value by a factor of 2.7 to account for higher mean velocity of CO(a) fragments, which might have escaped detection (Wells et al., 1972). Therefore, Erdman and Zipf (1983) reported a value of cm2 at 80 eV. Avakyan et al. (1998) have estimated the CO Cameron band cross section based on the cross section of Ajello (1971a) with the correction of Erdman and Zipf (1983). Bhardwaj and Jain (2009) have analytically fitted the cross section of CO(a) production due to electron impact on CO2 using the suggested value of Erdman and Zipf (1983).
Conway (1981) constructed a synthetic spectrum of Martian dayglow between 1800 and 2600 Å. Based on the comparison of the model calculation with Mariner observation, Conway found that a cross section with a maximum value of cm2 was consistent with the data. The value suggested by Conway (1981) is around a factor of 3 smaller than that of Erdman and Zipf (1983). Recent comparison between calculations and observations of dayglow emission on Mars suggests a lower value of e-CO2 cross sections for the CO Cameron band production (Simon et al., 2009; Jain and Bhardwaj, 2012; Gronoff et al., 2012). Jain and Bhardwaj (2012) and Gronoff et al. (2012) have shown that Cameron band cross sections of Erdman and Zipf (1983) should be reduced by a factor of 2 to 3, to bring the calculated CO Cameron band intensities in agreement with the Mars Express observation. The reduction in the CO(a) cross section is also supported by recent measurements of radiative lifetime of CO(a). Based on theoretical and experimental work, Gilijamse et al. (2007) have re-analysed the radiative lifetime of CO(a), and reported a value of 3.16 ms, which is around 3 times less than the value of Johnson (1972). In the present study the cross section for CO(a) production due to electron impact on CO2 is taken from Bhardwaj and Jain (2009) after dividing it by a factor of 3, which is shown in Figure 2 along with the recommended cross section of Avakyan et al. (1998).

Electron impact on CO (e-CO) is also a source of CO Cameron band. On Mars, due to less abundance of CO, it does not contribute significantly to the total Cameron band emission (Fox and Dalgarno, 1979; Jain and Bhardwaj, 2012). However, on Venus, CO contribution cannot be neglected due to its relatively larger abundance above 150 km (cf. Figure 1). In comets, where the CO abundance is larger or equal to that of the CO2, the major contribution to CO Cameron band emission is from electron impact on CO (Bhardwaj and Raghuram, 2011; Raghuram and Bhardwaj, 2012). In the previous calculations of CO Cameron band emission in the dayglow of Venus (Gronoff et al., 2008; Fox and Dalgarno, 1981; Fox and Bougher, 1991), the e-CO cross section for CO(a) production was taken from the work of Ajello (1971b). Ajello (1971b) used the (1,4) Cameron band at 2389 Å to normalize the entire band system cross section in electron impact excitation of CO. However, according to Erdman and Zipf (1983), the (1,4) Cameron band was contaminated by (6,16) CO fourth positive band. Erdman and Zipf (1983) repeated and re-analysed the Ajello’s experiment with higher sensitivity and concluded that total cross section value ( cm2 at 11 eV) measured by Ajello (1971b) should, therefore, be reduced by a factor of 8 to an apparent value of cm2 at 11 eV. In addition to the contamination problem, Ajello’s total Cameron band emission cross section was based on the assumption of radiation lifetime of 1 ms for a state. Erdman and Zipf (1983) used the radiative life of 9 ms (Johnson, 1972) and multiplied the cross section (already corrected for contamination) by a factor of 9 and gave a cross section value of cm2 at 11 eV, with an uncertainty close to 75%.
After accounting for corrections, the cross section value suggested by Erdman and Zipf (1983) is very close to the cross section of Ajello (1971b). However, based on CO(a) radiative lifetime of 3 ms reported by Gilijamse et al. (2007), the Cameron band cross section in e-CO process should be reduced by a factor of 3.
LeClair et al. (1994) have measured the e-CO cross section for CO(a) production using solid xenon detector and time of flight (TOF) technique. LeClair et al. (1994) have given the integral cross section (ICS) of CO(a)—that include cascading contributions from higher triplet states—by normalizing their excitation function to the maximum absolute cross section ( cm2 at 11 eV) obtained by Erdman and Zipf (1983). This normalization may cause an overestimation of CO(a) section measured by LeClair et al. (1994), since Erdman and Zipf (1983) have used the radiative lifetime of 9 ms, which is a factor of 3 higher than recently measured lifetime of 3 ms (Gilijamse et al., 2007). The shape of normalized CO(a) cross section measured by LeClair et al. (1994) is identical to the one recorded by Ajello (1971b). However, maximum cross section is at 9.4 eV in LeClair et al. (1994) measurement compared to 11 eV in Ajello (1971b) experiment. LeClair et al. (1994) attributed this difference in peak position to the electron beam characteristic in the two experiments.
Furlong and Newell (1996) reported the absolute integral cross section for CO(a) production in the e-CO collision by normalizing their measurements to maximum cross section value ( cm2 at 8.5 eV) calculated by Morgan and Tennyson (1993). Below 10 eV, their cross section is in good agreement with that of LeClair et al. (1994). Above 10 eV, Furlong and Newell (1996) reported an increase in cross section due to the contribution from cascading into a state. The cross sections obtained by Furlong and Newell (1996) are about a factor of 2 higher between 10 and 35 eV compared to that of LeClair et al. (1994).
The above mentioned discussion clearly points out the difference in the cross section of CO(a) in electron impact excitation of CO. In the present study, cross section of Furlong and Newell (1996) is used for CO(a) production in e-CO collision. The cross section of LeClair et al. (1994) is also used to assess the effect of cross section in Cameron band intensity. The reason for using these two cross sections over the one measured by Ajello (1971b) is due to the fact that Ajello’s measured cross section have been shown to be flawed by Erdman and Zipf (1983). Figure 2 depicts the CO(a) cross sections in e-CO process used in the present study along with cross section obtained by Ajello (1971b). The cross section of CO(a) production in e-CO process attains maximum value at 10 eV, where photoelectron flux also has high values (Bhardwaj and Jain, 2012a). This makes e-CO collisions more important for the Cameron band production, if CO density is sufficient, as in the case of Venus. At electron energies 25 eV, CO(a) cross section in e-CO2 process becomes dominant (cf. Figure 2).
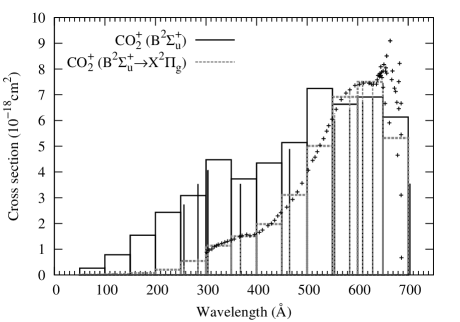
The details of photoabsorption, photoionization, and electron impact cross sections used in the present study are given in our previous work (Jain and Bhardwaj, 2011, 2012; Bhardwaj and Jain, 2012a). The details of cross sections and processes considered in the model to calculate CO Cameron band and CO UV doublet emissions are summarised in Table 1. While calculating the emission from B state of CO, we have taken branching ratio of 0.5 (for photoionization only) from the CO (B) to (A) based on the study of Fox and Dalgarno (1979). Ukai et al. (1992) have given the direct emission cross section of CO(B X) transition. This cross section is also used in the present study to assess the impact of using excitation and emission cross section of B state of CO. Figure 3 shows the CO(B) excitation and CO(B X) emissions cross sections due to photon impact on CO2. Emission cross section of Ukai et al. (1992) has been averaged at 37 wavelength bins. The contribution of fluorescence scattering of CO to the UV doublet emission is calculated by taking the fluorescence efficiency (g) value of s-1 for Venus (Dalgarno and Degges, 1971).
| Process | References |
|---|---|
| CO2 + eph CO(a) + O | Bhardwaj and Jain (2009) |
| CO2 + h CO(a) + O | Lawrence (1972) |
| CO + eth CO(a) + O | Seiersen et al. (2003); Skrzypkowski et al. (1998) |
| CO + eph CO(a) | Furlong and Newell (1996)11footnotemark: 1 |
| CO2 + eph CO | Bhardwaj and Jain (2009) |
| CO2 + h CO | Schunk and Nagy (2000)22footnotemark: 2 |
| CO + h CO | Dalgarno and Degges (1971) |
Cross section measured by LeClair et al. (1994) has also been used. 22footnotemark: 2Branching ratios for ionization in different states are from Avakyan et al. (1998).
3 Results
3.1 Solar minimum condition
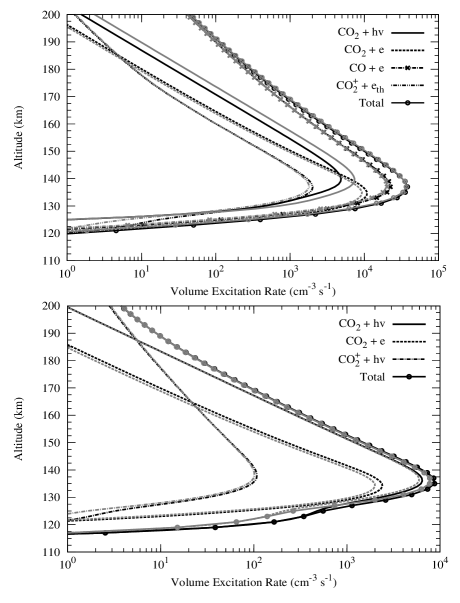
Figure 4 shows the calculated volume excitation rates of CO(a) and CO for low solar activity condition. The altitude of peak production is 140 km.
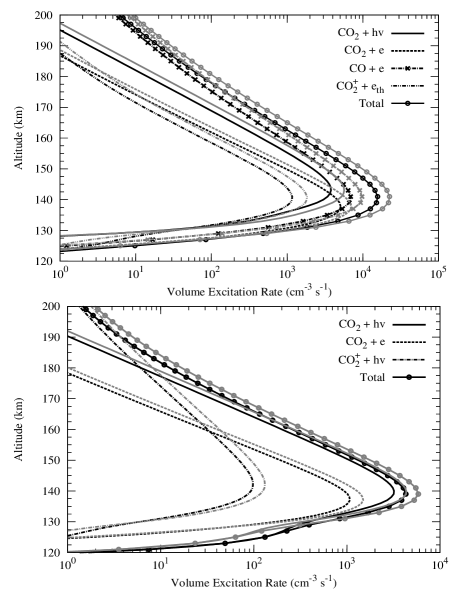
The major production source of Cameron band at the peak is e-CO process, whose contribution is about 44%; unlike on Mars, where electron impact on CO2 is the major Cameron band production mechanism (Jain and Bhardwaj, 2012). Table 2 shows the height-integrated overhead intensity of CO Cameron band with contributions of different sources. The e-CO collisions are the major source of Cameron band production with contribution of around 45%, followed by e-CO2, PD of CO2, and DR of CO, whose contributions are around 25, 23, and 7%, respectively.
| Process | Intensity (kR) | ||||||
| CO Cameron Band | CO UV doublet | ||||||
| Low SA11footnotemark: 1 | Mod. SA22footnotemark: 2 | High SA33footnotemark: 3 | Low SA | Mod. SA | High SA | ||
| EUVAC solar flux model | |||||||
| CO2 + h | 5.7 (6.2)44footnotemark: 4 | 7.2 | 7.5 | 4.8 | 8.5 | 9.5 | |
| e + CO2 | 6.6 (7.8) | 12.3 | 13.7 | 1.4 | 2.7 | 3 | |
| e + CO | 11.4 [7.8]55footnotemark: 5 (2.9) | 27.3 | 36.3 [25.6] | - | - | - | |
| e + CO | 1.7 (2) | 2.9 | 2.9 | - | - | - | |
| FS | - | - | 0.2 | 0.3 | 0.3 | ||
| Total | 25.3 [21.8] (18) | 49.8 | 60.4 [49.8] | 6.4 {4}66footnotemark: 6 | 11.5 {7.2} | 12.8 {8} | |
| SOLAR2000 solar flux model | |||||||
| CO2 + h | 8.6 | 10.7 | 11.6 | 6.3 | 8 | 8.7 | |
| e + CO2 | 9.2 | 11 | 11.7 | 1.9 | 2.4 | 2.5 | |
| e + CO | 16.2 | 26.3 | 33.5 | - | - | - | |
| e + CO | 2.6 | 2.8 | 2.6 | - | - | - | |
| FS | - | - | - | 0.4 | 0.3 | 0.3 | |
| Total | 36.3 | 51 | 59.4 | 8.6 {5.5} | 10.7 {6.7} | 11.4 {7.2} | |
e = Photoelectron; e = Thermal electron; FS = Fluorescent scattering of CO
11footnotemark: 1Low solar activity (F10.7=60).
22footnotemark: 2Moderate solar activity (F10.7=130).
33footnotemark: 3High solar activity (F10.7=200).
44footnotemark: 4Calculated values in parenthesis are for model atmosphere of Fox and Dalgarno (1981) and e-CO Cameron
band production cross section from Ajello (1971b).
55footnotemark: 5Calculated values in brackets are for the CO(a) cross section of LeClair et al. (1994) 66footnotemark: 6Calculated by taking the 50% cross-over from to before radiating.
Bottom panel of Figure 4 shows the volume production rate of CO, and the height-integrated overhead intensity of CO UV doublet emission for different sources is presented in Table 2. Photoionization of CO2 is the dominant source (75%) of CO production, followed by the electron impact ionization of CO2 (21%). Contribution of fluorescent scattering of CO is very small (3%).
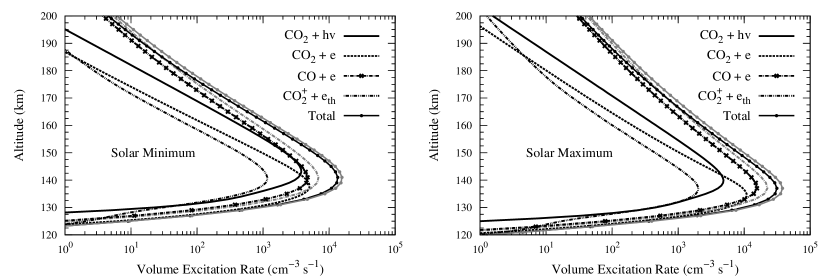
Figure 5 shows the volume production rate of CO(a) for low and high solar activity conditions calculated by using the CO(a) cross section measured by LeClair et al. (1994). The height-integrated intensity of Cameron band is given in Table 2. The e-CO process is still the dominant source of Cameron band production, though its contribution in Cameron band production is reduced compared to the case when CO(a) cross section is taken from Furlong and Newell (1996), which is consistent with our previous considerations.
The volume excitation rates are integrated along the line of sight to calculate the limb intensities of CO UV doublet and CO Cameron band emissions in the dayglow of Venus. Limb intensity at each tangent point is calculated as
| (4) |
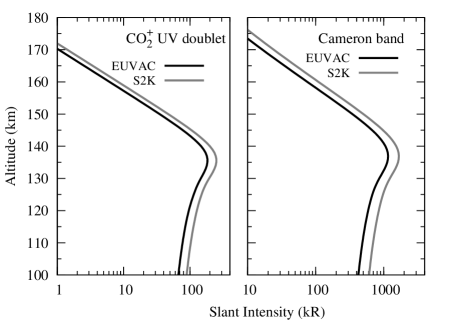
where is abscissa along the horizontal line of sight, and V(r) is the volume emission rate (in cm-3 s-1) at a particular emission point . The factor of 2 multiplication comes due to symmetry along the line of sight with respect to the tangent point. While calculating limb intensity we assumed that the emission rate is constant along local longitude/latitude. Figure 6 shows the limb intensities of CO UV doublet and CO Cameron band emission on Venus. The calculated limb intensity of Cameron band peaks at 137 km with a value of 1200 kR, while the maximum limb intensity of CO UV doublet emission is 183 kR at an altitude of 136 km.
3.2 Solar maximum condition
Figure 7 shows the calculated volume excitation rates of CO Cameron band (upper panel) and CO UV doublet (lower panel) emissions for solar maximum condition. The production rate of Cameron band attains a maximum value of cm-3 s-1 at an altitude of 137 km. The height-integrated overhead intensity is presented in Table 2. Electron impact on CO is by far the dominant production source of Cameron band contributing about 60%, followed by electron impact on CO2 (23%), PD of CO2 (12%), and DR of CO (4%). The CO(a) production rate calculated using e-CO cross section from LeClair et al. (1994) is shown in Figure 5 and corresponding height-integrating intensities in Table 2.
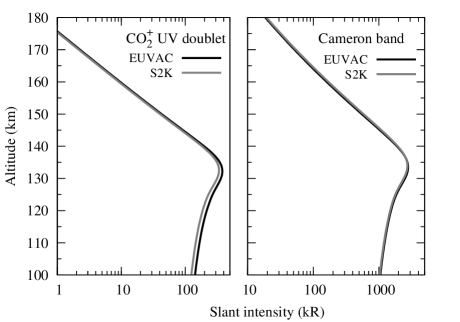
For the CO UV doublet emission, maximum production rate occurs at an altitude of 135 km with a value of cm-3 s-1 (cf. Figure 7). The overhead intensity of CO UV doublet is presented in Table 2. The PD of CO2 is the dominant (74%) production source of UV doublet emission followed by electron impact on CO2 (23%) and fluorescent scattering by CO (3%). Figure 8 shows the calculated line of sight intensities of CO Cameron band and CO UV doublet emissions. The intensity of Cameron band peaks 135 km with a value of 2700 kR, while the intensity of UV doublet emission attains a maximum value of around 380 kR at an altitude of 132 km.
3.3 Solar moderate condition
The model calculation is also carried out for the moderate solar activity condition by taking the solar EUV flux on 1 July 2012 (F10.7 = 130). The height-integrated overhead intensities of CO Cameron band and CO UV doublet emissions are presented in Table 2. Our calculation shows that for solar moderate condition also, the e-CO process is the dominant mechanism of CO Cameron band production contributing about 55%, followed by electron impact on CO2 (25%), PD of CO2 (14%), and DR of CO (6%). The PD of CO2 is the dominant (74%) production source of UV doublet emission followed by electron impact on CO2 (23%) and fluorescent scattering by CO (3%). Figure 9 shows the calculated limb intensities of CO Cameron band and CO UV doublet emissions in the dayglow of Venus for moderate solar activity condition. Both emissions maximise at 135 km with intensity of 2200 kR for CO Cameron band and 330 kR for CO UV doublet emission.
4 Discussion
The present model calculation shows that the electron impact on CO is the dominant source of CO Cameron band production in the atmosphere of Venus for low, moderate, and high solar activity conditions using the CO(a) cross sections of Bhardwaj and Jain (2009) and Furlong and Newell (1996) in electron impact on CO2 and CO, respectively. For solar minimum condition Fox and Dalgarno (1981) and Gronoff et al. (2008) reported that e-CO2 process is the major production source of Cameron band. Gronoff et al. (2008) have calculated CO Cameron band intensity of 17.3 kR; with 7 kR from electron impact on CO2, 5.3 kR from PD of CO2, 4 kR from electron impact on CO, and 1 kR from DR of CO. Gronoff et al. (2008) have used the cross section of Ajello (1971b) for electron impact on CO, while in the present study the cross section of Furlong and Newell (1996) has been used. Using the cross section of Ajello (1971b), our model calculated overhead Cameron band intensity is 18.6 kR, with contributions from e-CO2, PD of CO2, e-CO, and DR of CO processes being 6.7, 5.6, 4.6, and 1.7 kR, respectively. The model calculated total CO Cameron band intensity is in good agreement with that of Gronoff et al. (2008). Fox and Dalgarno (1981) reported the Cameron band intensity of about 20 kR, with contribution of 25% from DR of CO and 6% from e-CO process. The present calculation, as well as that of Gronoff et al. (2008), show that the contribution of DR of CO (which depends on electron density and temperature) is smallest among the processes considered in the model (see Table 2). Fox and Bougher (1991) suggested that the source of DR was overestimated in the pre-Pioneer Venus model of Fox and Dalgarno (1981) because of low density of atomic oxygen, which led to larger densities of CO ion. The mixing ratio of CO was lower in the model atmosphere used by Fox and Dalgarno (1981), whereas in the present calculation, as well as in the model of Gronoff et al. (2008), the VTS3 model atmosphere is used, which has larger CO mixing ratio. To evaluate the effect of low CO mixing ratio, the model calculation is also carried out by taking model atmosphere of Fox and Dalgarno (1981); the results are shown in Table 2. The Cameron band intensity is 18 kR when the model atmosphere of Fox and Dalgarno (1981) and e-CO cross section of Ajello (1971b) are used, which is in agreement with the model result of Fox and Dalgarno (1981). However, in the present calculation the contribution of DR is about 11%, which is lower than that reported by Fox and Dalgarno (1981); this might be due to the difference in DR rate coefficient for CO(a) production in the two calculations.
For solar maximum condition, Fox and Bougher (1991) have reported total Cameron band intensity of 57 kR, which is in agreement with the value of 60 kR in the present study. However, the contribution of individual processes is different in the two studies. In the present study the e-CO is the dominant process; whereas in the model calculation of Fox and Bougher (1991) the photon and electron impact on CO2 played the dominant role with contribution of about 36% from each, while the contributions of electron impact on CO and DR of CO were 20 and 8%, respectively.
The present study shows that the contribution of e-CO process in CO(a) production is directly related to the cross section used in the calculation. For CO(a) cross section of LeClair et al. (1994), the e-CO process is found to be the dominant source of CO Cameron band (see Figure 5 and Table 2). Overall, the calculation shows that the role of electron impact on CO in the Cameron band production may have been underestimated in the earlier calculations of Fox and Dalgarno (1981) and Gronoff et al. (2008) due to the choice of e-CO cross section for CO(a) production used in their calculations.
It has been mentioned earlier that a branching ratio of 0.5 has been used to calculate the UV doublet emission intensity because we have used excitation cross section of CO(B) in the calculation. However, if emission cross section of CO2(B) given by Ukai et al. (1992) is used in the calculation rather than the excitation cross section, the contribution of photoionization in CO(B) ion production reduces by about 30%. For example during solar minimum (maximum) condition the overhead intensity of UV doublet emission due to photoionization of CO2 is about 1.8 kR (2.8 kR). This value is about 25% (40%) smaller than that calculated using CO2(B) excitation cross section (if 50% branching cross-over from B to A state is considered for excitation cross section). It shows that use of emission and excitation cross sections of CO2(B) affects the emission intensity of CO UV doublet.
4.1 Effect of solar EUV flux models
During the solar minimum condition, the CO Cameron band excitation rate calculated using the S2K model is about 45% larger than that calculated using the EUVAC model, while the production in PD of CO2 is about 50% higher when S2K model is used. However, the altitude of peak production is same for both solar EUV flux models (see Figure 4). The limb intensities calculated using the S2K model are about 40% larger than those calculated using the EUVAC model (see Figure 6).

For high solar activity condition the intensity of CO Cameron band and CO UV doublet emissions calculated using the EUVAC model is about 2% and 10%, respectively, higher than those calculated using the S2K model. This is due to the higher solar EUV flux in EUVAC model at wavelengths 250 Å that produces energetic photoelectrons which further ionize the medium and compensate for the higher photoionization by solar EUV flux at wavelengths 250 Å in the S2K model. The effect of solar EUV flux on model calculations for moderate solar activity condition is similar to that for high solar activity condition. Similar variation in the emission intensities due to the change in EUV flux models for solar minimum and maximum conditions have been found on Mars (Jain and Bhardwaj, 2012).
For all the three (low, moderate, and high) solar activity conditions the contribution of PD of CO2 to the Cameron band production is 50% higher when the S2K solar flux model is used. This is because of an order of magnitude higher solar EUV flux in the 1000–1050 Å bin in the S2K model compared to that in the EUVAC model. Solar EUV flux in the 1000-1050 Å bin does not significantly contribute to the photoionization, but mostly affects the PD of CO2: thus affecting the Cameron band production in the PD of CO2.
For solar maximum condition, the calculated intensities using the EUVAC model are two times higher than those calculated for solar minimum condition. When the S2K model is used, the respective intensities of UV doublet and Cameron band emissions are 1.3 and 1.6 times larger in high solar activity than those in low solar activity condition. For the EUVAC solar flux model, the variation in contribution of electron impact processes are more prominent for change in solar activity from low to high due to a change of more than a factor of 2 in the solar EUV flux below 250 Å, whereas solar EUV flux in the S2K model varies by less than a factor of 2 from solar minimum to maximum condition.
4.2 CO() triplet emissions on Venus
The PD of CO2 below 1080 Å leads to the formation of CO(a), but at photon energies greater than 12.4 eV (wavelength 1000 Å), other channels open up. The PD of CO2 in the 10.3-13.8 eV (1200–900 Å) region leads to the channel CO* + O(3P), where CO* corresponds to four triplet levels a, a, d, and e. Emissions arising due to the transition from the , , and states to the a state are called Asundi, Triplet, and Herman bands, respectively. Conway (1981) reported that the CO Cameron band spectra observed by Mariner showed a very hot rotational distribution. His analysis showed a bimodal fit with temperatures 1600 K and 10,000 K. Analysis of SPICAM/Mars Express data also showed similar hot distribution (Kalogerakis et al., 2012).
Recently, Kalogerakis et al. (2012) studied the PD of CO2 in laboratory and found strong emissions in the visible and near-IR region arising from the CO() triplet states. They attributed these triplet band emissions to be the primary source for the CO(a–X) Cameron bands. Kalogerakis et al. (2012) concluded that most of the observed Cameron band arising from PD of CO2 is preceded by the cascading from the CO() triplet states, and predicted that the visible and near-IR (6000 to 14000 Å) emissions from these triplet states is of the same magnitude as the CO Cameron band.
Using the study of Kalogerakis et al. (2012), one can predict the lower limit of Asundi, triplet, and Herman bands in the atmosphere of Venus, if only PD of CO2 is considered as the primary source of these CO() triplet states. Results from the present study show that for solar minimum condition the contribution of PD of CO2 to the CO Cameron band production on Venus is 5.7 kR (see Table 2). Thus, the CO() emissions would also be about 5.7 kR on Venus, spread over the 6000 to 14000 Å range. The Asundi (5-0) band at 7830 Å is about 10% of the total triplet band emissions (Kalogerakis et al., 2012), thus its overhead intensity on Venus would be about 570 R. Similarly, during the solar maximum condition total intensity of CO() triplet and Asundi (5-0) bands on Venus would be 7.5 kR and 750 R, respectively. The maximum fraction of Cameron band originates from electron impact on CO2 and CO on Venus and these processes do not exclude similar CO product (Kalogerakis et al., 2012). The magnitude of CO() triplet bands on Venus reported above would be a lower limit; hence, an upper limit could be larger by a factor of 2 to 3.
4.3 Calculation of other ultraviolet emissions
Currently, after a prolonged minimum, the Sun is in the ascending phase of solar activity with moderate condition. As discussed in Section 3.3, we have carried out model calculations for the moderate (F10.7 = 130) solar activity condition. For the SPICAV/VEX observation of UV dayglow emissions during the current solar moderate condition, our model predicts the CO Cameron band (CO UV doublet) intensity of 2200 kR (330 kR) at an altitude of 135 km. Based on our earlier calculations of N2 triplet band emissions on Venus (Bhardwaj and Jain, 2012a), in moderate solar activity condition we predict the maximum intensity of about 10 kR for N2 Vegard-Kaplan (0, 6) emission at the altitude of 135 km (see Figure 9). The N2 VK (0, 6) emission at 2762 Å has been observed on Mars (Leblanc et al., 2006), and is the brightest emission in the N2 VK band system (Jain and Bhardwaj, 2011; Bhardwaj and Jain, 2012a). The intensity of other prominent transition of N2 VK band can be calculated using the intensity ratio provided in our earlier calculations (Jain and Bhardwaj, 2011; Bhardwaj and Jain, 2012a, b). We have also calculated the limb intensity of N2 VK band in the wavelength range 1500–3000 Å (that lies within the SPICAV UV measurement range), which is shown in Figure 9. The maximum limb intensity of N2 VK band in the 1500–3000 Å range is about 60 kR for solar moderate activity condition.
We have recently developed a model for visible atomic oxygen dayglow emissions in the atmosphere of Mars [Jain and Bhardwaj, in preparation]. We have applied this model on Venus and calculated the atomic oxygen 2972 Å (which is within the SPICAV UV measurement range) emission on Venus for moderate solar activity condition. The calculated limb profile of OI 2972 Å emission is presented in Figure 9, which shows two peaks: the lower peak at 115 km has intensity of 375 kR, while the upper peak at 135 km has intensity of 154 kR. The upper peak is mainly due to the photodissociation of CO2 at wavelengths between 860 and 1160 Å, while the lower peak is due to PD of CO2 by solar H Ly- photons (1216 Å). Recent analysis of SPICAM-observed OI 2972 Å emission profile on Mars also suggests a double peak structure (Gronoff et al., 2012).
5 Comparison of model calculations with the recent SPICAV observation
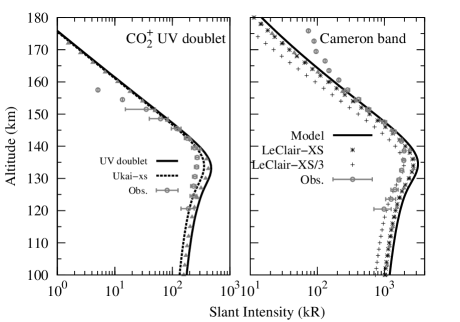
Within weeks of submitting this manuscript, Chaufray et al. (2012) reported the first dayglow observation of CO Cameron band and CO UV doublet emissions on Venus by SPICAV aboard Venus Express. The SPICAV observations were made between October and December 2011, with solar zenith angles varying between 20∘ and 30∘. We have carried out calculation for the similar condition as reported by Chaufray et al. (2012) by taking SZA of 25∘ and VTS3 model atmosphere for 15 November 2011 (F10.7 = 148 and F10.7-81 days average = 144). Figure 10 shows the calculated CO Cameron band and CO UV doublet brightness profiles along with the SPICAV-observed profiles taken from Chaufray et al. (2012).
The model calculated brightness of CO Cameron band peaks at 134 km with a value of 3200 kR. The SPICAV-observed peak of Cameron band brightness is situated at km and the magnitude of limb intensity at this altitude is 2000 kR (Chaufray et al., 2012). The calculated intensity at the peak is about 50% higher than the observed value. When the CO(a) production cross section in e-CO collision of LeClair et al. (1994) is used, the limb intensity of Cameron band at the peak altitude is 2700 kR. As mentioned earlier, the cross section obtained by LeClair et al. (1994) might be overestimated by a factor of 3 (see Section 2). On decreasing the LeClair et al.’s measured cross section by a factor of 3, the calculated CO Cameron band brightness at the peak is 2000 kR. For CO ultraviolet doublet emission, maximum limb intensity of 470 kR is obtained at an altitude of 133 km, which is 70% higher than the SPICAV-observed value of 270 kR (at km) (Chaufray et al., 2012). However, this difference is maximum at peak only. At altitudes above (below) the peak, say at 150 km (120 km), the calculated intensity is in agreement with the SPICAM observation. If emission cross section of CO2(B) given by Ukai et al. (1992) is used in the calculation then calculated UV doublet emission intensity (see dashed curve in Figure 10) is 30% higher than the observation. The observed profile of CO UV doublet emission may contain a small portion of OI 2972 Å emission (Chaufray et al., 2012), which makes the shape of observed brightness profile different than the calculated emission profile at lower altitudes. The comparison between calculation and observation depends on factors such as local variations in the neutral atmosphere–density and temperature depending on F10.7, winds and vertical transport, averaging over 3 months to get the adequate S/N ratio for the observational profiles, and moreover uncertainty in the model calculation. For example, model calculated intensities of CO Cameron band and CO UV doublet emissions decreases by 13% (see Figure 10) on 8 October 2011 (F10.7 = 118.3 and F10.7-81 days average = 140.6, and SZA = 25∘).
Chaufray et al. (2012) have derived the overhead intensity of 25.3 kR and 3.2 kR for Cameron band and CO UV doublet emissions, respectively, by converting the limb intensity to zenith brightness above sub-solar point. These values are significantly lower than our model calculated height-integrated overhead intensities of 70 and 8 kR (at SZA = 25∘) for Cameron band and CO UV doublet emissions, respectively. This discrepancy in the calculated and observation-derived overhead intensity is significant and it is difficult to reconcile or comment on the cause for this difference at present and further investigation is needed.
The calculated altitude of peak brightness of both CO Cameron band and CO UV doublet emissions is lower by 5 km than the observation. The difference in peak altitude of observed and calculated emissions shows that the upper atmospheric neutral density is smaller in our model calculation. Recent general circulation model for Venus (VTGCM) also suggests that VTS3 empirical model is inadequate to properly represent lower thermosphere thermal structure (Brecht and Bougher, 2012). Density profile of CO2 calculated by VTGCM vary significantly from that calculated by VTS3 model above 100 km.
6 Summary and Conclusions
We have presented the model calculation of CO Cameron band and CO doublet ultraviolet emissions in the dayglow of Venus and assessed the impact of solar EUV flux model on the calculated intensities. The calculated volume production rates of CO Cameron band and CO UV doublet emissions are height-integrated to compute the overhead intensity and integrated along the line of sight to obtain the limb intensities for low, moderate, and high solar activity conditions. With updated cross section, the electron impact on CO is found to be the major source of CO(a) production followed by electron and photon impact dissociation of CO2. The major source of CO UV doublet emission in Venusian dayglow is photoionization of CO2 followed by electron impact ionization of CO2. The contribution of fluorescence scattering by CO to the CO UV doublet emission is quite negligible. The calculated overhead intensities of CO Cameron band and CO UV doublet emission are about a factor of 2 higher in the solar maximum condition than those during the solar minimum condition. This variation in intensity from low to high solar activity depends upon the solar EUV flux model used in the calculation, e.g., when the S2K model is used instead of EUVAC, the emission intensities of CO Cameron band and CO UV doublet vary by less than a factor of 2. The effect of solar EUV flux models on the emission intensity is 30-40% in solar minimum condition and 2-10% in solar maximum condition.
For the SPICAV/VEX observation of UV dayglow emissions during the solar moderate condition, we have predicted the limb intensity of about 2400 and 300 kR for CO Cameron band and CO UV doublet emissions, respectively. We have also predicted the intensities of N2 Vegard-Kaplan UV bands (60 kR in wavelength range 1500–3000 Å, peaking at 135 km) and OI 2972 Å emission (375 kR at lower ( 115 km) and 155 kR at upper (135 km) peak) in moderate solar activity condition.
We have compared our calculated limb intensity of CO Cameron band and CO UV doublet emissions with the first observation of these emissions on Venus using SPICAV/VEX (Chaufray et al., 2012). The calculated intensity of CO Cameron band at the peak altitude is about 50% higher than the SPICAV observation. However, when the CO(a) production cross section in e-CO collision measured by LeClair et al. (1994) is used in the model calculation, this difference reduces to 30% and with a correction by a factor of 3 in cross section, the magnitude of calculated brightness at peak is in good agreement with the observation. The calculated maximum brightness of CO doublet emission is 70% higher than the SPICAV observation. However, when CO(B) emission cross section of Ukai et al. (1992) is used, the calculated maximum intensity agrees better with the observation. We found that our calculated overhead intensities of the two emissions is significantly higher than those derived from the observations. It may be noted that a number of factors can affect the comparison between observation and calculation, e.g., observed brightness profiles are averaged of several measurements spanning over 3 months during which variation in the solar zenith angle and other local variations in neutral atmosphere and temperature can affect the dayglow emissions. Moreover, uncertainties in the model input parameters can also cause discrepancy between observed and calculated brightness profiles. Presently, it is difficult to comment on this discrepancy and further investigation is needed. Our model calculated peak altitude of CO Cameron band and CO UV doublet emission profiles is lower than that observed by SPICAV, indicating lower neutral density in the VTS3 model atmosphere for Venus used in our calculation.
The present study has clearly demonstrated that the cross section of a state in e-CO process is important in modelling CO Cameron band emission on Mars and Venus. The contribution of e-CO process in CO Cameron band also depends on the density of CO in the atmosphere; hence, it is difficult to constrain the former without fixing the latter. Present calculation also showed that use of excitation and emission cross section of CO(B) can affect the UV doublet emission intensity, and one should be careful while using these cross sections in the model calculation. A more detailed study of these emissions taking the Venus thermosphere general circulation model (VTGCM) needs to be carried out to understand the recent SPICAV observations.
References
- Ajello (1971a) Ajello, J. M. (1971a), Emission cross sections of CO2 by electron impact in the interval 1260-4500 Å, J. Chem. Phys., 55, 3169 – 3177, doi:10.1063/1.1676564.
- Ajello (1971b) Ajello, J. M. (1971b), Emission cross section of CO by electron impact in the interval 1260-5000 Å, J. Chem. Phys., 55, 3158 – 3168, doi:10.1063/1.1676563.
- Avakyan et al. (1998) Avakyan, S. V., R. N. II’in, V. M. Lavrov, and G. N. Ogurtsov (1998), in Collision Processes and Excitation of UV Emission from Planetary Atmospheric Gases: A Handbook of Cross Sections, edited by S. V. Avakyan, Gordon and Breach science publishers.
- Bertaux et al. (1981) Bertaux, J. L., J. E. Blamont, V. M. Lepine, V. G. Kurt, N. N. Romanova, and A. S. Smirnov (1981), Venera 11 and Venera 12 observations of EUV Emissions from the upper atmosphere of Venus, Planet. Space Sci., 29(2), 149 – 166.
- Bhardwaj (1999) Bhardwaj, A. (1999), On the role of solar EUV, photoelectrons, and auroral electrons in the chemistry of C(1D) and the production of CI 1931 Å in the inner cometary coma: A case for comet P/Halley, J. Geophys. Res., 104, 1929 – 1942, doi:10.1029/1998JE900004.
- Bhardwaj (2003) Bhardwaj, A. (2003), On the solar EUV deposition in the inner comae of comets with large gas production rates, Geophys. Res. Lett., 30(24), 2244, doi:10.1029/2003GL018495.
- Bhardwaj and Jain (2009) Bhardwaj, A., and S. K. Jain (2009), Monte Carlo model of electron energy degradation in a CO2 atmosphere, J. Geophys. Res., 114, A11309, doi:10.1029/2009JA014298.
- Bhardwaj and Jain (2012a) Bhardwaj, A., and S. K. Jain (2012a), Calculations of N2 triplet states vibrational populations and band emissions in venusian dayglow, Icarus, 217, 752 – 758, doi:10.1016/j.icarus.2011.05.026.
- Bhardwaj and Jain (2012b) Bhardwaj, A., and S. K. Jain (2012b), Production of N2 Vegard-Kaplan and other triplet band emissions in the dayglow of Titan, Icarus, 218(2), 989 – 1005, doi:10.1016/j.icarus.2012.01.019.
- Bhardwaj and Michael (1999) Bhardwaj, A., and M. Michael (1999), Monte Carlo model for electron degradation in SO2 gas: cross sections, yield spectra and efficiencies, J. Geophys. Res., 104(10), 24,713 – 24,728, doi:10.1029/1999JA900283.
- Bhardwaj and Raghuram (2011) Bhardwaj, A., and S. Raghuram (2011), Model for Cameron-band emission in comets: A case for the EPOXI mission target comet 103P/Hartley 2, Mon. Not. R. Astron. Soc. Lett., 412, L25 – L29, doi:10.1111/j.1745-3933.2010.00998.x.
- Bhardwaj et al. (1990) Bhardwaj, A., S. A. Haider, and R. P. Singhal (1990), Auroral and photoelectron fluxes in cometary ionospheres, Icarus, 85, 216 – 228, doi:10.1016/0019-1035(90)90112-M.
- Brecht and Bougher (2012) Brecht, A. S., and S. W. Bougher (2012), Dayside thermal structure of Venus’ upper atmosphere characterized by a global model, J. Geophys. Res., 117, E08002, doi:10.1029/2012JE004079.
- Broadfoot et al. (1974) Broadfoot, A. L., S. Kumar, M. J. S. Belton, and M. B. McElroy (1974), Ultraviolet observations of Venus from Mariner 10: Perliminary results, Science, 183, 1315 – 1318.
- Broadfoot et al. (1977) Broadfoot, A. L., S. S. Clapp, and F. E. Stuart (1977), Mariner 10 ultraviolet spectrometer: airglow experiment, Space Sci. Instrum., 3, 199.
- Chaufray et al. (2012) Chaufray, J.-Y., J.-L. Bertaux, and F. Leblanc (2012), First observation of the Venus UV dayglow at limb from SPICAV/VEX, Geophys. Res. Lett., 39, L20201, doi:10.1029/2012GL053626.
- Conway (1981) Conway, R. R. (1981), Spectroscopy of the Cameron bands in the Mars airglow, J. Geophys. Res., 86, 4767 – 4775, doi:10.1029/JA086iA06p04767.
- Dalgarno and Degges (1971) Dalgarno, A., and T. C. Degges (1971), CO Dayglow on Mars and Venus, in Planetary Atmospheres, Proceedings from 40th IAU Symposium held in Marfa, Texas, Oct. 26–31, 1969, vol. 40, edited by C. Sagan, T. C. Owen, and H. J. Smith, p. 337.
- Erdman and Zipf (1983) Erdman, P. W., and E. C. Zipf (1983), Electron-impact excitation of the Cameron system () of CO, Planet. Spece. Sci., 31, 317 – 321, doi:10.1016/0032-0633(83)90082-X.
- Fox (2009) Fox, J. L. (2009), Morphology of the dayside ionosphere of Mars: Implications for ion outflows, J. Geophys. Res., 114, E12005, doi:10.1029/2009JE003432.
- Fox and Bougher (1991) Fox, J. L., and S. W. Bougher (1991), Structure, luminosity, and dynamics of the Venus thermosphere, Space Sci. Rev., 55, 357 – 489, doi:10.1007/BF00177141.
- Fox and Dalgarno (1979) Fox, J. L., and A. Dalgarno (1979), Ionization, luminosity, and heating of the upper atmosphere of Mars, J. Geophys. Res., 84, 7315 – 7333, doi:10.1029/JA084iA12p07315.
- Fox and Dalgarno (1981) Fox, J. L., and A. Dalgarno (1981), Ionization, luminosity and heating of upper atmosphere of Venus, J. Geophys. Res., 86, 629 – 639, doi:10.1029/JA086iA02p00629.
- Furlong and Newell (1996) Furlong, J. M., and W. R. Newell (1996), Total cross section measurement for the metastable state in CO, J. Phys. B, 29, 331 – 338, doi:10.1088/0953-4075/29/2/020.
- Gérard et al. (2011a) Gérard, J.-C., B. Hubert, J. Gustin, V. I. Shematovich, D. Bisikalo, G. R. Gladstone, and L. W. Esposito (2011a), EUV spectroscopy of the Venus dayglow with UVIS on Cassini, Icarus, 211(1), 70 – 80, doi:10.1016/j.icarus.2010.09.020.
- Gérard et al. (2011b) Gérard, J.-C., J. Gustin, B. Hubert, G. R. Gladstone, and L. W. Esposito (2011b), Measurements of the helium 584 Å airglow during the Cassini flyby of Venus, Planet. Space Sci., 59, 1524 – 1528, doi:10.1016/j.pss.2011.06.018.
- Gilijamse et al. (2007) Gilijamse, J. J., S. Hoekstra, S. A. Meek, M. Metsälä, S. Y. T. van de Meerakker, S. Y. T, G. Meijer, G. C. Groenenboom, and G. C. (2007), The radiative lifetime of metastable CO (a=0), J. Chem. Phys., 127, 221,102–4, doi:10.1063/1.2813888.
- Gronoff et al. (2008) Gronoff, G., J. Lilensten, C. Simon, M. Barthélemy, F. Leblanc, and O. Dutuit (2008), Modelling the Venusian airglow, Astron. Astrophys., 482(3), 1015 – 1029, doi:10.1051/0004-6361:20077503.
- Gronoff et al. (2012) Gronoff, G., C. S. Wedlund, C. J. Mertens, M. Barthélemy, R. J. Lillis, and O. Witasse (2012), Computing uncertainties in ionosphere-airglow models. II - The Martian airglow, J. Geophys. Res., 117, A05309, doi:10.1029/2011JA017308.
- Hedin et al. (1983) Hedin, A. E., H. B. Niemann, W. T. Kasprzak, and A. Seiff (1983), Global empirical model of the Venus thermosphere, J. Geophys. Res., 88(A1), 73 – 83, doi:10.1029/JA088iA01p00073.
- Hubert et al. (2012) Hubert, B., J.-C. Gérard, J. Gustin, D. V. Bisikalo, V. I. Shematovich, and G. R. Gladstone (2012), Cassini-UVIS observation of dayglow FUV emissions of carbon in the thermosphere of Venus, Icarus, 220, 635 – 646, doi:10.1016/j.icarus.2012.06.002.
- Jain and Bhardwaj (2011) Jain, S. K., and A. Bhardwaj (2011), Model calculation of N2 Vegard-Kaplan band emissions in Martian dayglow, J. Geophys. Res., 116, E07005, doi:10.1029/2010JE003778.
- Jain and Bhardwaj (2012) Jain, S. K., and A. Bhardwaj (2012), Impact of solar EUV flux on CO Cameron band and CO UV doublet emissions in the dayglow of Mars, Planet. Space Sci., 63-64, 110 – 122, doi:10.1016/j.pss.2011.08.010.
- Johnson (1972) Johnson, C. E. (1972), Lifetime of CO(a) following electron impact dissociation of CO2, J. Chem. Phys., 57(1), 576 – 577, doi:10.1063/1.1678007.
- Kalogerakis et al. (2012) Kalogerakis, K. S., C. Romanescu, M. Ahmed, K. R. Wilson, and T. G. Slanger (2012), CO prompt emission as a CO2 marker in comets and planetary atmospheres, Icarus, 220, 205 – 210, doi:10.1016/j.icarus.2012.04.028.
- Lawrence (1972) Lawrence, G. (1972), Photodissociation of CO2 to produce CO(a), J. Chem. Phys., 56, 3435 – 3442, doi:10.1063/1.1677717.
- Leblanc et al. (2006) Leblanc, F., J. Y. Chaufray, J. Lilensten, O. Witasse, and J.-L. Bertaux (2006), Martian dayglow as seen by the SPICAM UV spectrograph on Mars Express, J. Geophys. Res., 111, E09S11, doi:10.1029/2005JE002664.
- LeClair et al. (1994) LeClair, L. R., M. D. Brown, and J. W. McConkey (1994), Selective detection of O(1S) and CO(a) following electron impact on CO using solid xenon, Chem. Phys., 189, 769 – 777.
- LeCompte et al. (1989) LeCompte, M. A., L. J. Paxton, and A. I. F. Stewart (1989), Analysis and Interpretation of Observations of Airglow at 297 nm in the Venus Thermosphere, J. Geophys. Res., 94(A1), 208 – 216.
- Morgan and Tennyson (1993) Morgan, L. A., and J. Tennyson (1993), Electron impact excitation cross sections for CO, J. Phys. B, 26, 2429 – 2441, doi:10.1088/0953-4075/26/15/026.
- Raghuram and Bhardwaj (2012) Raghuram, S., and A. Bhardwaj (2012), Model for the production of CO Cameron band emission in Comet 1P/Halley, Planet. Space Sci., 63-64, 139 – 149, doi:10.1016/j.pss.2011.11.011.
- Richards et al. (1994) Richards, P. G., J. A. Fennelly, and D. G. Torr (1994), EUVAC: A solar EUV flux model for aeronomic calculations, J. Geophys. Res., 99, 8981 – 8992, doi:10.1029/94JA00518.
- Schunk and Nagy (2000) Schunk, R. W., and A. F. Nagy (2000), Ionospheres: Physics, Plasma Physics, and Chemistry, Cambridge University Press.
- Seiersen et al. (2003) Seiersen, K., A. Al-Khalili, O. Heber, M. J. Jensen, I. B. Nielsen, H. B. Pedersen, C. P. Safvan, and L. H. Andersen (2003), Dissociative recombination of the cation and dication of CO2, Phys. Rev. A, 68(2), 022,708, doi:10.1103/PhysRevA.68.022708.
- Simon et al. (2009) Simon, C., O. Witasse, F. Leblanc, G. Gronoff, and J.-L. Bertaux (2009), Dayglow on Mars: Kinetic modeling with SPICAM UV limb data, Planet. Spece. Sci., 57, 1008 – 1021, doi:10.1016/j.pss.2008.08.012.
- Singhal and Bhardwaj (1991) Singhal, R. P., and A. Bhardwaj (1991), Monte Carlo simulation of photoelectron energization in parallel electric fields: Electroglow on Uranus, J. Geophys. Res., 96, 15,963 – 15,972, doi:10.1029/90JA02749.
- Singhal et al. (1980) Singhal, R. P., C. Jackman, and A. E. S. Green (1980), Spatial aspects of low and medium energy electron degradation in N2, J. Geophys. Res., 85(A3), 1246 – 1254, doi:10.1029/JA085iA03p01246.
- Skrzypkowski et al. (1998) Skrzypkowski, M. P., T. Gougousi, R. Johnsen, and M. F. Golde (1998), Measurement of the absolute yield of CO(a3)+O products in the dissociative recombination of CO ions with electrons, J. Chem. Phys., 108, 8400 – 8407, doi:10.1063/1.476267.
- Tobiska (2004) Tobiska, W. K. (2004), SOLAR2000 irradiances for climate change, aeronomy and space system engineering, Adv. Space Res., 34, 1736 – 1746, doi:10.1016/j.asr.2003.06.032.
- Ukai et al. (1992) Ukai, M., K. Kameta, N. Kouchi, K. Nagano, and Y. Hatano (1992), Autoionizing-resonance enhanced preferential photodissociation of CO2 in superexcited states, J. Chem. Phys., 97(5), 2835 – 2842, doi:10.1063/1.463026.
- Wells et al. (1972) Wells, W. C., W. L. Borst, and E. C. Zipf (1972), Production of CO(a) and other metastable fragments by electron impact dissociation of CO2, J. Geophys. Res., 77(1), 69 – 75, doi:10.1029/JA077i001p00069.