The effect of initial conditions on the electromagnetic radiation generation in type III solar radio bursts
Abstract
Extensive particle-in-cell simulations of fast electron beams injected in a background magnetised plasma with a decreasing density profile were carried out. These simulations were intended to further shed light on a newly proposed mechanism for the generation of electromagnetic waves in type III solar radio bursts [D. Tsiklauri, Phys. Plasmas, 18, 052903 (2011)]. The numerical simulations were carried out using different density profiles and fast electron distribution functions. It is shown that electromagnetic L and R modes are excited by the transverse current, initially imposed on the system. In the course of the simulations no further interaction of the electron beam with the background plasma could be observed.
I Introduction
It is widely accepted that there is a correlation between super-thermal electron beams and type III solar radio bursts Ginzburg and Zhelezniakov (1958); Lin et al. (1981). Whilst the correlation is an established fact, the actual mechanism that generates the type III burst emission is not yet fully determined. The main source of the uncertainty is our current inability to send in-situ probes at distances from the solar surface (photosphere). The most widely accepted mechanism, that historically appeared first is the plasma emission Ginzburg and Zhelezniakov (1958). In plasma emission mechanism quasilinear theory, kinetic Fokker-Planck type equation for describing the dynamics of an electron beam is used, in conjunction with the spectral energy density evolutionary equations for Langmuir and ion-sound waves. Further, non-linear wave-wave interactions between Langmuir, ion-acoustic and electromagnetic (EM) waves produce emission at electron plasma frequency, or the second harmonic, Melrose and McPhedran (2005). A variant of the plasma emission mechanism is the stochastic growth theory Robinson (1992), where density irregularities produce a random growth, in such a way that Langmuir waves are generated stochastically and quasilinear interactions within the Langmuir clumps cause the beam to fluctuate about marginal stability. The latter models have been used for producing the solar type III burst observable parameters Li et al. (2008). Other possible mechanisms include: linear mode conversion Cairns and Willes (2005), antenna radiation Malaspina et al. (2012) and non-gyrotropic electron beam emission Tsiklauri (2011).
Recent works Pechhacker and Tsiklauri (2012a, b) elucidated further the non-gyrotropic electron beam emission, first proposed in Ref.Tsiklauri (2011). In particular, the effect of electron beam pitch angle and density gradient on solar type III radio bursts was studied Pechhacker and Tsiklauri (2012b) and the role of electron cyclotron maser (ECM) emission with a possible mode coupling to the z-mode was explored Pechhacker and Tsiklauri (2012a). In this paper, using large-scale Particle-In-Cell (PIC) simulations, we explore the non-gyrotropic electron beam emission mechanism by studying the effects of electron beam kinetics and -space drift, in long term evolution of electromagnetic emission generation of type III solar radio bursts. The following improvements and progress in understanding of the radio emission mechanism are made: (i) Improved numerical simulations with larger spatial domain and longer end-simulation times; (ii) The electron beam injection on a density plateau followed by a decreasing density gradient the latter mimicing the Sun-earth system; (iii) Consideration of a ring and shifted ring electron initial velocity distribution functions; (iv) The role of the -space drift in the radio emission; It is worthwhile to note that Ref.Pechhacker and Tsiklauri (2012a) proposed mode coupling on the density gradient as a source of radio emission as opposed to the -space drift advocated in the present work. The situation is analogous to the auroral waves emitted near the plasma frequency in Earth auroral ionosphere Layden et al. (2011).
II Simulation Setup
We simulate the injection and traversal of the electron beam through a density gradient using the fully relativistic particle in cell simulation code EPOCH. The code uses Boris scheme Boris (1970); Birdsall and Langdon (1985) for advancing the particles together with the charge conserving method by Esirkepov Esirkepov (2001) for calcultaing the currents. The shape function of the particles, and thus the order of the weighting scheme, can be chosen between top-hat (second order), triangular (third order) and spline interpolation (5th order). The electromagnetic fields are solved using the finite difference time domain (FDTD) algorithm on a Yee gridYee (1966); Taflove and Hagness (2005). Open boundaries have been implemented using convolutional perfectly matched layers (CPML) Roden and Gedney (2000) and were ported into EPOCH from a previuos code for simulating electromagnetic pulse propagation in transparent mediaSchmitz et al. (2012).
We perform 1-dimensional calculations of the density gradient between Sun and Earth. The density drops from near the Sun to near the Earth. The density is assumed to follow a parabolic profile
| (1) |
where is the size of the simulation box and is the coordinate along the 1-dimensional simulation domain. In some simulations, the density profile is extended towards the left by a constant density plateau with the maximum density . The extent of this plateau is chosen to be . The background plasma temperature is assumed to be K. Due to computational restrictions we are limited to 65000 grid points for most of the simulation runs and to 130000 grid points for two larger runs, hereafter denoted as long runs. In order to avoid numerical heating, PIC simulations usually have to resolve the Debye length. The minimum of the Debye length in the system is at the location of the highest density, near the Sun and evaluates to m. Because of these limitations, we cannot hope to simulate the complete system with a 1:1 scaling. We are therefore forced to compress the distance between Sun and Earth do a manageable length. We choose a system length of m for the standard runs and m for the long runs. This means that we under-resolve the Debye length by a factor of approximately 2. In order to suppress numerical heating the 5th order spline interpolation is chosen for the particle weighting in all runs. While numerical heating will still be present, it takes place on time-scales much longer than the simulation time. It can, therefore, be neglected. Performing under-resolved simulations using a higher order interpolation scheme is frequently employed when studying interaction of lasers with solid density plasmas Schmitz (2012).
While the box length is still much shorter than the Sun-Earth distance, we anticipate that the underlying physics do not change drastically. Naturally, there are limitations to this. Any effect that increases with the density gradient will be artificially enhanced. On the other hand we will only be able to observe effects that happen on very short time scales and long time scale effects will not be present in the simulations.
In previous investigationsTsiklauri (2011); Pechhacker and Tsiklauri (2012a) the density profile was chosen to be symmetrical, i.e. in equation (1) was replaced by , and boundary conditions were periodic. This had the consequence that only half of the simulation domain could be used. Here we simulate only one half of the symmetric parabolic density profile. This is achieved by using open (absorbing) boundary conditions on both sides. In order to avoid rarefaction waves due to the escaping of particles at the boundaries, the background plasma density tends towards zero in a thin layer near the boundaries of the simulation domain.
The beam is set up as a separate electron population near the left boundary of the domain with a density profile specified by
| (2) |
where is the beam density. This means that the beam density has a roughly flat profile with a length of . When a density plateau is present the initial beam profile will sit completely within the constant density region. We perform these runs in order to investigate the influence of the density gradient at the injection location on the emitted radiation. The beam temperature is assumed to be K and the average speed of the beam electrons is , where is the speed of light. The electron distribution function assumed to be thermal in the – plane, where is the velocity parallel to the simulation domain and is the velocity perpendicular to the simulation domain. The drift velocity is assumed to be equal in the and the perpendicular directions,
| (3) |
where is the electron mass and the distribution function has been integrated over the azimuthal angle in the perpendicular velocity plane –. Due to this integration, the choice of the distribution function is not unique. We have initialised the electron beam with two different distribution functions in the perpendicular plane. The first choice represents a beam, purely in the direction,
| (4) |
In the following we will refer to this distribution as the directed beam distribution. The second choice corresponds to a ring in the – plane,
| (5) |
This distribution will be called the ring distribution. Note that both distribution functions result in the same distribution function when integrated over the azimuthal angle in the – plane.
In addition, we impose a constant background magnetic field of G along the -axis. The choice of the magnetic field results in a ratio of cyclotron frequency to plamsa frequency of , at , which means the plasma is weakly magnetised. The density gradient, together with the constant magnetic field and constant background temperature, implies that the plasma is not in pressure balance. This is justified due to the fact that the solar wind itself is not in pressure balance, as it continually flows outward. Due to the short times we do not observe any tendency towards a pressure equilibrium during the course of the simulations.
All three particle species, ions, background electrons and beam electrons are initialised with 500 particles per cell. Due to the localisation of the beam, however, the total number of beam particles is substantially less than that of the background electrons. The simulations were run on 512 cores and took typically around 40h.
We would like to note that the chosen length scales and parameters are more suited for studying the EM wave generation in the vicinity of the Sun rather than addressing the question radio burst propagation between the Sun and Earth. The reason is three-fold: (i) We wish to focus on solar coronal type III radio bursts, not the inter-planetary ones, which have much longer durations and hence different frequency drift ranges. (ii) The parameter choice is not vital for the physics of mechanism itself. For example, our near-Earth density is taken 1010 m-3, which is not realistic, of course, but the exact value of is not important for the result. Due to the parabolic shape of the density profile, there is only a noticeable difference between our density profile and one with m-3 (the realistic value) in only the rightmost 5% of the simulation domain. That is not where any important physics takes place. The distances in our graphical results are normalised to , thus, in principle, by adjusting the number density, the spatial re-scaling can be performed to up-scale the results to the real Sun-Earth distance. The chosen beam density m-3 is essentially a free parameter, which only sets the time-scale of quasi-linear relaxation (Sec. IV, however, mentions that some models, such as plasma emission, put their constraints). The chosen magnetic field, circa 3 Gauss, is realistic for some heights above solar coronal active regions, but the main constraint is the need to satisfy Maxwell’s equation , in one dimension. Thus we cannot allow magnetic field variation in . Our model also ignores a variation of temperature with distance, but we think its effect is probably not essential – the density gradient is, however. (iii) The aim of this work is to study micro-plasma-kinetic physics of the radio emission generation. The present results are state-of-the-art what can be achieved with the current, available to authors’, computational resources – 512 parallel computer processors. The radio burst propagation between the Sun and Earth are addressed by another set of models, which use quasi-linear plasma theory that does not resolve micro-physics and hence cannot address the question of the generation mechanism of the radio emission.
III Results
III.1 Density Gradient at Injection Location
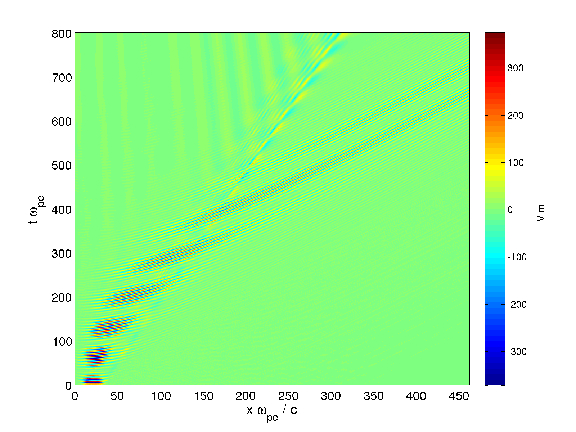
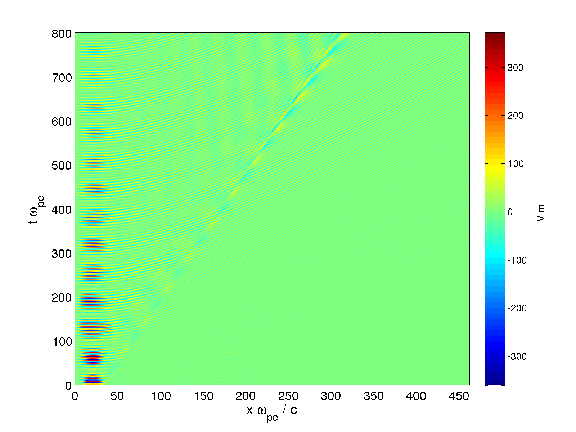
We first investigate the influence of the density gradient at the injection location. Figure 1 shows the perpendicular electric field component as a function of position and time . The top panel shows the result from the reference run in which the Maxwellian electron beam is injected into the density gradient. The plot clearly shows that the electric field oscillates roughly with the plasma frequency from the onset of the simulation. The oscillation is restricted to the beam region but shows no other spatial dependence initially. This indicates that the oscillation is imposed by the initial conditions linked to the strong current present in the initial distribution function. In addition to the oscillation, one can observe beating of the oscillations at roughly the electron cyclotron frequency . This indicates that at least two wave modes are initially excited with a frequency difference of . After about the wave packet, which was originally located at the injection location, starts to expand into the lower density region. Here the phase velocity gradually descreases from almost infinity and the lines of equal in the – diagram start turning from near horizontal to a finite . After about it becomes obvious that the group velocity is beginning to increase from near zero to a finite velocity and the wave packet starts moving into regions of lower density. As the wave packet moves into a lower and lower density environment, the process continues as the phase velocity decreases and the group velocity increases. At a time of about the phase and group velocity have almost equalised to , where is the speed of light. The originally immobile wave packet has turned into an electromagnetic wave and is allowed to freely escape.
The dynamics of the electromagnetic wave packet is almost completely decoupled from the electron beam dynamics. While the electron beam imposes a strong current initially, which provides the initial conditions for the electromagnetic field, the beam subsequently travels with a constant velocity of , as prescribed by the initial conditions, into the low density region. The beam only weakly interacts with the electromagnetic field when the wave packet starts overtaking the beam. At around the front of the wave packet reaches the electron beam and a slight disturbance in the field can be observed. At the wave packet has almost overtaken the beam completely. One can observe a slight enhancement of the electric field at the beam location in the trailing part of the wave packet, but this does not modify the wave packet as it keeps moving towards the right. One can, however, observe a wake of the beam in the perpendicular electric field . This wake does not seem to travel freely but is tied to the location of the beam and is not converted into a free electromagnetic radiation during the course of the simulation.
The lower panel of figure 1 shows the electric field for the simulation in which the electron beam is injected into a density plateau. Again, one can observe an electric field oscillation at electron plasma frequency, beating with the cyclotron frequency. The wave packet remains much more localised to the injection region, as compared to the previous run. At the packet expands towards the right past into the region where the density ramp starts. In the density ramp the phase velocity can also be observed to decrease with increasing . Due to this process waves escape towards the right and finally end up travelling with a phase speed of almost in the lower density region. In contrast to the previous run the bulk of the wave packet remains stationary at the injection location and only slowly loses its energy to the escaping electromagnetic radiation. This, in turn, means that the radiation produced in this manner is of lower intensity but lasts over a longer time span.
III.2 Influence of Beam Distribution Function
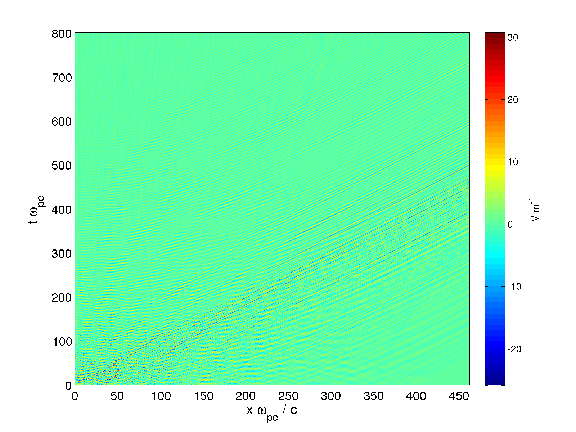
In figure 2 we plot the results for the run in which the electron beam has a ring distribution. Here the electrons are injected into the density ramp, just as described in the first run, and all other simulation parameters are identical. It is evident from the plot that the initial conditions do not excite the electromagnetic field oscillations observed in the previous two simulations. It should be noted that the colour scale in figure 2 has been reduced by more than a factor of 10 with respect to figure 1. The electric field present in the simulation can, almost completely, be attributed to numerical noise present in the simulation. The reason for this can be found in the fact that the initial beam distribution does not impose a current on the system and, hence, no electromagnetic wave modes are excited. Even the electromagnetic fields that the beam left in its wake in the previous two runs are not observed when the distribution is assumed to rotaionally symmetric in the – plane. This indicates that even the wake fields are a result of the particular non centered distribution function. When the electron beam has a ring distribution function there was no indication of an instability which could generate electromagnetic waves during the course of the simulation, at least by the considered simulation end-time.
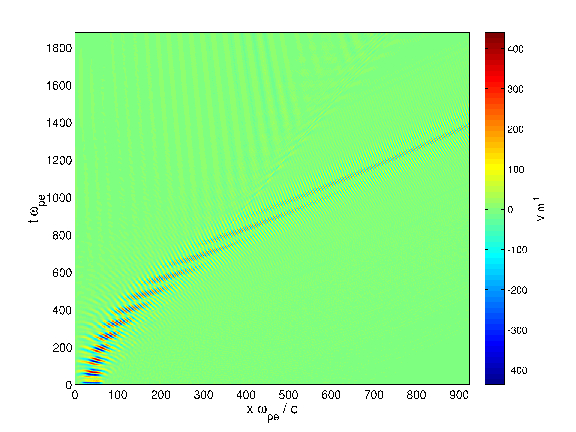
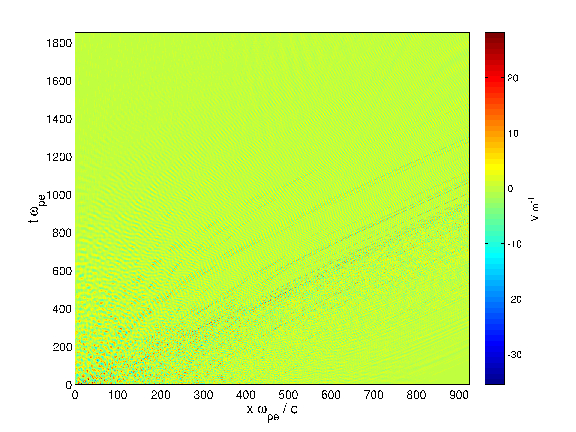
In order to extend the search of electromagnetic radiation by electron cyclotron instability we performed two long runs in which both the size of the simulation box and the simulation time was doubled. This also means that the density gradient and the electron beam length was stretched by the same factor. Runs were performed for the reference scenario and for the ring distribution. The results are presented in figure 3. The plots of the electric field component for these two runs confirm all the observations of the shorter runs. In the reference scenario the wave packet is excited by the initial conditions and accelerates as is moves into the lower density regions. Finally, the wave packet turns into a purely electromagnetic traveling wave and is free to escape the system. The ring distributed electron beam, on the other hand, does not appear to interact with the transverse electromagnetic field in any way during the course of the simulation. This includes the apparent wake field observed in the reference case, which is not present with the ring distributed beam.


In order to show that, in the reference run, the non-gyrotropic nature of the distribution function is still present, while the beam travels down the density ramp and may be responsible for the transverse electric fields, figure 4 shows the – phase space densities for the two long simulation runs. In the reference scenario the distribution function starts off as a Maxwellian peak located at positive but with zero . This peak gyrates in phase with the cyclotron frequency. Because of fluctations in the electromagnetic field, the strongly localised peak is gradually drawn out over a range of phase angles. At the distribution already spreads out over a large phase angle interval spanning more than . The centre of the phase angle distribution is, however, still clearly visible and the distribution resembles a crescent shape in – plane. Even towards the end of the simulation, at when the phase angles are spread out over full , is the centre of the phase angle distribution visible. This means that, throughout the simulation, the perpendicular current imposed by the electron beam from the initial conditions is always present and it is this perpendicular current which is the cause of the perpendicular electromagnetic field in the simulations. The ring distributed electron beam is shown in the right column of figure 4. This distribution does not carry a perpendicular current and can, therefore, not directly excite perpendicular electromagnetic fields. During the course of the simulation we do not observe any deviation of the – phase space distribution from the initial ring distribution.
III.3 Analysis of Wave Modes
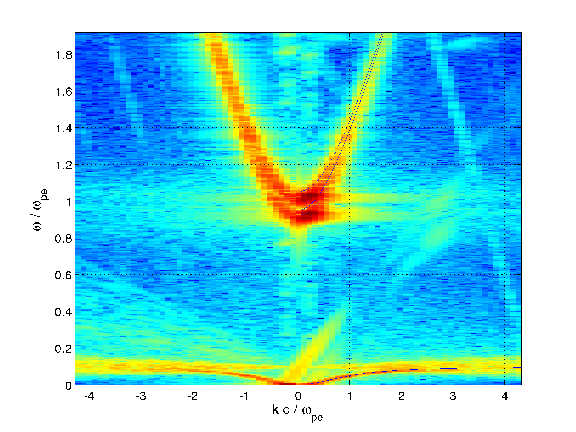
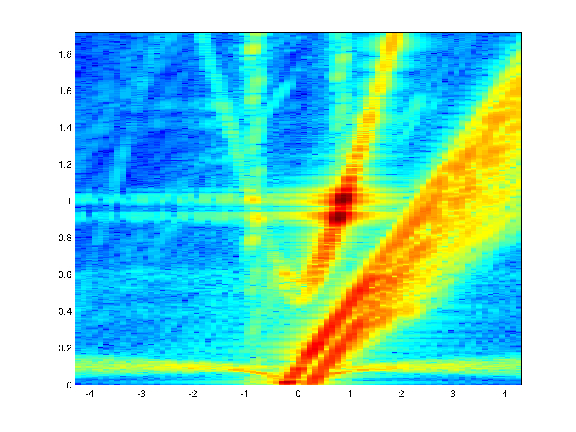
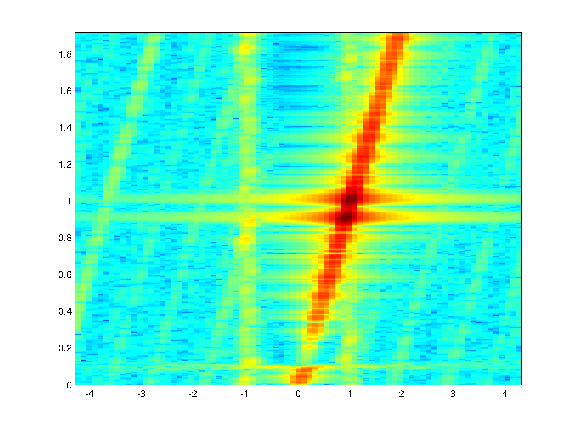
In order to identify the wave modes excited by the electron beam in the reference runs and to identify the mechanism by which the initially resting wave packet is transformed into a freely escaping electromagnetic wave, we have performed two dimensional Fourier analyses of the electric field component in various regions of the simulation. The Fourier transforms were carried out over rectangular strips in the – plane with a with of and a length spanning the whole duration of the simulation. Three different strips centered at , , and were chosen to represent the injection region, the intermediate region, and the free propagation region respectively. The result of the Fourier transforms are shown in Figure 5 using a logarithmic colour scale. The advantage of a logarithmic scale is that one can not only identify the location of the dominant modes but also, due to the presence of numerical noise in the system, the dispersion curves on which the maxima lie become clearly visible.
In the top panel of Figure 5 one can see that modes are excited in the injection region with two slightly different frequencies but identical wave number. The superposition of these two wave modes with similar frequency results in the beating of the electric field oscillations seen in Figure 1. The wave number corresponds to the length of the beam in space and is therefore determined by the size of the initial disturbance. Additional simulations with varying beam lengths (not shown) confirm this notion. The maxima in the Fourier plot lie at the intersection of and the dispersion curves of the L and R modes. These dispersion curves have been calculated using the local plasma parameters, excluding any contribution of the electron beam, and are plotted in the top panel of Figure 5 as solid black curves. Very good agreement between the simulation and analytical dispersion curves of the L and R modes are found, supporting the idea that the electron beam does not influence the propagation of the electromagnetic waves.
Because the wave modes are located near, but not quite on the minimum of the dispersion curve the waves have a small but finite group velocity which causes the wave packet to gradually move towards the lower density region. As the density decreases, the dispersion curves of the L and R modes change, with the minimum moving towards smaller frequencies. This can be seen in the middle panel of Figure 5 which shows the Fourier transformed field in the centre of the simulation domain. The frequencies of the wave modes do not appear to change as the wave moves along the density gradient. This may be understood in terms of the Huygens principle. As the density descreases, the dispersion relation dictates a higher wave number, i.e. a shorter wavelength, for the same frequency waves. This shift in wave number causes the phase velocity of the waves to decrease. At the same time, the group velocity increases as the slope of the dispersion curve increases near the wave modes.
As the wave travels further down the density slope (bottom panel of Figure 5) into a region of almost vanishing background density, the dispersion relation changes into almost a linear curve corresponding to free propagation at speed . Both frequencies are still present and have not changed noticably from the initial values but the wave number has increased further and is now in agreement with a freely propagating electromagnetic wave.
IV Summary and Discussion
We performed extensive particle-in-cell simulations of gyrotropic and non-gyrotropic fast electron beams in a background plasma with a decreasing density profile. The constant magnetic field was aligned with the 1d simulation domain. We investigated the influence of the density gradient at the injection point and of the shape of the distribution function in the transverse plane. Shifted Maxwellian distributions for the hot electrons with a velocity shift in the parallel and perpendicular direction with respect to the magnetic field resulted in a strong perpendicular current and caused electromagnetic wave modes from the onset of the simulation. When the beam was injected into a density gradient these waves started to accelerate and gradually turned into free traveling electromagnetic radio waves. If, on the other hand, the electrons were injected at a density plateau the oscillations did not travel as a wave packet but only slowly leaked out where the tails of the localised packet reached into regions with a density gradient.
The results presented in this paper indicate that the electromagnetic waves observed in the simulation are purely due to the initial conditions imposed on the system. We could not observe any instability which could be the cause of electromagnetic radiation, at least by the considered simulation end-time. In the case of an electron beam injected into a density plateau the electromagnetic waves remained localised and there was no further interaction of the electron beam with the background plasma visible in the perpendicular electromagnetic fields. The electron beam is subject to the electrostatic instabilities leading to localised oscillations in the longitudinal electric field. Due to the 1d nature of the simulations, these electrostatic modes cannot convert into electromagnetic modes via non-linear wave-wave interactions. At first sight, our present results seem to contradict the previous investigations suggesting a novel mechanism based on the electron cyclotron maser instability Pechhacker and Tsiklauri (2012a, b). The latter two papers already state in their ”Note added in proof” that whilst in their presented runs electron cyclotron maser instability condition is met, probably the growth rate is too small for the instability to develop by the simulation end-time. The present results indeed confirm that the role of electron cyclotron maser instability is insignificant and the electromagnetic emission is generated by the transverse initial current due to the non-gyrotropic electron beam.
We stress that the transverse electromagnetic waves which are excited in the simulation are purely due to the initial perpendicular current imposed on the system. To support this notion we performed additional simulations where the shifted Maxwellian was replaced by a ring distribution. Because of symmetry, the ring distribution only carried a parallel current and could not, therefore, excite any transverse electromagnetic waves.
Analysis of the wave modes that were observed in the reference run showed that the initial tranverse current excited both L and R modes with a wavenumber that is governed by the length of the electron beam. Because the frequency of the L and R modes differ by roughly the cyclotron frequency, a beating of the wave packet is observed. When the initial wave packet is excited in the density gradient the front of the packet oscillates at a slightly lower frequency than its tail due to the change in the frequencies of the L and R modes with density. This eventually causes the wave packet to travel down the density ramp. As the wave packet moves into regions of lower density the phase velocity decreases and, at the same time, the group velocity increases until, at low background densities, the wave travels freely in the form of a vacuum electromagnetic wave.
We would like to close with the discussion of relation of the present results to the observational aspects of solar type III radio bursts. As mentioned in the Introduction section, the actual mechanism that generates the radio bursts is an active line of investigation with several mechanisms put forward Ginzburg and Zhelezniakov (1958); Melrose and McPhedran (2005); Robinson (1992); Malaspina et al. (2012); Cairns and Willes (2005); Tsiklauri (2011); Pechhacker and Tsiklauri (2012a, b). The key distinction of the non-gyrotropic beam mechanism Tsiklauri (2011) from others is that it does not need Langmuir waves to produce the radio emission. As shown clearly in Refs.Pechhacker and Tsiklauri (2012a, b) the non-gyrotropic (i.e. non-zero pitch angle with respect to background magnetic field) electron beam perpendicular velocity component is responsible for the EM emission generation, while the parallel velocity component generates electrostatic Langmuir waves which also leave an imprint (which we refer to as beam wake) on the EM emission. Our previous works Pechhacker and Tsiklauri (2012a, b) made it clear that the beam perpendicular velocity component and density gradient are needed to generate the EM emission. However, it was not clear whether ECM instability has a dominant role or not. Here we have shown that it is the existence of the non-zero perpendicular electron current, injected on the density gradient are generating the EM emission and that the gradient causes wave power drift towards larger , producing the escaping EM radiation (see Fig. 5). Here is how we propose the non-gyrotropic beam mechanism is realised in the solar corona: First of all, there is an indication that solar flare-generated beam is not directly aligned with the ambient magnetic field, i.e. has a finite pitch angle. In addition to the evidence discussed in Ref.Pechhacker and Tsiklauri (2012b), recently, similar results are found using the STEREO Spacecraft and the Nancay Radio Heliograph Krupar (2013). The beam parallel velocity component generates Langmuir waves by the bump-on-tail instability, which are detected in-situ, but have no bearing to the EM emission generation in our mechanism. The beam perpendicular velocity component induces a non-zero transverse current, which then generates the EM emission in ways described above. We should stress that, as can be seen from the left column of Fig. 4, the electron transverse velocity phase-space becomes ring-like very quickly, by , thus shutting off the EM emission generation, as the ring gives zero net transverse current. This means that our mechanism predicts that typical coronal type III burst durations of, say, 1 s, is related to the time-scale of the electron beam continuous-in-time re-injection. In the plasma emission mechanism, the inverse of the growth rate of the bump-on-tail instability, i.e. quali-linear relaxation time, which would be good estimate for EM emission time is . With being, say, s, in oder to get 1 s duration EM emission, one would need – a very dilute beam indeed. The latter may be plausible, but in the corona we cannot measure beam density directly and one has to make do with postulating the range . In the non-gyrotropic beam mechanism, however, because s, the duration of emission is then related to the beam re-injection time, so it serves is a direct diagnostic of the beam injection time-dynamics. Of course, one has to remember that our model is 1.5D and when more that one spatial dimension is allowed, then of course the plasma emission mechanism becomes allowed (as discussed in Ref.Tsiklauri (2011) 1D switches off the plasma emission). Thus, the interplay between plasma emission and non-gyrotropic beam mechanisms depends on the curvature of the background magnetic field: in the field that is purely radial (essentially 1D in space), our mechanism would be dominant, whereas if the transverse curvature is allowed, then both mechanisms can be in action – this depends on the pitch angle i.e. at what angle the electron beam is injected. The key message here is that the non-gyrotropic beam mechanism divorces the radio emission burst duration from plasma kinetics (which is too short-scale in time) and relates it to the electron beam re-injection time scale, which may be an important diagnostic of the beam generation, i.e. whether it is driven by magnetic reconnection process or the electron acceleration by the dispersive Alfven waves Tsiklauri (2012).
Acknowledgements.
This work is funded by Leverhulme Trust research grant RPG-311. Computational facilities used are that of Astronomy Unit, Queen Mary University of London and STFC-funded UKMHD consortium at St Andrews and Warwick Universities. DT is financially supported by STFC consolidated grant ST/J001546/1 and HEFCE-funded South East Physics Network (SEPNET).References
- Ginzburg and Zhelezniakov (1958) V. L. Ginzburg and V. V. Zhelezniakov, Sov. Astron. 2, 653 (1958).
- Lin et al. (1981) R. P. Lin, D. W. Potter, D. A. Gurnett, and F. L. Scarf, Astrophys. J. 251, 364 (1981).
- Melrose and McPhedran (2005) D. Melrose and R. McPhedran, Electromagnetic processes in dispersive media (Cambridge: Cambridge University Press, 2005).
- Robinson (1992) P. A. Robinson, Solar Phys. 139, 147 (1992).
- Li et al. (2008) B. Li, I. H. Cairns, and P. A. Robinson, J. Geophys. Res. 113, 6104 (2008).
- Cairns and Willes (2005) I. H. Cairns and A. J. Willes, Phys. Plasmas 12, 052315 (2005).
- Malaspina et al. (2012) D. M. Malaspina, I. H. Cairns, and R. E. Ergun, Astrophys. J. 755, 45 (2012).
- Tsiklauri (2011) D. Tsiklauri, Phys. Plasmas 18, 052903 (2011).
- Pechhacker and Tsiklauri (2012a) R. Pechhacker and D. Tsiklauri, Phys. Plasmas 19, 110702 (2012a).
- Pechhacker and Tsiklauri (2012b) R. Pechhacker and D. Tsiklauri, Phys. Plasmas 19, 112903 (2012b).
- Layden et al. (2011) A. Layden, I. H. Cairns, P. A. Robinson, and J. LaBelle, J. Geophys. Res. 116, A12328 (2011).
- Boris (1970) J. Boris, in Proc. Fourth Conf. Num. Sim. Plasmas (1970), p. 3, Naval Research Laboratory, Wash. DC.
- Birdsall and Langdon (1985) C. K. Birdsall and A. B. Langdon, Plasma Physics via Computer Simulation (McGraw-Hill, New York, 1985).
- Esirkepov (2001) T. Esirkepov, Computer Physics Communications 135, 144 (2001), ISSN 00104655.
- Yee (1966) K. Yee, Antennas and Propagation, IEEE Transactions on AP-14, 302 (1966).
- Taflove and Hagness (2005) A. Taflove and S. Hagness, Computational electrodynamics (Artech House, Boston, London, 2005), 3rd ed.
- Roden and Gedney (2000) J. A. Roden and S. D. Gedney, Microwave and Optical Technology Letters 27, 334 (2000), ISSN 08952477.
- Schmitz et al. (2012) H. Schmitz, R. Lloyd, and R. G. Evans, Plasma Physics and Controlled Fusion 54, 085016 (2012).
- Schmitz (2012) H. Schmitz, Physics of Plasmas 19, 083115 (2012), ISSN 1070664X.
- Krupar (2013) V. Krupar, (2013), private communication, http://meetingorganizer.copernicus.org/EGU2013/EGU2013-5620.pdf
- Tsiklauri (2012) D. Tsiklauri, Phys. Plasmas 19, 082903 (2012).