11email: nielsenm@mps.mpg.de 22institutetext: Max-Planck-Institut für Sonnensystemforschung, Max-Planck-Straße 2, 37191 Katlenburg-Lindau, Germany 33institutetext: Stellar Astrophysics Centre (SAC), Department of Physics and Astronomy, Aarhus University, Ny Munkegade 120, DK-8000 Aarhus C, Denmark
Rotation periods of main-sequence Kepler stars: Dependence on stellar spectral type and comparison with observations ††thanks: Table 1 are only available in electronic form at the CDS via anonymous ftp to cdsarc.u-strasbg.fr (130.79.128.5) or via http://cdsweb.u-strasbg.fr/cgi-bin/qcat?J/A+A/
Abstract
Aims. We aim to measure the starspot rotation periods of active stars in the Kepler field as a function of spectral type and to extend reliable rotation measurements from F-, G-, and K-type to M-type stars.
Methods. Using the Lomb-Scargle periodogram we searched more than 150 000 stellar light curves for periodic brightness variations. We analyzed periods between 1 and 30 days in eight consecutive Kepler quarters, where 30 days is an estimated maximum for the validity of the PDC_MAP data correction pipeline. We selected stable rotation periods, i.e., periods that do not vary from the median by more than one day in at least six of the eight quarters. We averaged the periods for each stellar spectral class according to B-V color and compared the results to archival data, using stellar radii estimates from the Kepler Input Catalog.
Results. We report on the stable starspot rotation periods of 12 151 Kepler stars. We find good agreement between starspot velocities and data for all F-, G- and early K-type stars. The 795 M-type stars in our sample have a median rotation period of days. We find an excess of M-type stars with periods less than days that are potentially fast-rotating and fully convective. Measuring photometric variability in multiple Kepler quarters appears to be a straightforward and reliable way to determine the rotation periods of a large sample of active stars, including late-type stars.
Key Words.:
Stars: rotation - Starspots - Stars: late-type1 Introduction
Measuring stellar rotation as a function of age and mass is essential to studies of stellar evolution (Maeder, 2009) and stellar dynamos (Böhm-Vitense, 2007; Reiners & Mohanty, 2012). Rotation can be measured at the surface of individual stars using either spectroscopy (e.g., Royer et al., 2004) or periodic variations in photometric light curves due to the presence of starspots (Mosser et al., 2009). On the Sun, sunspots and plage regions modulate the solar irradiance with periods close to the solar rotation period. Brightness variations are also seen in other stars and are commonly attributed to the presence of magnetic activity in the case of main-sequence cool dwarfs (e.g. Berdyugina, 2005). Sunspots and solar active regions have lifetimes of days to weeks (rarely months) (Solanki, 2003) and are reasonably good tracers of solar surface rotation at low latitudes. Starspots have been observed to persist for even longer periods (e.g. Strassmeier, 2009), and they appear at high latitudes as well.
The Kepler mission (Borucki et al., 2010) has been monitoring the light emitted by more than stars since its launch in 2009. Treating such an enormous number of stars obviously demands an automated approach. In this paper we present the results of a straightforward automated method for analyzing Kepler time series and detecting amplitude modulation due to stellar activity, with the aim of determining stellar rotation periods.
2 Measuring stellar rotation
2.1 Kepler photometry
We used white light time series with a cadence of minutes from the NASA Kepler satellite. The data are released in segments of days (quarters) through the Mikulski Archive for Space Telescopes111http://archive.stsci.edu/kepler/ for a total sample of stars currently numbering . We used quarters 2 through 9 (two years of observations in total). The data was processed for cosmic rays and flat fielding prior to release. We used the version of the data that was corrected by the PDC_MAP pipeline (Smith et al., 2012). The PDC_MAP correction attempts to detect and remove systematic trends and instrumental effects, which are common to a large set of adjacent stars on the photometer. In addition, we used the most recent data from the msMAP correction pipeline (Thompson et al., 2013, where ‘ms’ stands for multi-scale) to check for consistency with PDC_MAP.
From an initial sample of stars, we discarded targets that are known eclipsing binaries (Matijevič et al., 2012), planet host stars as well as planet candidate host stars, and Kepler objects of interest (all lists are available through the MAST portal). We do this to reduce the possibility of false positive detections, since these types of variability may be mistaken for transits of starspots.
2.2 Detecting rotation periods
Provided active regions or starspots are present over several rotations of the star, a peak will appear in the periodogram of the time series. Assuming starspots trace surface rotation, this provides a way to measure the rotation rate of the star at the (average) latitude of the starspots. Simulations by Nielsen & Karoff (2012) show that selecting the peak of maximum power is a suitable method for recovering the stellar rotation period.
We analyzed the Kepler observations as follows:
-
1.
We compute a Lomb-Scargle (LS) periodogram (see Frandsen et al., 1995) for each star in each quarter for periods between and days, using PDC_MAP data.
-
2.
We find the peak of maximum power in this period range and record its period.
-
3.
If the period of the peak falls between and days, we consider it due to stellar variability and not instrumental effects.
-
4.
The peak height must be at least four times greater than the white noise estimated from the root mean square (RMS) of the time series (Kjeldsen & Bedding, 1995).
The lower bound in periods of one day is set to avoid the hot g-mode pulsators with frequencies of a few cycles per day (see Aerts et al., 2010, chap. 2). Some contamination from g-mode pulsations is expected for F- or earlier-type stars; however, we have not investigated how to automatically differentiate these pulsations from stellar activity variability. The upper bound in period of days is the estimated limit for which the PDC_MAP pipeline does not overcorrect the light curve, to the extent that it completely removes the intrinsic stellar signal (Thompson et al., 2013). We calculated periods up to days to ensure that any peak found below days is not a potential side lobe of a dominating long-term trend ( days).
2.3 Selecting stable rotation periods
Further, we require the that the measured periods are stable over several Kepler quarters. Specifically,
-
5.
we determine the median value of the measured periods over all eight quarters;
-
6.
we select stars for which the median absolute deviation (MAD) of the measured periods is less than one day, i.e., day ; The MAD is defined as (where is the median).
-
7.
From these, we select stars with six or more (out of eight) measured periods within MAD of the median period ;
-
8.
we repeat this method using the msMAP data and flag stars that do not satisfy the above criteria.
We use the MAD since it is less sensitive to outliers than the standard deviation (Hoaglin et al., 2000). Requiring that a particular variation for a star is visible in multiple quarters reduces the risk of the detection coming from low-frequency noise from, say, instrumental effects. The LS periodogram is calculated at linearly spaced frequencies between mHz and mHz ( and ). The MAD limit of one day (point 6), along with the signal attenuation introduced by the PDC_MAP correction, leads to a selection bias towards stars with shorter rotation periods. Examples of periods detected for three stars are shown in Fig. 1.
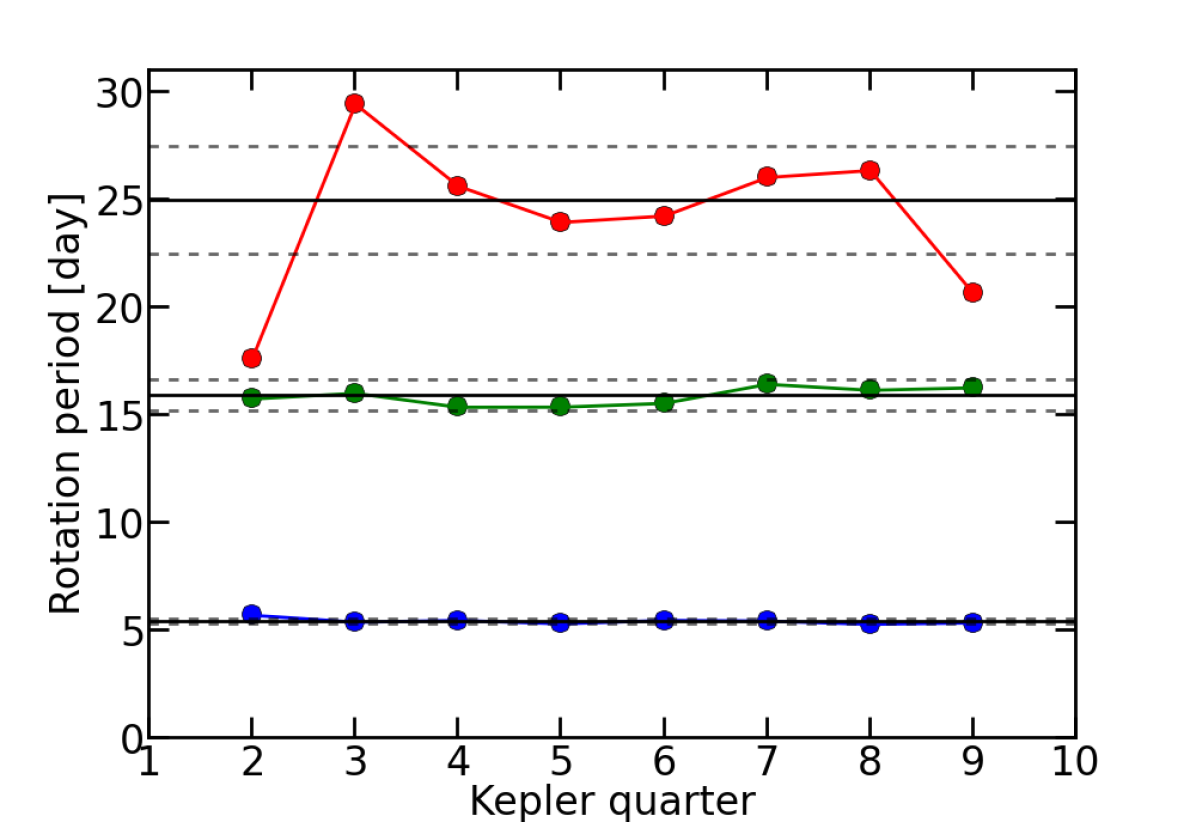
We applied the scaling relation by Kjeldsen & Bedding (2011) to find timescales for p-mode pulsations in cool main sequence stars and red giants. We found that stars with have pulsation periods that can potentially overlap with the range investigated in this work. We opted for a conservative approach and discarded stars with to remove red giants from the sample. Following the scaling relation, the main sequence stars were found to have pulsation timescales from minutes to hours, far below our lower period limit. Once all the above criteria are met, the rotation period, , is defined as the median of the valid periods. This selection process leaves us with 12 151 stars out of the original sample of 192 668. When using the msMAP data, we find that of these stars satisfy the above criteria as well. Of these, differ from the PDC_MAP results by more than one resolution element, predominantly because the msMAP data shows the first harmonic instead of the fundamental period of the variability. The msMAP pipeline treats the long periods ( days) differently than the PDC_MAP (see Thompson et al., 2013).
The results for all 12 151 stars are shown in Table 1, which is provided as online material through the CDS. Column 1 gives the Kepler Input Catalog (KIC) name of the star, cols. 2 and 3 are the rotation period and scatter (MAD), and cols. 4 to 8 give the color, , radius, , and , respectively, all of which are KIC values. Column 9 is a flag indicating whether each msMAP-corrected data set satisfies the criteria of section 2. Column 10 gives the msMAP period of the stars where we find rotation rates from the two data sets that differ by more than one resolution element.
3 Consistency with measurements
We performed a rudimentary spectral classification of the stars based on their color indices. The KIC provides values that we converted to using the relation given by Jester et al. (2005) for stars with R-I color indices . The values are dereddened using the values from the KIC (see Brown et al., 2011, for details on their derivation). The calculated colors are mapped to a spectral type as per Gray (2005, Appendix B).
We compared the periods found in this work with values compiled by Gł\kebocki & Gnaciński (2005). This list contains values and spectral types for cluster stars almost isotropically distributed in galactic coordinates. Using our approximate spectral classification we compared the median equatorial velocities of this sample with our results from the Kepler targets. From the sample we select stars with apparent V magnitude from to , roughly equivalent to the magnitude range of the Kepler targets. We discard any stars from the sample that have been ambiguously labeled as ‘uncertain’. Lastly, we select only dwarf stars since this is the main constituent of the stars selected by our method, reducing the sample to be comparable in number to our Kepler target list.
For each spectral type (s.t.) in our sample of Kepler targets we calculate the median equatorial rotational velocity by where denotes the median over stars with spectral type s.t., is the KIC stellar radius, and is the rotation period determined by our algorithm. The KIC radii are notoriously bad estimates in some cases; however, by comparing these with characteristic radii given in Gray (2005, Appendix B) we find that the median values in the region of F0 to K0 agree within . Outside this range of spectral types the radii are initially overestimated, but become strongly underestimated for A-type stars and earlier.
Since we have such a large statistical sample of measurements within each spectral type, a random distribution of inclinations of rotation axes gives (e.g., Gray, 2005). Therefore the median equatorial velocity for a given spectral type can be approximated by , which is directly comparable to the computed for the Kepler targets.
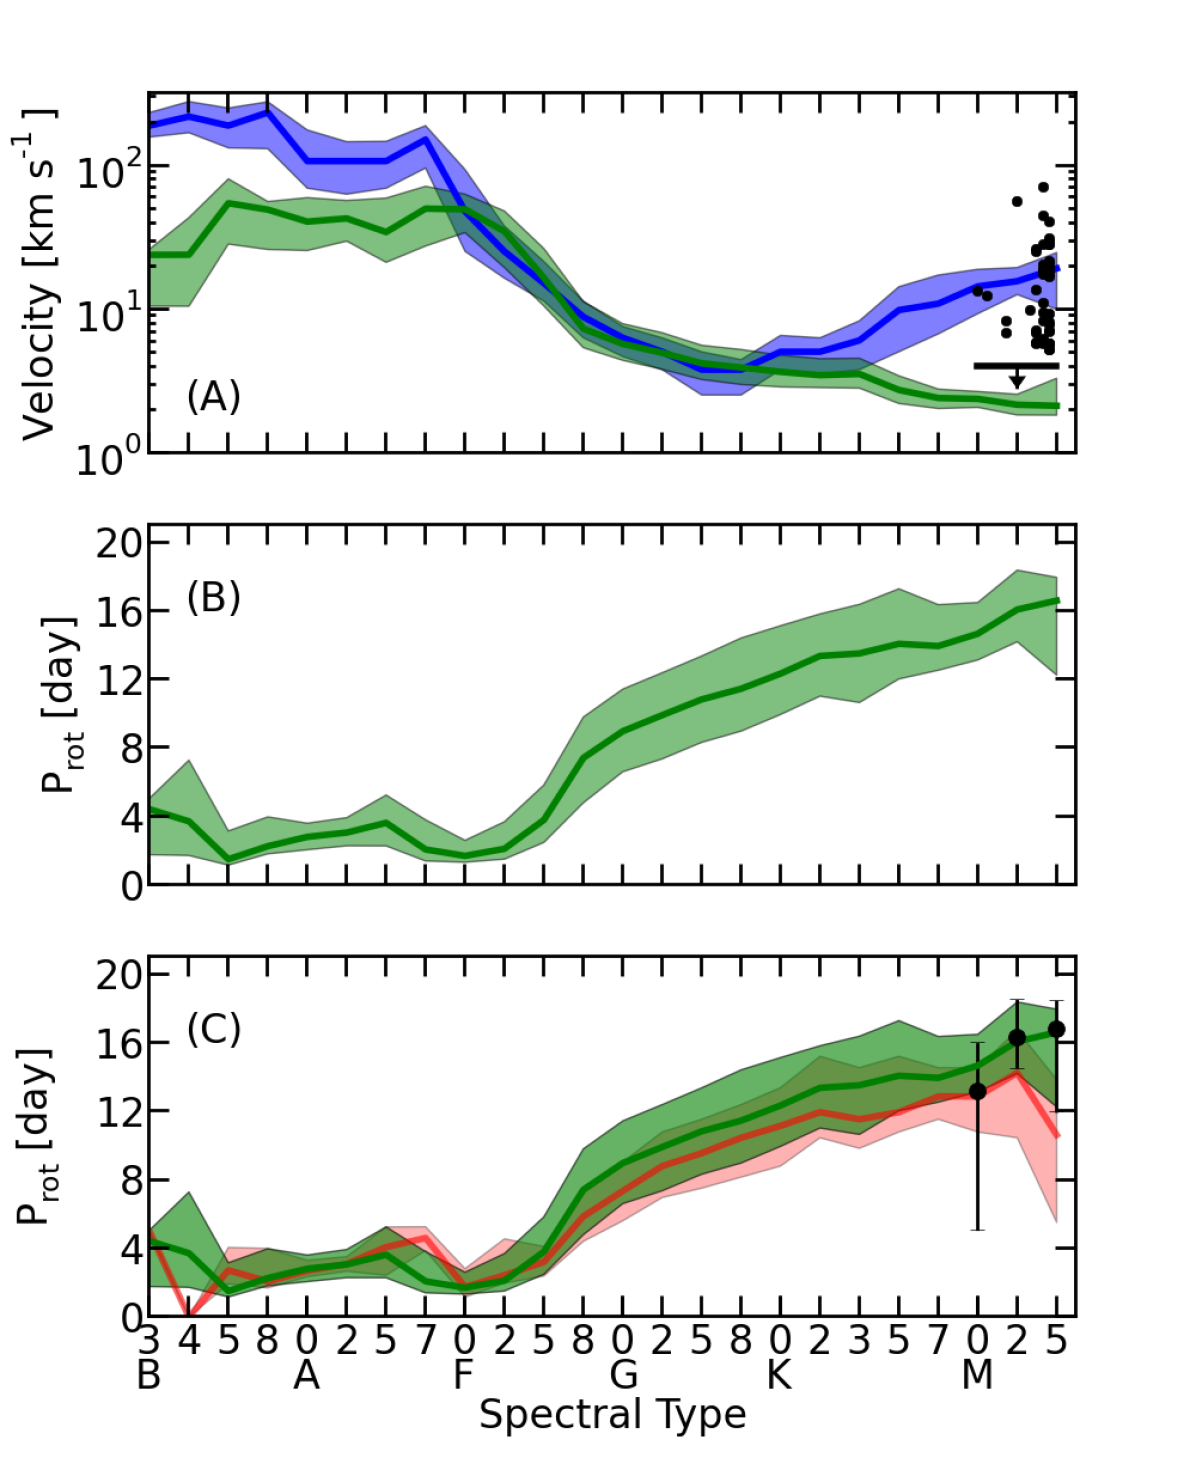
Panel A in Fig. 2 shows clear agreement, from late A-type to early G-type stars, between the median equatorial velocities of the sample and those we derived from our measured Kepler rotation periods. For additional comparison we included the measurements from Reiners et al. (2012), where the horizontal bar represents 201 stars with velocities below . Panel B shows our measured rotation periods , as a function of spectral type, which we used to calculate the equatorial velocities. We also calculated the median periods of the Kepler stars found in Debosscher et al. (2011) and McQuillan et al. (2013) that are present in our sample. These are shown in comparison to our results in panel C. We find that and of their measured rotation rates fall within one frequency resolution element () of our values for the corresponding stars.
4 Rotation of late type stars
Owing to their small radius and long rotation period, the measurements of late type stars are limited by spectral resolution. The measurements of Reiners et al. (2012) have a lower limit at . The KIC radii are overestimated for stars later than K0 so our velocities are therefore upper limits, but we still systematically find rotation slower than . This places our measurements at or below the lower limit for spectroscopically determining rotation for these types of stars.
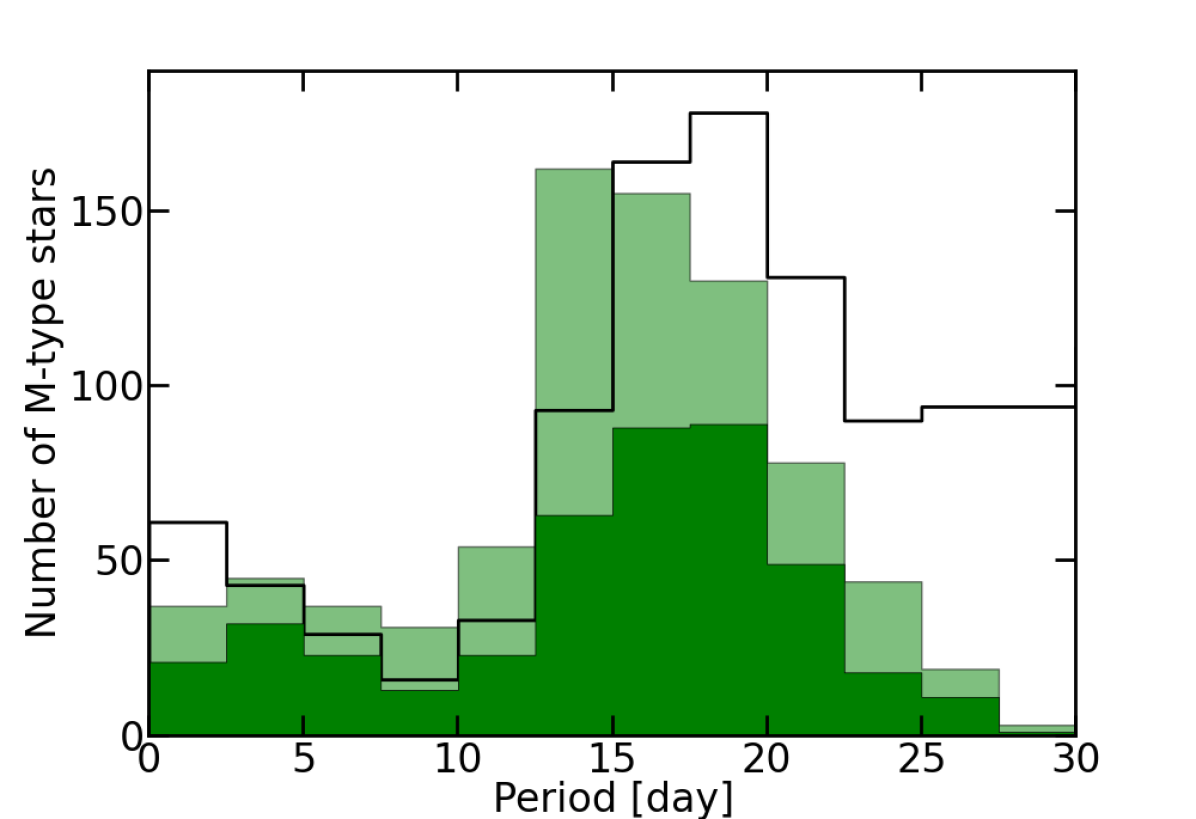
The late M-type stars are of particular interest since they represent the transition from solar-like convective envelopes to fully convective interiors. Figure 3 shows the distributions of stars that have been classified as M-type, found in this work and those by McQuillan et al. (2013). The median of the distribution in our sample is days. There appears to be good agreement with the result of McQuillan et al. (2013). We note an excess of fast rotators with days. The study by Reiners et al. (2012) shows that the number of magnetically active M-type dwarfs increases approximately after spectral subtype M3, which appears correlated with an increase in the number of fast rotators (see top panel of Fig. 2), likely marking the transition to full convection. Our sample contains 795 M-type stars, where have periods less than 7.5 days; i.e., these are potentially fast-rotating, fully convective M-type dwarfs, such as those found by Reiners et al. (2012). As a result of the KIC having errors of approximately dex (Brown et al., 2011), the sample probably still contains some cool giants. A visual inspection of the power spectra of the M-type stars, with periods days, indicated that 3 out of 119 stars had p-mode pulsations that could potentially be misidentified as periodic activity. Thus the contamination by p-mode pulsations appears to be negligible. A more rigorous determination of and spectral type for these stars is required to distinguish stellar evolutionary stages. However, even a fraction of our sample of M-type dwarfs still significantly complements the existing literature on this critical region for understanding differences in stellar dynamos.
5 Conclusions
We developed a straightforward, automated method for detecting stable rotation periods for a large sample of Kepler targets. A total of 12 151 stars ranging from spectral type B3 to M5 all show recurring periods in at least six of the eight quarters of analyzed Kepler data. This, along with the requirement that the stars in question have a maximum MAD of one day, are empirically determined criteria. Using the KIC stellar radii, we found very good agreement between the equatorial rotational velocities derived from the Kepler rotation periods and independent measurements for F0 to K0 type stars. For later type stars we find an inconsistency with the Gł\kebocki & Gnaciński (2005) catalog. This is due to an age difference between the two samples, since the Gł\kebocki & Gnaciński (2005) catalog mainly consists of young open cluster stars. However, our results for M-type stars agree well with those reported by Reiners et al. (2012) and McQuillan et al. (2013). The study by Debosscher et al. (2011) analyzed a different set of Kepler data, but we still find good agreement with the stars overlapping with our sample.
We have primarily studied stars that have long-lived stellar activity signatures. We tested our method on solar-disk integrated light at solar maximum (January 2001 to March 2003), observed by the VIRGO instrument aboard SOHO (Fröhlich et al., 1997). The VIRGO green channel data were divided into 90-day segments, and we applied the method described in Sect. 2. The stability criterion was not met due to a period scatter of days. Analysis of other segments of VIRGO data from 1995 to 2013 also resulted in rejection. This shows that stars with solar-like (low) activity are rejected from our sample; for such stars, rotation period measurements are too noisy and not stable enough over time. A further bias is the upper limit of days chosen because the PDC_MAP does not yield reliable corrections for longer periods. An obvious improvement to our analysis would be to investigate ways of increasing this upper limit, for a complete view of slow rotators.
As expected, we found that hot stars rotate faster than their cooler counterparts (Barnes, 2003; Kraft, 1970). The rotation periods of hot stars should be treated with some caution since they may be false positives from g-mode pulsations. Nevertheless, our analysis method detects periodic variations in brightness that satisfy the selection criteria. The measured variability is not necessarily of magnetic origin, but could arise from, for example, chemical surface inhomogeneities in chemically peculiar hot stars. Chemical spots can produce photometric variability that traces the stellar rotation (Wraight et al., 2012; Paunzen et al., 2013). The short periods measured for the early spectral types (see Fig. 2) in our sample are therefore not contradictory to the expected fast rotation of hot stars (Royer et al., 2004).
This work is only one step toward characterizing of the rotation of stars in the Kepler field. Kepler photometry is proving very useful in adequately sampling the slow rotation rates of cool, faint stars. Future work will include detailed starspot modeling in order to measure latitudinal differential rotation (Reinhold & Reiners, 2013) and asteroseismology (e.g., Deheuvels et al., 2012) to infer internal differential rotation. The Kepler observations offer unique possibilities for calibrating the mass-age-color relations in gyrochronology (Skumanich, 1972; Barnes, 2007) and exploring the close relation between stellar rotation and activity cycles.
Acknowledgements.
M.N., L.G., and H.S. acknowledge research funding by the Deutsche Forschungsgemeinschaft (DFG) under grant SFB 963/1 “Astrophysical flow instabilities and turbulence” (Project A18, WP “Seismology of magnetic activity”). Funding for the Stellar Astrophysics Centre is provided by The Danish National Research Foundation. The research is supported by the ASTERISK project (ASTERoseismic Investigations with SONG and Kepler) funded by the European Research Council (Grant agreement no.: 267864). This paper includes data collected by the Kepler mission. Funding for the Kepler mission is provided by the NASA Science Mission directorate. Some/all of the data presented in this paper were obtained from the Mikulski Archive for Space Telescopes (MAST). STScI is operated by the Association of Universities for Research in Astronomy, Inc., under NASA contract NAS5-26555. Support for MAST for non-HST data is provided by the NASA Office of Space Science via grant NNX09AF08G and by other grants and contracts. The authors thank Ansgar Reiners for helpful discussions.References
- Aerts et al. (2010) Aerts, C., Christensen-Dalsgaard, J., & Kurtz, D. W. 2010, Asteroseismology, 1st edn. (Springer A&A Library)
- Barnes (2003) Barnes, S. A. 2003, ApJ, 586, 464
- Barnes (2007) Barnes, S. A. 2007, ApJ, 669, 1167
- Berdyugina (2005) Berdyugina, S. V. 2005, Living Review in Solar Physics, 2
- Böhm-Vitense (2007) Böhm-Vitense, E. 2007, ApJ, 657, 486
- Borucki et al. (2010) Borucki, W. J., Koch, D., Basri, G., et al. 2010, Science, 327, 977
- Brown et al. (2011) Brown, T. M., Latham, D. W., Everett, M. E., & Esquerdo, G. A. 2011, AJ, 142, 112
- Debosscher et al. (2011) Debosscher, J., Blomme, J., Aerts, C., & De Ridder, J. 2011, A&A, 529, A89
- Deheuvels et al. (2012) Deheuvels, S., García, R. A., Chaplin, W. J., et al. 2012, ApJ, 756, 19
- Dorren (1987) Dorren, J. D. 1987, ApJ, 320, 756
- Frandsen et al. (1995) Frandsen, S., Jones, A., Kjeldsen, H., et al. 1995, A&A, 301, 123
- Fröhlich et al. (1997) Fröhlich, C., Andersen, B. N., Appourchaux, T., et al. 1997, Solar Phys.1, 170, 1
- Gł\kebocki & Gnaciński (2005) Gł\kebocki, R. & Gnaciński, P. 2005, VizieR Online Data Catalog, 3244, 0
- Gray (2005) Gray, D. F. 2005, The Observation And Analysis Of Stellar Photospheres (Cambridge University Press), 533
- Hoaglin et al. (2000) Hoaglin, D. C., Mosteller, F., & Tukey, J. W. 2000, Understanding Robust and Exploratory Data Analysis, wiley clas edn. (Wiley), 472
- Jester et al. (2005) Jester, S., Schneider, D. P., Richards, G. T., et al. 2005, AJ, 130, 873
- Kjeldsen & Bedding (1995) Kjeldsen, H. & Bedding, T. R. 1995, A&A, 293, 87
- Kjeldsen & Bedding (2011) Kjeldsen, H. & Bedding, T. R. 2011, A&A, 529, L8
- Kraft (1970) Kraft, R. P. 1970, in Spectroscopic Astrophysics. An Assessment of the Contributions of Otto Struve, ed. G. H. Herbig & O. Struve, 385
- Maeder (2009) Maeder, A. 2009, Physics, Formation and Evolution of Rotating Stars (Springer Berlin Heidelberg, 2009)
- Matijevič et al. (2012) Matijevič, G., Prša, A., Orosz, J. a., et al. 2012, AJ, 143, 123
- McQuillan et al. (2013) McQuillan, A., Aigrain, S., & Mazeh, T. 2013, MNRAS, 432, 1203
- Mosser et al. (2009) Mosser, B., Baudin, F., Lanza, A. F., et al. 2009, A&A, 506, 245
- Nielsen & Karoff (2012) Nielsen, M. & Karoff, C. 2012, AN, 333, 1036
- Paunzen et al. (2013) Paunzen, E., Wraight, K. T., Fossati, L., et al. 2013, MNRAS, 429, 119
- Reiners et al. (2012) Reiners, A., Joshi, N., & Goldman, B. 2012, AJ, 143, 83
- Reiners & Mohanty (2012) Reiners, A. & Mohanty, S. 2012, ApJ, 746, 43
- Reinhold & Reiners (2013) Reinhold, T. & Reiners, A. 2013, arXiv preprint arXiv:1306.2176
- Royer et al. (2004) Royer, F., Zorec, J., & Gómez, A. E. 2004, Proceedings of the International Astronomical Union, 224, 109
- Skumanich (1972) Skumanich, A. 1972, ApJ, 171, 565
- Smith et al. (2012) Smith, J. C., Stumpe, M. C., Van Cleve, J., et al. 2012, PASP, 124, 1000
- Solanki (2003) Solanki, S. 2003, A&A Rev., 11, 153
- Strassmeier (2009) Strassmeier, K. G. 2009, A&A Rev., 17, 251
- Thompson et al. (2013) Thompson, S. E., Christiansen, J. L., Jenkins, J. M., et al. 2013, Kepler Data Release 21 Notes (KSCI-19061-001), Tech. rep.
- Wraight et al. (2012) Wraight, K. T., Fossati, L., Netopil, M., et al. 2012, MNRAS, 420, 757