From magnetic to Fermi Liquid behavior in CeCo1-xFexSi alloys
Abstract
Structural, magnetic and thermal measurements performed on CeCo1-xFexSi alloys are reported. Three regions can be recognized: i) Co-rich () with a decreasing long range antiferromagnetic order which vanishes at finite temperature, ii) an intermediate region () showing a broad magnetic anomaly () in specific heat and iii) the non-magnetic region progressively changing from a non-Fermi-liquid type behavior towards a Fermi liquid one as Fe concentration increases. The anomaly emerges as an incipient contribution above already at , which indicates that this contribution is related to short range correlations likely of quasi-two dimensional type. Both, transition and anomaly are practically not affected by applied magnetic field up to Tesla.
I Introduction
Magnetic correlations play a basic role in systems accessing to phase transformations Jongh . Besides canonical thermal fluctuations driving a 3-dimensional (3D) magnetic system into a long range magnetic order (LR-MO) ground state (GS), there are different types of fluctuations allowing to explore alternative minima for its free energy. For example, novel exotic phases may occur due to geometrical frustration as alternative GS Toulouse . Low dimensionality is another factor that enhances fluctuations due to geometrical constraints on the propagation of the order parameter.
Magnetic interactions in intermetallic compounds are mainly driven by the well know RKKY mechanism, which is essentially of 3D character. Although real low dimensionality is unlikely in intermetallic compounds, strongly anisotropic structures favor similar effects like in those systems resembling multi-layer structures Venturini . Among Ce equi-atomic ternaries, CeFeSi and CeScSi type structures provide the possibility to explore that alternative. The tetragonal CeFeSi-type structure builds up from two consecutive square planes (with W-type configuration) stacked up along ’c’ direction with BaAl4 blocks, following the Ce-Ce-Si-Fe2-Si-Ce-Ce sequence.
In this work we report on structural, magnetic and thermal properties of CeCo1-xFexSi alloys investigated all along the concentration range. The respective stoichiometric limits are antiferromagnetic with localized moments (CeCoSi, K Cheval ) and non-magnetic showing intermediate valent (CeFeSi) behavior Welter . Thus, this system allows to run through a critical region where magnetic order vanishes.
II Experimental results
II.1 Structural properties
The relevant interatomic distances in the CeFeSi-type structure are the following: and , being R the rare earth (Ce in this case), T the transition metal (Co/Fe) and X the semi-metal (Si). The crystal chemistry study performed on the isotypic compound LaFeSi Welter2 indicates a reduction of the mentioned distances respect to the corresponding values of respective pure elements: , and , whereas the other distances: and increase. The large contraction observed on is related to the strong electronic hybridization between those atoms. This explains the non-magnetic behavior of Fe (or Co) atoms as a consequence of a large band width.
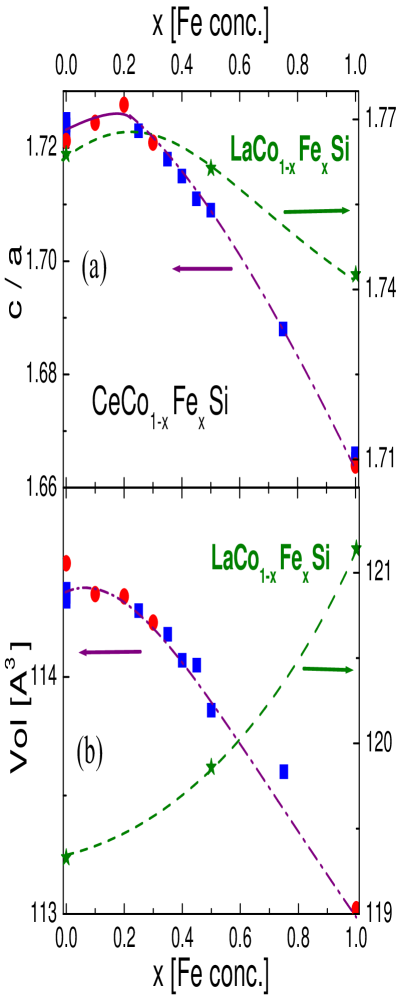
In the system under study, two regions can be clearly distinguished in the concentration dependence of the lattice parameters, see Fig. 1. On the Co-rich side there are minor variations up to about of Fe doping. Beyond that concentration, a clear modification occurs in the variation of both tetragonal axis: a(x) increasing about whilst c(x) decreases about once it reaches the CeFeSi stoichiometric limit. Fig. 1(a) shows a significant reduction of the c/a ratio (about ), coincident with a decrease of the unit cell volume (about ), shown in Fig. 1(b). This structural variation tends to reduce Ce-Ce spacing between neighbors placed on the apex and on the square-base pyramides formed by the each Ce double layer.
The volume variation above (see Fig. 1b) largely exceeds the equivalent variation for neighboring lanthanides (i.e. La and Pr) as a sign of the Ce-4f orbitals instability with Fe content increase. As a reference, the respective values of three La(Co,Fe)Si samples are included in Fig. 1(a) and (b) on the right axis. The increase of volume between LaTSi (T = Co and Fe) compounds contrasts with the strong decrease in CeCo1-xFexSi alloys, indicating the collapse of Ce atomic volume for . In fact, the CeCoSi unit cell volume is below the interpolation between LaCoSi and PrCoSi, whereas CeFeSi is below the equivalent La to Pr interpolation.
II.2 Magnetic properties
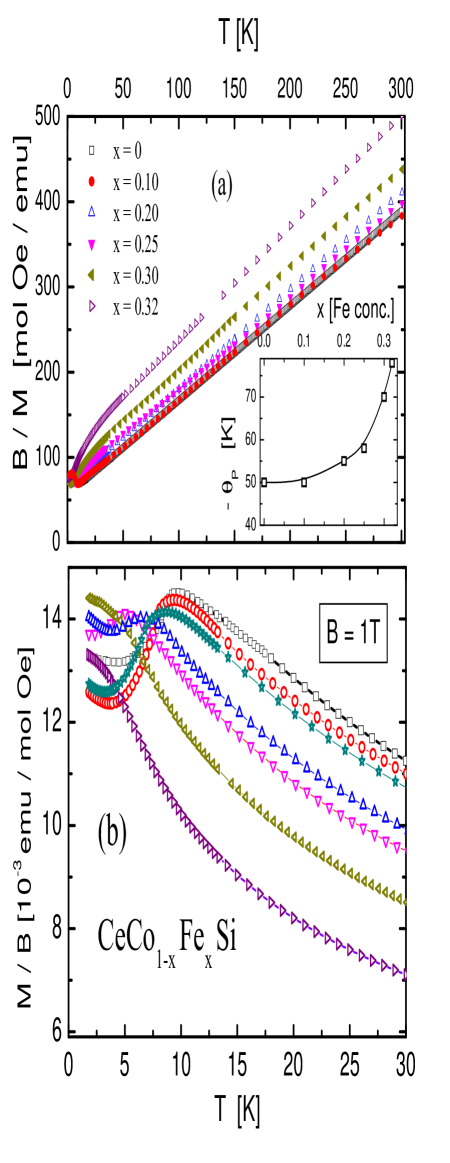
The inverse of the high temperature magnetic susceptibility is shown in Fig. 2(a), from which a Curie constant close to the Hund’s rule GS value is extracted from K for the alloys. Beyond that Fe concentration, the Curie constant starts to decrease in coincidence with the increase of the paramagnetic temperature as presented in the inset of Fig. 2(a). Higher Fe concentration samples show low temperature ferromagnetic contributions that become important as the main magnetization decreases. Whether this is an intrinsic effect or due to a foreign contribution is under investigation.
The relatively high value of at low Fe content is likely due to a combination of Kondo effect acting on respective CEF levels and RKKY exchange. The up turn of beyond is due to a strong increase of Kondo screening related to the significant volume reduction. The corresponding Kondo temperature () is evaluated following Krishna-Murthy criterion: Krishna .
Details of the low temperature magnetic behavior are presented Fig. 2(b), showing the decrease of the maximum of at the anti-ferromagnetic ordering from K at down to K at . The later is hardly seen in Fig. 2b because it contains curves performed with an applied magnetic field of T, albeit the maximum is clearly observed in lower applied field e.g. T (not shown).
II.3 Specific heat
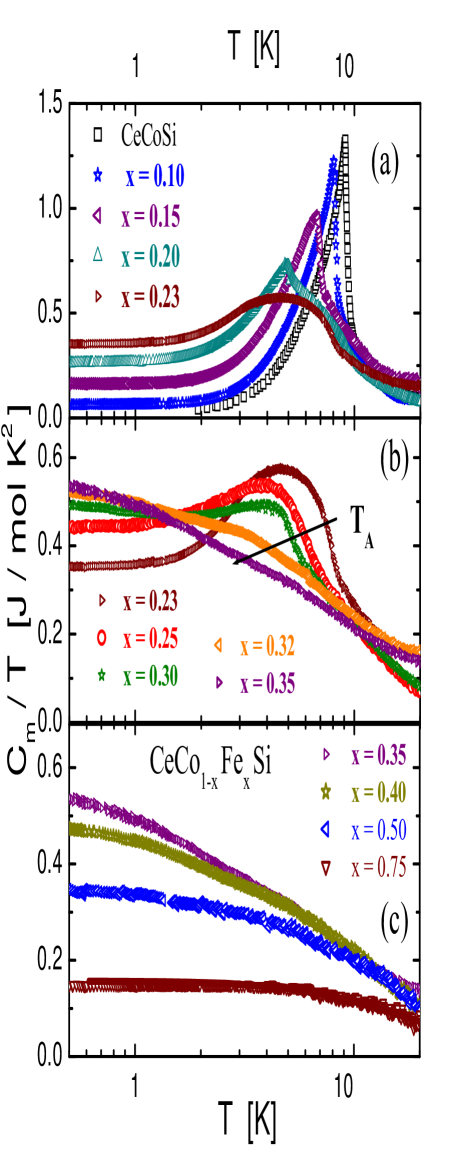
The magnetic contribution to the specific heat () is obtained after subtracting the phonon contribution extracted from the isotypic La compound. The results of all studied samples are collected in Fig. 3. Three distinct behaviors are observed in different concentration ranges: (a) on the Co-rich side with a rapidly decrease of the jump within the concentration range, (b) a broad anomaly () that becomes dominant between and 0.32, and (c) a non-magnetic region for . Although these three regions are clearly distinguishable, the onset of the anomaly is already detected at lower Fe concentration right above the transition. Notably, this incipient anomaly starts to develop at K. This fact indicates that the anomaly builds up from the same degrees of freedom but governed by short range magnetic interactions.
As the jump weakens and the anomaly becomes dominant, also an underlying Kondo type contribution arises. This contribution is related to the formation of heavy fermion (HF) quasi-particles. The low temperature value of this HF contribution increases continuously with as indicated by the values. At , a non-Fermi-liquid (NFL) type dependence: is clearly seen, although it tends to flatten at low temperature. For a progressive transformation into a Fermi-liquid regime occurs as the Ce-lattice enters into a valence instability regime concomitant with the Ce-volume reduction.
The temperature of the specific heat jump at does not coincide with the maximum of but with the maximum of its derivative. This is a typical sign of low dimensionality or strong anisotropy character of magnetic interactions Jongh .
III Discussion
III.1 Phase diagram
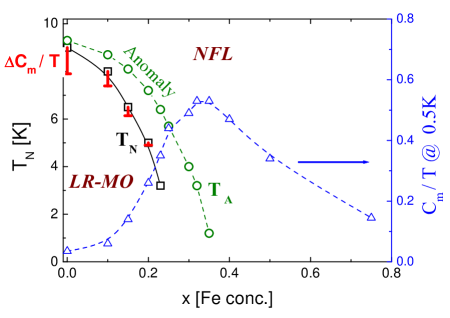
The concentration dependence of the relevant parameters is resumed in a schematic phase diagram in Fig. 4. It includes the decrease together with the respective specific heat jumps reduction that vanishes at . The decreasing height of at is qualitatively represented in the figure as a segment attached to each point. The anomaly is represented by the characteristic temperature defined in Fig. 3(b) as the temperature of the maximum negative slope above . The HF component is represented by the values at K, which increases in the region where degrees of freedom are progressively transferred from the ordered phase into the heavy quasiparticles. Beyond that concentration, decreases with , since the Kondo temperature increases as expected for a non-ordered Kondo lattice.
III.2 On the nature of the specific heat anomaly
The origin and nature of the anomaly deserves a more detailed analysis. As mentioned before, it emerges like a tail as soon as starts to decrease and is fully developed once the LR-MO phase is suppressed before the Kondo effects starts to dominate the low temperature behavior. We notice that the temperature dependence , observed below between and , remains unchanged even once the vanishes at . These features indicate that the anomaly builds up from the magnetic degrees of freedom which at lower Fe concentration are involved in the LR-MO phase formation. This anomaly very likely corresponds to short range magnetic correlations of quasi two-dimensional (2D) type within the double Ce layer. The increasing Kondo interaction and the atomic disorder in the Co/Fe-Si layer in between very likely results in a weakening of the magnetic interactions along ’c’ direction and then to a transition from a 3D to a quasi 2D- system.
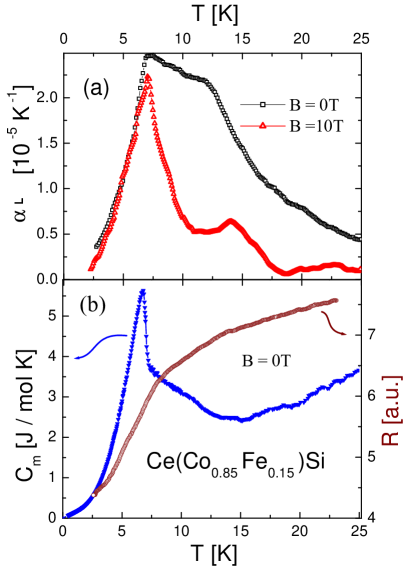
In order to gain insight into the characteristics of this anomaly, we have performed thermal expansion () measurements at zero and under strong magnetic field ( T) on sample . At that Fe concentration both, the incipient anomaly and the transition are competing, see Fig. 5(a). For comparison, zero field specific heat and electrical resistance () are included in Fig. 5(b). The temperature dependence of these three properties coincide in showing the onset of the anomaly contribution at K, being the more sensitive to the appearance of those magnetic correlations. Incipient coherence effects are observed in the dependence starting at K. This temperature coincides with the onset of the upturn approaching the magnetic transition.
Notably, applied magnetic field of T (not shown) produces no relevant effects neither on the anomaly nor on the transition. A T field weakens the anomaly without affecting the transition (see Fig. 5a) like in stoichiometric CeCoSi Cheval2 . Furthermore, a slight shift of the transition to lower temperature (to K) is only observed by applying a field T. Preliminary measurements up to T show a very weak upturn from a linear dependence for T, with coincident values obtained at and 5 K.
IV Summary
Although the magnetic order of this system vanishes as expected, the phase boundary of the long range magnetic order does not extrapolate to . Instead we observe a progressive substitution of the LR-MO by short range interactions. A broad anomaly arises between the temperature and the actual decreasing jump of each alloy. These features suggest that the involved magnetic degrees of freedom are transferred from one component to the other. Notably, the magnetic interactions in this system are very robust against external magnetic field application because both, anomaly and the jump, require T and T to be suppressed or shifted respectively.
Beyond the phase formation, the complex phase diagram shows how the magnetic degrees of freedom from the Co-rich side are transferred to a heavy quasiparticles component exhibiting a NFL type behavior. Once the full NFL regime is reached around , increases rapidly towards the Fe-rich side. The large value of and the entropy gain with temperature indicates that the first excited CEF level is also affected by the Kondo effect and partially contributes to the low temperature properties. Further studies are in progress to better elucidate the exotic characteristics of the anomaly and the significant magnetic hardness of these alloys.
This investigation confirms that Ce-equiatomic ternary compounds with strongly anisotropic structures allows to access to novel behaviors where enhanced fluctuations can play an important role.
References
- (1) see for example: J.L. De Jongh and A.R. Miedema; Adv. in Physics 23 (1974) 1.
- (2) J. Vannimenus, G. Toulouse, in Theory of the frustration effect. J. Phys. C 10 (1977) L537.
- (3) R. Welter, G. Venturini, E. Ressouche, B. Malaman; J. Alloys and Compounds 210 (1994) 279.
- (4) B. Chevalier and S.F. Matar; Phys. Rev. B 70 (2004) 174408.
- (5) R. Welter, G. Venturini, B. Malaman; J. Alloys and Compounds 189 (1992) 49.
- (6) R. Welter, I. Ijaali, G. Venturini, P. Malaman, J. Alloys and Compounds 265 (1998) 196.
- (7) H. R. Krishna-murthy and C. Jayaprakash, Phys. Rev. B30 (1984) 2806.
- (8) S.J. Kennedy, A.P. Murani, B.R. Coles, O. Moze; J. Phys. F: Met. Phys. 18 (1988) 2499.
- (9) B. Chevalier1, S.F. Matar1, M. Ménétrier1, J. Sanchez Marcos, J. Rodriguez Fernandez; J. Phys.: Condens. Matter 18 (2006) 6045.