Major electron events and coronal magnetic configurations of the related solar active regions
Abstract
A statistical survey of 26 major electron events during the period 2002 February through the end of solar cycle 23 is presented. We have obtained electron solar onset times and the peak flux spectra for each event by fitting to a power-law spectrum truncated by an exponential high-energy tail, i.e., . We also derived the coronal magnetic configurations of the related solar active regions (ARs) from the potential-field source-surface (PFSS) model. It is found that: (1) 10 of the 11 well-connected open field-line events are prompt events whose solar onset times coincide with the maxima of flare emission. 13 of the 14 closed field-line events are delayed events. (2) A not-well-connected open field-line event and one of the closed field-line events are prompt events, they are both associated with large-scale coronal disturbances or dimming. (3) An averaged harder spectrum is found in open field-line events compared with the closed ones. Specifically, the averaged spectral index is of 1.6 0.3 in open field-line events and of 2.0 0.4 in closed ones. The spectra of three closed field-line events show infinite rollover energies . These correlations clearly establish a significant link between the coronal magnetic field-line topology and the escape of charged particles from the flaring ARs into interplanetary space during the major solar energetic particle (SEP) events.
1 Introduction
Non-thermal electrons are one population of particle streams produced by the rapid release of magnetic energy during solar eruptions, notably flares and coronal mass ejections (CMEs). In-situ observations (Lin, 1985; Krucker et al., 1999) show that impulsive keV electron events exhibit a rapid onset with the inferred release time coincident with the soft X-ray (SXR), hard X-ray (HXR) emission, and the type III radio burst. The relatively more gradual events with energies up to MeV, namely major electron events, are sometimes released several minutes later and accompanied by enhanced proton fluxes.
It is generally agreed that major electron events are produced by shock-wave acceleration (Reames, 1999). However, these events are always associated with flares and CMEs, representing different manifestations of the same magnetic energy release process (Zhang et al., 2001), both of which are capable of accelerating particles. On the other hand, the coronal magnetic configurations are very complex and could therefore provide tunnels for charged particles escaping from the local coronal sites, i.e., flaring active regions (ARs) into interplanetary space (Perez-Peraza, 1986). Recently, a number of authors have compared open magnetic flux tubes with the solar sources of impulsive SEP events (Wang et al., 2006; Nitta et al., 2006; Rust et al., 2008; Mason et al., 2009).
The particle dynamics (for instance release times and spectra) of major electron events show great complexity and differ from one event to another. Apart from dependence due to acceleration mechanisms (Kontar, 2001) and interplanetary transport effects (Cane, 2003), one viewpoint is that the coronal magnetic configuration might also contribute to the dynamical discrepancies. In this letter, we present a survey of 26 major electron events during the period 2002 February through the end of solar cycle 23. Our purpose is to clarify the correlation between the dynamics of in-situ electrons and the magnetic field-line topologies in the vicinity of the related solar ARs.
2 Observations
Two spacecraft are currently orbiting the Sun-Earth L1 libration point with experiments observing electrons from solar wind energies up to the relativistic energy range. The WIND three-dimensional Plasma and Energetic Particles instrument (3DP; Lin et al. 1995) provides electron measurements with the electrostatic analyzers (EESAs) from 0.5 keV to 28 keV, and the solid-state telescopes (SSTs) from 27 keV to 300 keV. The Electron, Proton, and Alpha Monitor (EPAM; Gold et al. 1998) onboard Advanced Composition Explorer (ACE) measures electrons in the energy range of 38 – 315 keV.
Our survey of these datasets began in 2002 February (start of the RHESSI observations; Lin et al. 2002) and continued through the end of solar cycle 23 (2006 December). The following selection criteria were applied to identify the major electron events reported in this study: (1) Electron intensity has an enhancement detected by ACE/EPAM, which means that the in-situ electron energy is above 40 keV. (2) The concurrent proton flux with energy above 10 MeV is observed by Geostationary Operational Environment Satellite (GOES) spacecraft. The proton event list is maintained by D. C. Wilkinson (http://www.ngdc.noaa.gov/stp/GOES/goes.html). (3) There are obvious distinctions between successive events, to ensure that any events can be attributed to specific flare eruptions and the related solar ARs. Additionally, the related solar ARs are located on the earthward solar surface, to ensure that the magnetic field extrapolations can be applied. These criteria reduced the candidates to 26 events listed in Table 1.
3 Data analysis
The arrival times of near-relativistic electrons are recorded by ACE/EPAM. Assuming electrons travel along the nominal Parker-spiral interplanetary magnetic field (IMF) lines at a speed of with no scattering (Krucker et al., 1999), and with respect to the flare emission time, we estimate the SEP solar onset time by subtracting minutes (Table 1, column 6) from the in-situ onset time (column 5). The length of IMF lines is calculated by solution of the IMF equation deduced from the solar wind model (Parker, 1958), is taken to be 0.5 in the energy channel of 53 – 103 keV. As indicated by Haggerty & Roelof (2003), the in-situ onset in this channel leads to a lower bound on the SEP solar onset time because of the residual straggling effect (higher energy electrons leave a fraction of their energy in the detector and are thus counted in the lower channels). This is reasonable since electrons actually undergo interplanetary scattering more or less. The inferred SEP solar onset times are then compared with the peak times of HXR emission (RHESSI 50 – 100 keV, h in column 4), or if no HXR data available, with SXR emission (GOES 1 – 8 , s in column 4). A prompt event (P in column 7) is defined if the SEP solar onset time is before or at the flare emission peak time. Otherwise, the event is categorized as a delayed one (D in column 7).
The in-situ electron spectra generally show power-law or broken power-law shapes (Lin et al. 1982). However, observations and simulations show that the spectral profiles could somewhat deviate from power-law distribution and display gradual changes at high-energy tail due to a variety of effects (Ellison & Ramaty, 1985; Aanastasiadis et al., 1997; Hamilton et al., 2005; Liu et al., 2009). Major SEP events are always associated with both flares and CMEs. To avoid the argument of which acceleration source dominates the production of charged particles and which acceleration mechanism determines the shape of the particle spectra, we applied a spectral profile with the combination of a power-law and an exponential function, i.e., . Using the electron data from WIND/3DP (EESAs and SSTs), the peak flux spectra for each event are then fitted to the function, and the spectral indices and the rollover energies are listed in Table 1, column 8 and 9, respectively. The averaged value and standard deviation of the spectral indices is , which is similar to the results of Ellison & Ramaty (1985).
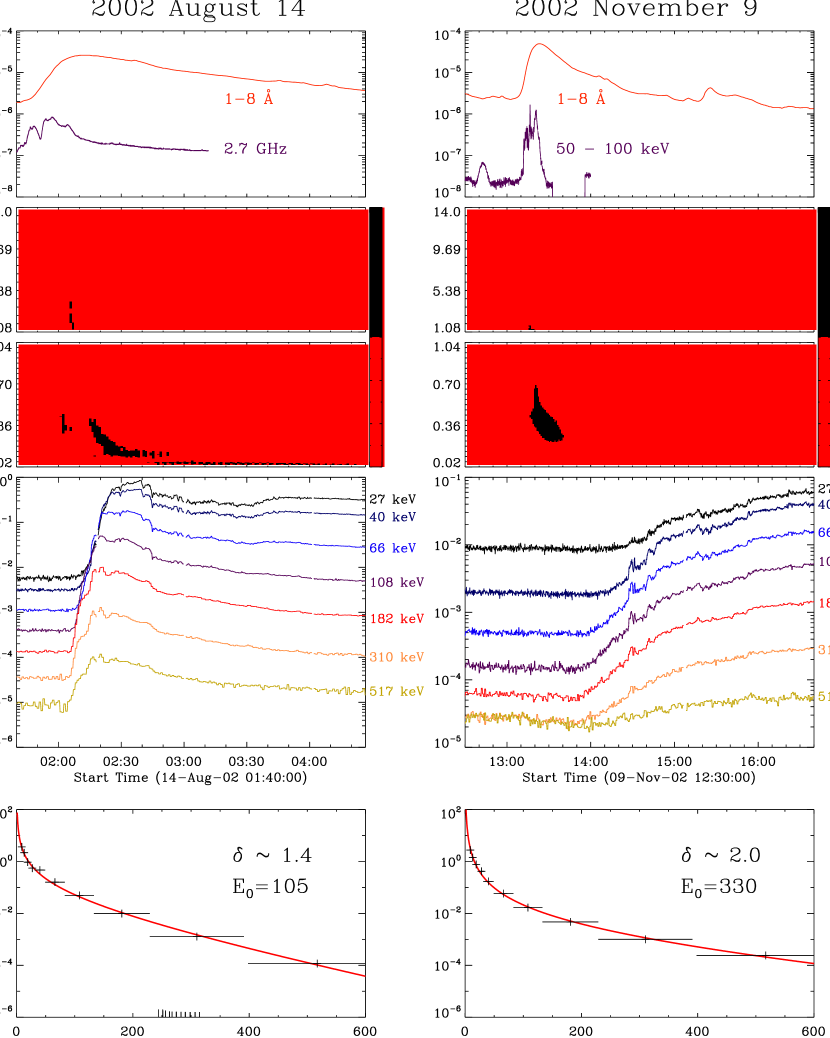
Figure 1 shows the comparison of a prompt event which occurred on 2002 August 14 with a delayed event on 2002 November 9. It is found that the SEP solar onset time is consistent with the SXR, microwave emission, and the type III radio burst in the prompt event. On the contrary, electrons are released several minutes later compared to the multi-wavelength flare emission in the delayed event. The spectral index is of 1.4 in the prompt event much harder than the index of 2.0 in the delayed event, and the rollover energy in the prompt event is of 105 keV lower than the 330 keV in the delayed event.
We then use the PFSS model developed by Schrijver & DeRosa (2003), which is available in the IDL-based solar software (SSW) package, to identify the coronal magnetic configurations. It has been successfully applied in relating the large-scale topologies to the coronal plasma outflows (Sakao et al., 2007) and to the open field-line fluxes (Li et al., 2009). Using the photospheric longitudinal magnetogram from the Michelson Doppler Imager (MDI) onboard the Solar and Heliospheric Observatory (SOHO), the coronal magnetic configuration of each event is extrapolated. The region of the extrapolation is in the vicinity of the solar AR, the time of the selected magnetogram is just previous to the flare eruption, and the height of the calculation is extending to the. assumed solar source surface (at 2.5 where the magnetic energy density equals to the plasma energy density) Figure 2 shows the comparison of an open magnetic field-line topology and a closed one, corresponding to the events plotted in Fig. 1. Of these 26 major electron events, 12 are open field-line events (O in column 10) and the remained 14 events are closed ones (C in column 10).
To further examine whether the open field-line fluxes are connected to the IMF lines, which are rooted on the solar source surface and linked to the near-Earth spacecraft, we calculate the connection longitude as . Where is the distance from the Sun center to the L1 libration point, is the radius of the solar source surface, is the angular speed of solar rotation, and is the solar wind speed. Taking into account the uncertainty of about (Ippolito et al., 2005), the connection longitudes are derived for each event. As shown in Fig. 2, the open field-line fluxes of the 2002 August 14 event intersect the connection longitudes, suggesting a so-called well-connected event. Of the 12 open field-line events, only the 2004 July 25 event is not well-connected. The latitudinal connection is not considered in this study, since as indicated by Klein et al. (2007) that the detection of Langmuir waves with the kilometric type III bursts suggesting the IMF lines bend down to the ecliptic from higher latitude solar source surface.
4 Results and discussion
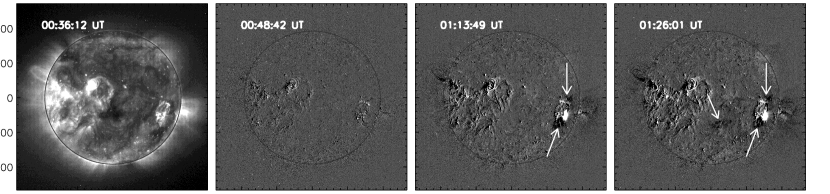
Based on the above analysis, significant correlations could be established. Of the 11 well-connected open field-line events, 10 (91) are prompt events. The exceptional delayed event occurred on 2003 November 2. Since the PFSS model does not correctly rebuild the local and delicate magnetic structures such as twist and helicity, a possibility is that the magnetic configurations in the lower coronal site are not favorable for releasing charged particles. Of the 14 closed field-line events, 13 (93) are delayed events. The exceptional prompt event occurred on 2005 August 22. From the based-difference 195 Å images (see Fig. 3) of the Extreme-Ultraviolet Imaging Telescope (EIT) on board SOHO, it is found that large-scale coronal disturbances or dimming take place around the SEP solar onset time (01:18 UT) as shown by the arrows. This process might open or significantly reconfigure the magnetic field in the corona, facilitating the escape of charged particles (Li et al., 2006). We note that the not-well-connected open field-line event on 2004 July 25 has similar coronal signatures, explaining the prompt injection of non-thermal electrons.
Furthermore, the averaged values and standard deviations of spectral indices of the open field-line events and the closed ones are 1.6 0.3 and 2.0 0.4, respectively. Additionally, the spectra of three closed field-line events show infinite rollover energy (see Table 1, column 9). The differences may result from the so-called “mixed” or “hybrid” acceleration processes (Kallenrode, 2003). Charged particles in the open field-line event can escape more easily from the flare acceleration region into higher coronal regions and be re-accelerated by the CME-driven shock, producing a more intense event and a harder spectrum (Lin et al., 1982). A great number of charged particles in the closed field-line event are supposed to be trapped in the flaring ARs, providing fewer particles to the further shock acceleration, thus the spectral shape could be steeper and follow a power-law distribution extending to high energies. A larger sample size of major or impulsive electron events should be further studied to reduce the uncertainties on the spectral discrepancies.
In this Letter, significant correlations are established between the coronal field-line topologies and the dynamics of in-situ electrons. To conclude, in addition to being accelerated by CME-driven shocks during the major SEP events, both the flare acceleration and the coronal magnetic configuration could play important role in producing and guiding charged particles from the low coronal site into interplanetary space.
References
- Aanastasiadis et al. (1997) Anastasiadis, A., Vlahos, L., & Georgoulis, M. K. 1997, ApJ, 489, 367
- Cane (2003) Cane, H. V. 2003, ApJ, 598, 1403
- Ellison & Ramaty (1985) Ellison, D. C., & Ramaty, R. 1985, ApJ, 298, 400
- Gold et al. (1998) Gold, R. E., et al. 1998, Space Sci. Rev., 86, 541
- Haggerty & Roelof (2003) Haggerty, D. K., & Roelof, E. 2003, Adv. Space Res., 32, 423
- Hamilton et al. (2005) Hamilton, B., Fletcher, L., McClements, K. G., & Thyagaraja, A. 2005, ApJ, 625, 496
- Ippolito et al. (2005) Ippolito, A., Pommois, P., Zimbardo, G., & Veltri, P. 2005, A&A, 438, 705
- Kallenrode (2003) Kallenrode, M. -B. 2003, J. Phys. G: Nucl. Part. Phys., 29, 965
- Klein et al. (2007) Klein, K. -L., Krucker, S., Lointier, G., & Kerdraon, A. 2007, A&A, 486, 589
- Kontar (2001) Kontar, E. P. 2001, Sol. Phys., 202, 131
- Krucker et al. (1999) Krucker, S., Larson, D. E., Lin, R. P., & Thompson, B. J. 1999, ApJ, 519, 864
- Li et al. (2006) Li, C., Tang, Y. H., Dai, Y., Zong, W. G., & Fang, C. 2006, A&A, 461,1115
- Li et al. (2009) Li, C., Dai, Y., Vial, J. -C., Owen, C. J., Matthews, S. A., Tang, Y. H., Fang, C., & Fazakerley, A. N. 2009, A&A, 503, 1013
- Lin et al. (1982) Lin, R. P., Mewaldt, R. A., & Van Hollebeke, M. A. I. 1982, ApJ, 253, 949
- Lin (1985) Lin, R. P. 1985, Sol. Phys., 100, 537
- Lin et al. (1995) Lin, R. P. 1995, Space Sci. Rev., 71, 125
- Lin et al. (2002) Lin, R. P., et al. 2002, Sol. Phys., 210, 3
- Liu et al. (2009) Liu, W. J., Chen, P. F., Ding, M. D., & Fang, C. 2009, ApJ, 690, 1633
- Mason et al. (2009) Mason, G. M., Nitta, N. V., Cohen, C. M. S., & Wiedenbeck, M. E. 2009, ApJ, 700, L56
- Nitta et al. (2006) Nitta, N. V., Reames, D. V., DeRosa, M. L., Liu, Y., Yashiro, S., & Gopalswamy, N. 2006, ApJ, 650, 438
- Parker (1958) Parker, E. N. 1958, ApJ, 128, 664
- Perez-Peraza (1986) Perez-Peraza, J. 1986, Space Sci. Rev., 44, 91
- Reames (1999) Reames, D. V. 1999, Space Sci. Rev., 90, 413
- Rust et al. (2008) Rust et al. 2008, ApJ, 687, 635
- Sakao et al. (2007) Sakao, T., et al. 2007, Science, 318, 1585
- Schrijver & DeRosa (2003) Schrijver, C. J., & DeRosa, M. L. 2003, Sol. Phys., 212, 165
- Wang et al. (2006) Wang, Y. -M., Pick, M., & Mason, G. M. 2006, ApJ, 639, 495
- Zhang et al. (2001) Zhang, J., Dere, K. P., Howard, R. A., Kundu, M. R., & White, S. M. 2001, ApJ, 559, 452
| Emission | In-situ | ||||||||
|---|---|---|---|---|---|---|---|---|---|
| Flare | Flare | Peak | Onset | SEP | PFSS | ||||
| Date | Location | Class | (UT) | (UT) | (min) | Type | (keV) | Model | |
| 2002 Feb 20 | N12W72 | M5.1 | 06:12 s | 06:06 | 10.4 | P | 1.5 | 140 | O |
| 2002 Mar 16 | S08W03 | M2.2 | Mar 15 23:10 s | 00:57 | 11.0 | D | 1.8 | 345 | C |
| 2002 Mar 18 | S09W46 | C5.9 | 11:45 s | 12:33 | 10.7 | D | 2.1 | C | |
| 2002 Apr 17 | S14W34 | M2.9 | 08:57 s | 08:43 | 10.9 | P | 1.8 | 100 | O |
| 2002 Apr 21 | S14W84 | X1.5 | 01:46 h | 01:38 | 10.1 | P | 1.1 | 346 | O |
| 2002 May 22 | S19W56 | M1.0 | 00:20 s | 00:26 | 10.6 | P | 2.2 | 114 | O |
| 2002 Aug 14 | N09W54 | M2.3 | 02:12 s | 01:59 | 10.2 | P | 1.4 | 105 | O |
| 2002 Aug 22 | S07W62 | M5.4 | 01:52 h | 02:18 | 10.4 | D | 2.1 | 249 | C |
| 2002 Nov 9 | S12W29 | M4.6 | 13:23 h | 14:02 | 10.8 | D | 2.0 | 212 | C |
| 2003 May 28 | S07W17 | X3.6 | 00:52 h | 00:56 | 9.6 | P | 1.5 | 860 | O |
| 2003 May 31 | S07W65 | M9.3 | 02:29 h | 02:40 | 9.4 | D | 1.6 | 112 | C |
| 2003 Oct 26 | N02W38 | X1.2 | 18:19 s | 17:52 | 10.2 | P | 1.7 | 537 | O |
| 2003 Oct 28 | S16E08 | X17.2 | 11:06 h | 11:20 | 9.5 | D | 2.7 | 100 | C |
| 2003 Nov | S14W56 | X8.3 | 17:17 h | 17:40 | 9.9 | D | 1.5 | 309 | O |
| 2004 Apr 11 | S14W47 | C9.6 | 04:19 s | 04:27 | 10.3 | P | 2.1 | 199 | O |
| 2004 Jul 25 | N08W33 | M1.1 | 15:14 s | 15:21 | 9.8 | P | 1.7 | 980 | |
| 2004 Sep 19 | N03W58 | M1.9 | 17:12 s | 17:31 | 10.7 | D | 2.0 | C | |
| 2004 Nov 7 | N09W17 | X2.0 | 16:20 h | 17:26 | 10.1 | D | 2.1 | C | |
| 2005 Jan 15 | N15W05 | M9.1 | 06:35 s | 07:10 | 9.8 | D | 2.5 | 528 | C |
| 2005 Jan 20 | N14W61 | M7.1 | 06:44 h | 06:54 | 9.3 | D | 1.5 | 474 | C |
| 2005 May 13 | N12E11 | M8.0 | 16:50 h | 17:29 | 9.7 | D | 2.2 | 259 | C |
| 2005 Jun 16 | N09W87 | M4.0 | 20:10 h | 20:35 | 9.5 | D | 1.7 | 324 | C |
| 2005 Jul 13 | N10W80 | M5.0 | 14:49 s | 14:37 | 9.7 | P | 1.0 | 76 | O |
| 2005 Aug | S10W52 | M2.8 | 01:17 h | 01:19 | 9.9 | P | 1.6 | 186 | C |
| 2006 Dec 5 | S07E79 | X9.0 | 10:30 h | 14:07 | 11.3 | D | C | ||
| 2006 Dec 13 | S05W23 | X3.4 | 02:40 s | 02:48 | 9.5 | P | O |
Note. — In Column 4, s indicates that the emission peak time is from SXR observation, and h from HXR. In Column 7, P indicates a prompt SEP event, and D is delayed. In Column 10, O indicates a open field-line event, and C is closed. Dotted line indicates no data available.