Time delay between the optical and X-ray outbursts in the high mass X-ray transient A0535+26/HDE245770
Abstract
The optical behaviour of the Be star in the high mass X-ray transient A0535+26/HDE245770 shows that at the periastron typically there is an enhancement in the luminosity of order 0.02 to few tenths mag, and the X-ray outburst happens about 8 days after the periastron. We construct a quantitative model of this event, basing on the a nonstationary accretion disk behavior, connected with a high ellipticity of the orbital motion. The ephemeris used in this paper – JDopt-outb = JD0(2,444,944) n(111.0 0.4) days are derived from the orbital period of the system P days, determined by Priedhorsky & Terrell (1983), and from the optical flare of December 5, 1981 (Giovannelli et al., 1985) (here after 811205-E; E stands for the Event occurred at that date) that triggered the subsequent X-ray outburst of December 13, 1981 (Nagase et al., 1982) (here after 811213-E). We explain the observed time delay between the peaks of the optical and X-ray outbursts in this system by the time of radial motion of the matter in the accretion disk, after an increase of the mass flux in the vicinity of a periastral point in the binary. This time is determined by the turbulent viscosity, with the parameter . The increase of the mass flux is a sort of flush that reaches the external part of the accretion disk around the neutron star, producing an enhancement in the optical luminosity. The consequent X-ray flare happens when the matter reaches the hot central parts of the accretion disk, and the neutron star surface.
1 Introduction
The X-ray source A 0535+26 was discovered by Ariel V satellite on 14 April, 1975 (Coe et al., 1975). The X-ray source was in outburst with the intensity of Crab), and showed a pulsation at s (Rosenberg et al., 1975). The hard X-ray spectrum during the decay from the April 1975 outburst became softer, being the 19 May spectrum with , and the 1 June with (Ricketts et al., 1975).
Between 13 and 19 April, 1975, as the nova brightens, the spectra show some evidence of steepening. The best fit of the experimental data between roughly 27 and 28 April was compatible with 8 keV black-body curve (Coe et al., 1975). The X-ray source decayed from the outburst with an e-folding time of 19 days in the energy range 3-6 keV (Kaluzienski et al., 1975). The Be star HDE 245770 was discovered as the optical counterpart of A 0535+26 by Bartolini et al. (1978), and was classified as O9.7IIIe star by Giangrande et al. (1980). This is a robust classification, still resistant to many attacks.
Complete reviews of this system can be found in the papers by Giovannelli et al. (1985), Giovannelli & Sabau-Graziati (1992) – here after GSG92 –, and Burger et al. (1996).
Briefly, the properties of this systems, placed at distance of kpc (Giangrande et al., 1980), can be summarized as follows: hard X-ray transient, long period X-ray pulsar – the secondary star – orbiting around the primary O9.7IIIe star. The masses are of M⊙ (Joss & Rappaport 1984; Thorsett et al. 1993; van Kerkwijk, van Paradijs, J. & Zuiderwijk, 1995), and 15 M⊙ (Giangrande et al., 1980) for the secondary and primary stars, respectively. The eccentricity is e = 0.497 (Finger et al., 1994). Usually the primary star does not fill its Roche lobe (de Loore et al., 1984).
The trigger for writing this paper has been the results reported in the paper by Giovannelli & Sabau-Graziati (2011) where they emphasize the discovery of low-energy indicators of high-energy processes. These indicators are UBVRI magnitudes and Balmer lines of the optical companion. Particular unusual activity of the primary star – usually at the periastron passage of the neutron star – indicates that an X-ray flare is drawing near. The shape and intensity of X-ray outbursts are dependent on the strength of the activity of the primary.
By using two measurements in optical during two identical decays from relative maxima of the luminosity of HDE 245770, Bartolini et al. (1983) determined the orbital period of the system HDE 245770/A 0535+26 as P days. They assumed the time of the maximum flare luminosity observed by Rössiger (1978) as reference maximum, according with JD(L + n 110.856. Thus, Bartolini et al. (1983) obtained for the maximum of the optical flare of December 5, 1981 (JD 2,444,944.5) (Giovannelli et al., 1985) (here after 811205-E; E stands for the Event) the computed time JD 2,444,937.5 not in contrast with the observed time. For this reason Bartolini et al. (1983) gave JD as time of the occurrence of the 811205-E.
But, since the 811205-E is clearly peaked at that date and triggered the subsequent short X-ray outburst of December 13, 1981 (811213-E) (Nagase et al., 1982), Giovannelli & Sabau-Graziati (2011) assumed the ephemeris of the system as JDopt-outb = JD0(2,444,944) n(110.856 0.002) days.
Thus they concluded that the passage of the neutron star at the periastron occurs with a periodicity of 110.856 0.002 days and the various kinds of X-ray outbursts of A0535+26 – following the definitions reported in the review by GSG92 – occur just after 8 days. The intensity of X-ray outbursts range from Crab depending on the state of the primary companion O9.7 IIIe star: i) ‘normal outbursts’ () Crab when the O9.7 IIIe star is ‘quiescent’ (steady stellar wind); ii) anomalous or noisy outbursts’ ( Crab) when the O9.7IIIe star is in a ‘turbulent’ state; some puffs of material, superimposed to the steady stellar wind, are expelled; iii) ‘casual or giant outbursts’ ( Crab) when the O9.7IIIe star is ‘very active’ (i.e. expelling a shell). At the periastron the optical luminosity increases from to mag from case i) to iii).
The time delay between optical and X-ray outbursts, starting from 811205-E is becoming longer for the most recent outbursts. This suggests that the orbital period determined by Bartolini et al. (1983) and used by Giovannelli & Sabau-Graziati (2011) is slightly too short.
Thus, in this paper we assume the orbital period determined by Priedhorsky & Terrell (1983) by using X-ray data: P days, and the ephemeris JDopt-outb = JD0(2,444,944) n(111.0 0.4) days. The 111-day orbital period is completely in agreement with the many determinations reported in the literature (from optical data, e.g. Guarnieri et al., 1985; de Martino et al., 1985; Hutchings, 1984; Janot-Pacheco, Motch & Mouchet, 1987. From X-ray data, e.g. Nagase et al., 1982; Priedhorsky & Terrell, 1983; Motch et al., 1991; Finger et al., 1996; Coe et al., 2006).
However, for the purposes of this paper the orbital period of the system is not so crucial.
Moreover, the suggestion of the possible presence of a temporary accretion disk around the X-ray pulsar when approaches the periastron (Giovannelli & Ziókowski, 1990), that was confirmed by X-ray measurements of Finger et al. (1996), and deeply discussed by Giovannelli et al. (2007) when the presence of a temporary accretion disk was detected by means of doubling in the He I emission lines, gave us a hint for trying to quantitatively describe the origin of the 8 days time delay between the optical and X-ray outburst in A 0535+26/HDE 245770 (Flavia’ star) system.
In the following section the reader will find a panorama of experimental results enough complete coming from optical and X-ray measurements of the X-ray/Be system A 0535+26/HDE 245770. Only sometimes X-ray and optical measurements were taken in the same epoch, sometimes only optical data were obtained and other times only X-ray data were available. Thus, the reader would pay attention in looking at the various experimental situations, but all having the common denominator: the epoch of the periastron passage of the neutron star around the Be star is always before X-ray outbursts of days. If optical data are available, at the periastron passage the optical luminosity shows a relative maximum or the beginning of a decay from it. If X-ray data are available, the X-ray outburst follows the periastron passage of days. If both optical and X-ray data are available, optical and X-ray outbursts are separated by days.
2 Some relevant experimental results
In the following we will present several experimental facts that clearly demonstrate the delay between the relative enhancement of the optical luminosity of HDE 245770, occurring at the periastron passage, and the consequent X-ray outburst of the X-ray pulsar A0535+26. We can divide the experimental facts in three sets: (i) optical and X-ray data are available around the periastron passage; (ii) optical data are available without X-ray data around the periastron passage; (iii) X-ray data are available, but no optical data are available around the periastron passage. In all the three cases we have plotted a line in correspondence with the periastron passage. In all the cases, the X-ray outbursts follow the epoch of the periastron passage of days.
Of course, if simultaneous optical and X-ray measurements would be always available, our claim about the delay between optical and X-ray outbursts should be further supported.
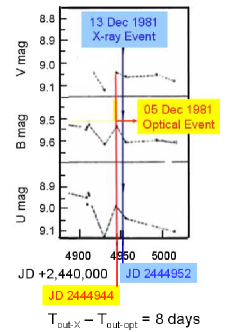
Figure 1 shows the optical relative maximum luminosity in U, B, and V bands of HDE 245770 occurred on December 5, 1981 (811205-E) (Giovannelli et al., 1985), and the date (December 13, 1981) when the subsequent X-ray outburst occurred (811213-E) (Nagase et al., 1982). 811205-E is used for providing the ephemeris of the system (JDopt-outb = JD0(2,444,944) n(111.0 0.4) days) used in this paper.
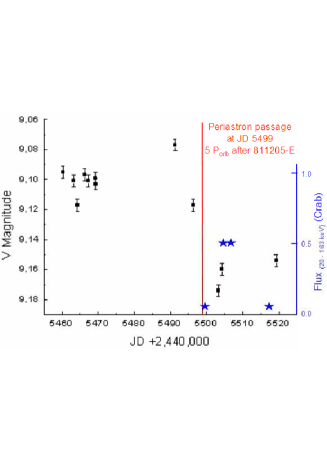
Five cycles after 811205-E, optical data in V band (Gnedin et al., 1988) and X-ray data from Solar Maximum Mission (SMM) in the range 20–163 keV (Sembay et al., 1990), reported in GSG92, are available. Figure 2 reports those data. It is remarkable to note that the X-ray peak reached on June 18–20, 1983 (JD 2,445,504 – 506) occurs days after the periastron passage where the V luminosity is going down from a relative maximum. This fact will be commented later in this section after the description of Fig. 9.
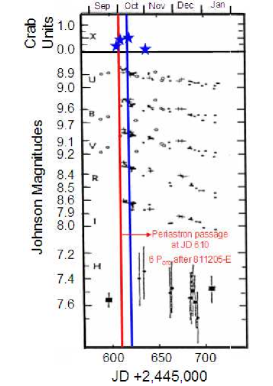
After six orbital periods (JD 2,445,609.14), we have found an optical flare in U,B,V,R,I, and H bands (Giovannelli et al., 1984) just days before the maximum of the X-ray outburst occurred in October 1–18, 1983 (GSG92). Figure 3 shows such events. The red line marks the periastron passage, and the blue line marks the maximum of the X-ray outburst. The blue stars represent the experimental points reported in GSG92, and the references therein.
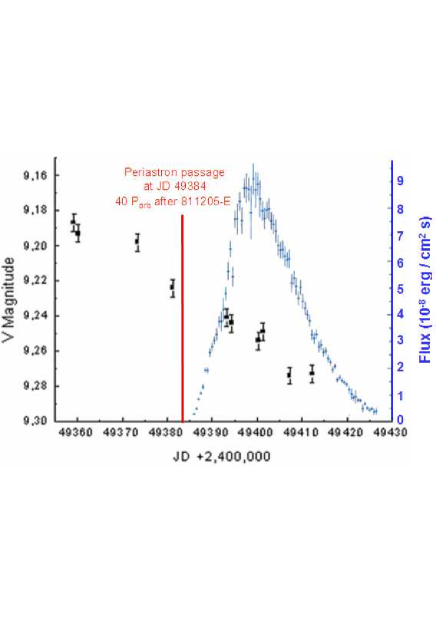
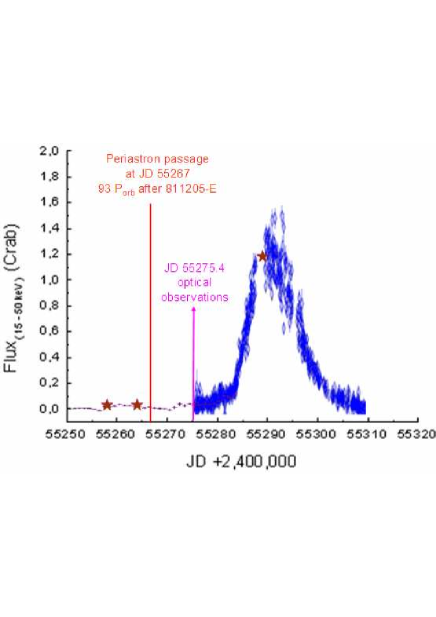
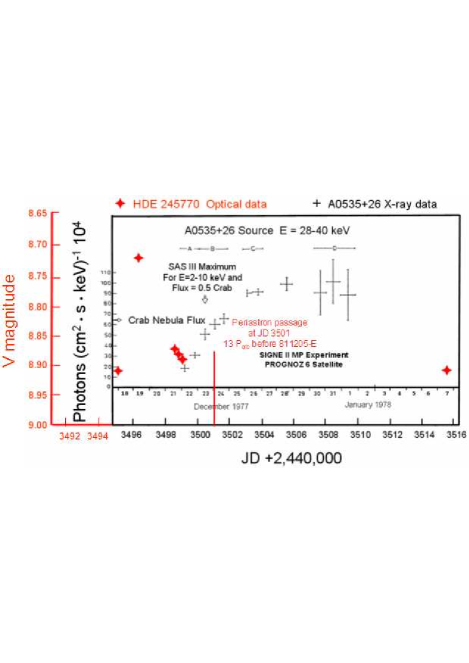
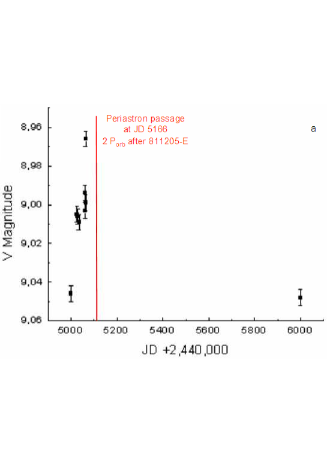
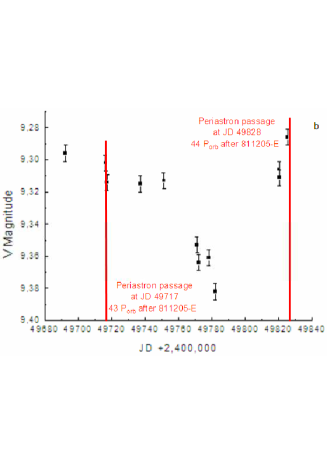
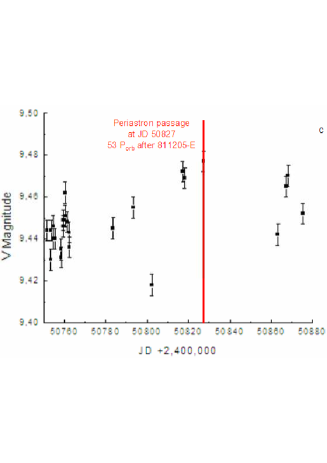
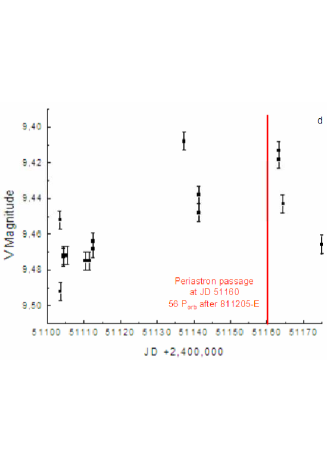
Figure 4 shows optical data (Lyuty & Zaitseva, 2000) and X-ray data (Finger, Wilson & Harmon, 1996) at the 40th cycle (JD 2,449378.240) after 811205-E. The optical luminosity at the periastron passage is just starting the decay from a relative maximum, whilst the X-ray outburst starts day later and reaches about half of its maximum intensity days after the periastron passage. This fact will be commented later in this section after the description of Fig. 9.
Figure 5 shows the strong 2010 March–April X-ray outburst of A0535+26 (Caballero et al., 2010a,b,c; Caballero et al., 2011). This strong outburst was predicted by Giovannelli, Gualandi & Sabau-Graziati (2010) on the basis of a strong activity of HDE 245770 manifested in the Balmer lines. The 93rd cycle after 811205-E, marked with a red line, precedes days the beginning of the X-ray outburst detected by the SWIFT-BAT experiment.
Analyzing the first five figures it appears evident that X-ray outbursts follow the periastron passage of days. In order to enforce such conclusion we show what happened at the epoch of December 1977 – January 1978 X-ray outburst of A 0535+26 (Violes et al., 1982). Just a few days before the beginning of the X-ray outburst, expected by Giovannelli’s group, as described in Giovannelli & Sabau-Graziati (2011), Bartolini et al. (1978) detected a decay from an optical flare of HDE 245770, which rendered possible its final association with the X-ray pulsar A 0535+26. Independent of Bartolini et al. (1978) measurements, Rössiger (1978) detected the maximum of the optical flare at JD +2,443,496.370. Figure 6 shows the optical flare (red stars) constructed by using Bartolini et al. (1978) and Rössiger (1978) data, and the subsequent X-ray outburst (black crosses) (Violes et al., 1982). There is full consistency about the fact that the optical flare precedes the beginning of the X-ray outburst of several days, in this case . The periastron passage, at 13 cycles before 811205-E is marked with a red line. This passage precedes the maximum of the X-ray outburst in the range 28–40 keV of days.
Figure 7 shows a mosaic of plots in which are reported the V magnitudes of HDE 245770 (Flavia’ star) in various epochs in correspondence of the cycles 2, 43, 44, 53, and 56 after 811205-E. In each plot a red line marks the passage at the periastron corresponding to the proper cycle after 811205-E. The source of the optical data used are from Lyuty & Zaitseva (2000), except the data reported in Fig. 7a, which are taken from Gnedin et al. (1988). Unfortunately, X-ray data are not available for those epochs. However, at the periastron passage the optical luminosity is at a relative maximum or very close. Looking at the Fig. 7a it is possible to note that the optical flare, whose maximum is reached at JD 2,445062.267, has a magnitude of order 0.1. A similar optical outburst detected in December 1977 (see Fig. 6), with a magnitude of order 0.17, whose maximum was reached at JD 2,443,496.370, is separated by the former just 14.11 Porb.
Finally, we can show several events detected in X-ray energy range, without correspondent optical data.
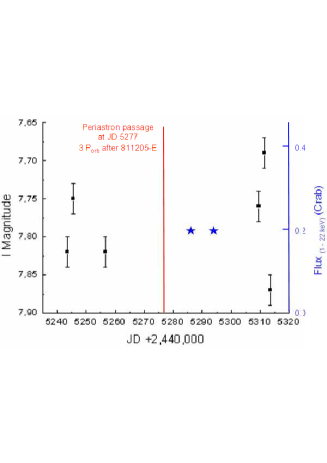
Three cycles after 811205-E, the epoch of X-ray data from A0535+26 – in the range 1–22 keV from the Hakucho satellite (Nagase et al., 1984) and reported in the Table 1 of GSG92 – follows the periastron passage of days. The information available is that the X-ray flux was of Crab on November 12–20, 1982 (JD 2,445,286–294) (see Fig. 8). Upper and lower panels of Fig. 8 report R and I data together with X-ray data, respectively; red line marks the periastron passage. It is remarkable to note that the detected X-ray emission (normal outburst, following GSG92 classification) occurs days after the periastron passage. Unfortunately the measurements in R an I bands of HDE 245770, made by Gnedin et al. (1988), are not available at the periastron.

Close to the 7th cycle after 811205-E (19th January 1984 JD 2,445,720), X-ray data from ASTRON satellite in the range 2 – 25 keV (Giovannelli et al., 1984), reported in GSG92, are available. Figure 9 reports V data (upper panel) and J data (lower panel), marked in black, unfortunately not at the periastron, together with the two X-ray points available (JD 2,445,732 and 735), marked with blue stars. It is remarkable to note that the first X-ray point of the decay of the outburst is placed 11 days after the periastron passage. Although the optical data are not available at the periastron passage, from the upper panel of Fig. 7 we can argue that the V luminosity is decaying from a relative maximum value, when the X-ray outburst appears.
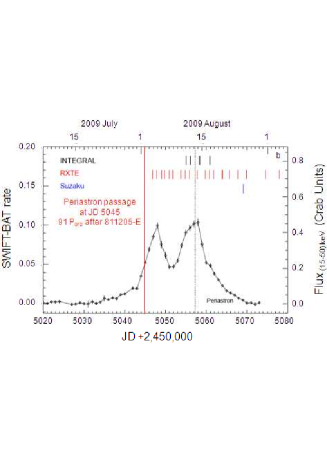
This is the third event, together with those reported in Fig. 2 and Fig. 4 where X-ray outbursts develop during the decay of optical luminosity. This is also the case of the December 77–January 78 strong X-ray outburst that starts during the decay of the optical luminosity (see Fig. 6). This experimental evidence is corroborated by the finding of Yan, Li & Liu (2012) who found that each giant X-ray outburst occurred in a fading phase of the optical brightness. Moreover, the anti-correlation between the optical brightness and Hα intensity during their 2009 observations indicates a mass ejection event had taken place before the July–August 2009 giant X-ray outburst, reported in Fig. 11b and classified as casual or strong X-ray outburst by GSG92.
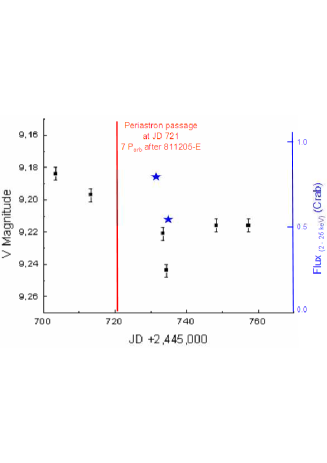
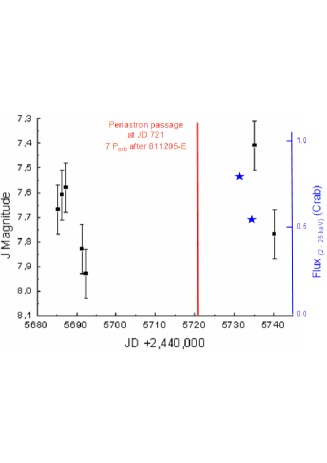
Figure 10 shows the 17th September, 1980 periastron passage which is 4 cycles before 811205-E. Red line marks the periastron passage and blue rectangle the epoch of the September–October X-ray outburst, detected by several experiments whose results are reported in GSG92, and references therein. The few U, B, and V experimental points are reported in the paper by Giovannelli et al. (1985). Unfortunately no optical data are available at the periastron. It is impressive to note that the X-ray outburst follows the periastron passage exactly of 8 days. The start of the X-ray outburst is just 4 orbital periods before the 811213-E, the X-ray short flare that followed the 811205-E. We can say that we are in the presence of a spectacular clock!
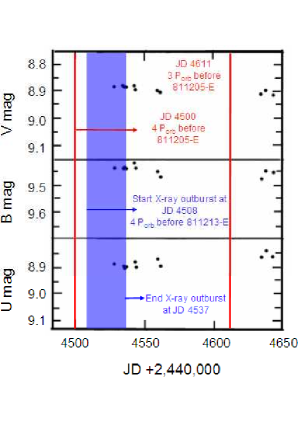
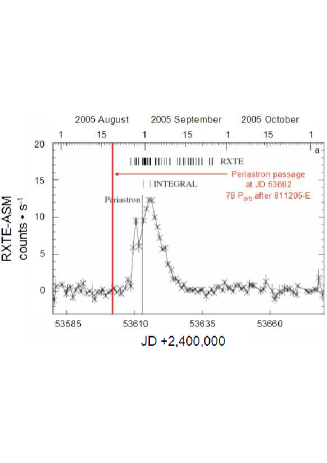
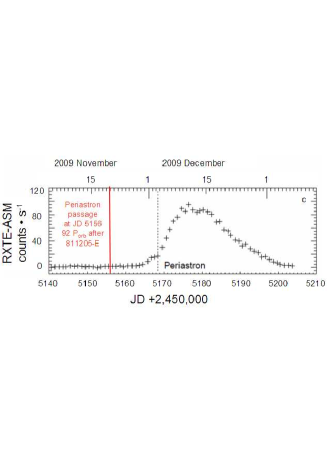
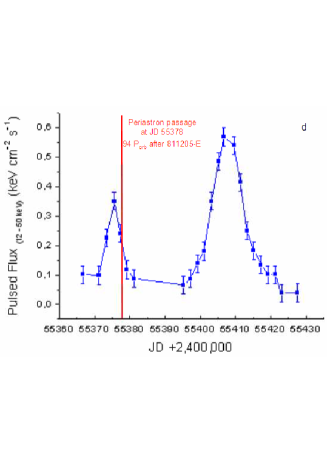
Figure 11 shows a mosaic of plots in which it is possible to look at various X-ray outbursts starting days after the correspondent periastron passage. Panel ‘a’ shows the 2005 August–September X-ray outburst (Caballero et al., 2007). The periastron passage at the 78th cycle after 811205-E is days before the X-ray outburst. Panel ‘b’ shows the 2009 July–August X-ray outburst (Caballero et al., 2010d). The periastron passage at the 91st cycle after 811205-E is days before the double peaked X-ray outburst. Panel ‘c’ shows the 2009 November–December X-ray outburst (Caballero et al., 2011). The periastron passage at the 92nd cycle after 811205-E is days before the rise of the X-ray outburst. Panel ‘d’ shows the 2010 June–August X-ray outburst (Camero-Arranz et al., 2012). The periastron passage at the 94th cycle after 811205 (JD 55364.464) is coincident with the first peak of the double peaked X-ray outburst and days befo re the second peak. This outburst could be an exception, that deserves a deep analysis.
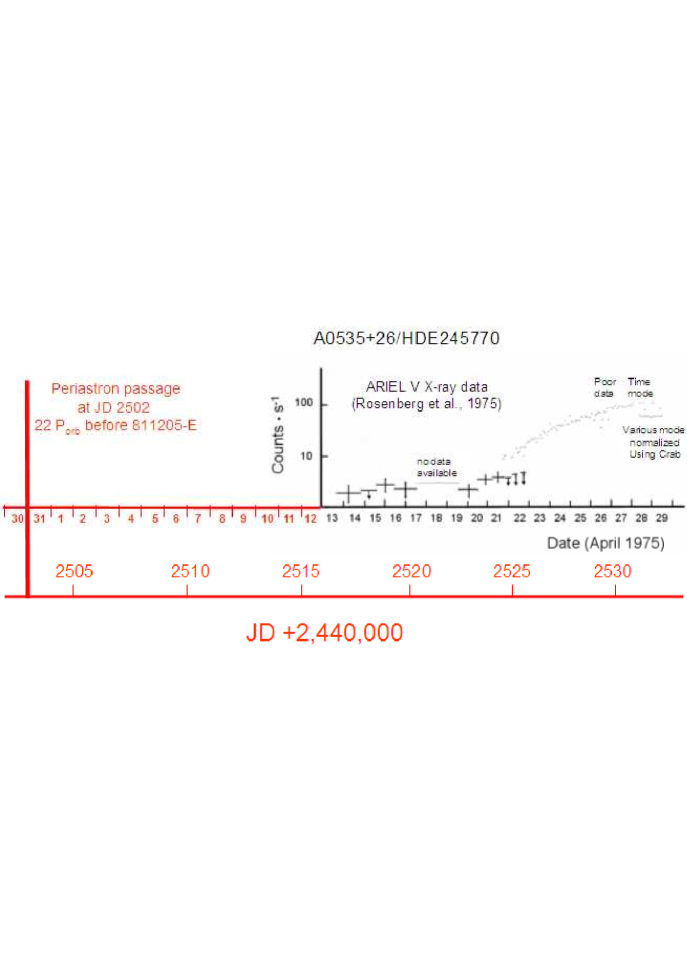
In order to have a final strong proof about such a delay, we have used the data of the first detection of A0535+26 (Rosenberg et al., 1975). Figure 12 shows the first X-ray emission detected from A0535+26 (black crosses and points) and the periastron passage at the 22nd cycle before 811205-E (red line). The X-ray detection of the pulsar starts days after the periastron passage. No X-ray data are available before. It is very impressive how the clock is working!
Thus, in conclusions, it appears evident that the X-ray outbursts occur days after the periastron passage, marked by the optical orbital period of 111.0 days. In the case of short and sharp X-ray outburst, like 811213-E, the time delay with respect to the optical relative maximum (optical flare 811205-E), at the periastron passage, is just 8 days. This bear witness that Flavia’ star was in a ‘quiescent’ state (normal X-ray outburst – GSG92: Figs. 1). The same for the normal X-ray outbursts reported in Figs. 2, 3, and 8. On the contrary, when Flavia’ star is ‘excited’, or ‘expelling a shell’, its luminosity increases much more and the following anomalous X-ray outbursts (GSG92) (Figs. 4, 5, 9, 11a and 11c) or casual X-ray outburst ((GSG92) (Figs. 6, 11b, and 12) are much more intense and with long duration, and start about 8 days after the periastron passage, where the optical flares occur, and develop for many days. The exception is the double peaked X -ray outburst of Fig. 11d for which it is reasonable to think that it occurred casually because of a particular excited state of the optical companion.
Thus we can say that the A0535+26/Flavia’ star system experiences an optical luminosity enhancement of mag, peaked at the periastron passage of the neutron star followed, after days, by X-ray outbursts of intensity dependent on the optical activity. In order to justify quantitatively such a delay we have developed a model that we will describe in the following sections.
3 Observational properties of the X-ray transient A0535+26/HDE245770
The observed orbital period and eccentricity are
From the Kepler law we have a relation
| (1) |
where and are the masses of the optical and neutron stars (used in this paper), respectively. The large semiaxis of the orbit , and minimal separation of the stars at the periastron from equation (1) are determined as (Landau & Lifshitz, 1988)
| (2) |
| (3) |
where year. In quasistatic approximation, a radius of the Roche lobe around the neutron star , at periastron, may be written (Eggleton, 1983)
| (4) |
where is the mass ratio
4 Model of the time delay
Suppose that in the vicinity of the periastron the mass flux rapidly increases, reaching /year. We consider here as a mass flux trough the accretion disk, entering the neutron star. This mass flux during the flare is much greater than the possible flux during the quiescent phase, being the accretion disk probably temporary (Giovannelli et al., 2007). Therefore we neglect this hypothetical small flux in further considerations. The outer parts of the accretion disk become hotter, giving increase to the optical luminosity (optical flush). Due to large turbulent viscosity, the wave of the large mass flux is propagating to the central object. When this wave reaches the vicinity of the neutron star the X-ray luminosity increases due to appearance of a hot accretion disk region, and due to rapid increase of the luminosity when the accretion flow is channeled by the magnetic field, and falls onto the magnetic poles (Bisnovatyi-Kogan, 2002; Bisnovatyi-Kogan & Fridman, 1969).
We identify the time delay between the optical and X-ray flashes, with the time during which the wave of a high mass accretion flux, starting from the outer surface , reaches the central compact star radius . The speed of this wave is approximately equal to the radial speed of the matter in the accretion disk, corresponding to this high mass flux. The time delay is calculated below in this model.
For simplicity, we consider the geometrically thin, optically thick accretion disk without advection, around a compact object. We suggest, that at each radius, with , the accretion disk parameters are the same as in the stationary accretion disk with the same over the whole disk (rapid relaxation approximation). The system of equations describing such disk, in a locally stationary approximation, has a following form (Shakura & Sunyaev, 1973; Bisnovatyi-Kogan, 2002). The mass conservation equation is
| (5) |
The angular momentum equation is
| (6) |
After integration it reduces to a form
| (7) |
where is a specific angular momentum, and is the () component of the viscosity tension tensor (Shakura & Sunyaev, 1973). The other components of this tensor are assumed to be negligibly small; is the Kepler angular velocity . The value of the is determined by the angular momentum at the inner boundary of the accretion disk, with zero derivative of the angular velocity. For the accretion into a black hole it corresponds to the Keplerian angular momentum at the last stable orbit, at . For the accretion into a non-magnetized, slowly rotating neutron star is close to its radius (Bisnovatyi-Kogan, 2002). In the case of a strongly magnetized star, where the Alfvén radius a definition of the inner radius and inner angular momentum are less clear, because the matter flows along the field lines to magnetic poles from the Alfvén surface, and the disk model failed. In our problem the time delay is determined by a slow radial motion in the outer parts of the accretion disk, where and therefore the choice of the value of is not so important. For simplicity, we use the value corresponding formally to the black hole. The local equation of the energy conservation (Shakura & Sunyaev, 1973) is written as
| (8) |
where is the energy production rate by a viscous dissipation, related to the unit of the disk surface,
| (9) |
and is a radiative flux from the optically thick disk, through the unit of the disk surface
| (10) |
Here is the temperature, is the constant of the radiation density, and is the Thompson optical depth, given by for a hydrogen composition. The pressure is determined by a mixture of matter and radiation , as
| (11) |
Here the gas and radiation pressures are given by a standard formulae, where is the gas constant. This system of equations is reduced to a single algebraic non-linear equation for the sound speed (Artemova et al., 1996)
| (12) |
where , and . Solving this equation we find . Radial velocity of the matter in the disk is given by a formula
| (13) |
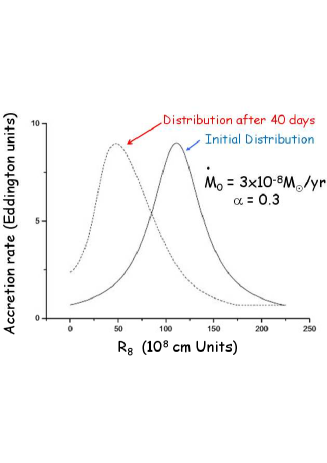
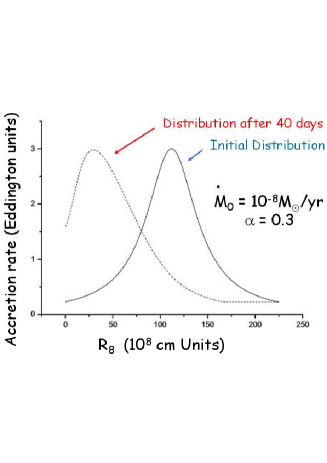
The parameters that we can change in our problem are the viscosity parameter , and the initial mass flux function . The mass of the neutron star is supposed to be known with sufficient accuracy from the observations. We suggest that the flush of matter happens when the neutron star passes around the periastron. The initial distribution of matter flux in the disk is defined as follows
| (14) |
Here define the Lagrangian radius of the disk matter, cm is a point of the maximum mass flux over the disk at the initial time, and cm is a parameter, determining the characteristic width the high mass flux region. We take, for the most intensive outburst, /year as a maximum value of (Persi et al., 1979), /year and /year for less powerful outbursts (de Loore et al., 1984). The disk is formed at the radius , at which the velocity, , of the matter flowing out from the star is of the order of the Keplerian velocity . For the above mentioned the reasonable value of the outflow velocity is km s-1. Furthermore, knowing the local solution for the radial velocity of matter , for the structure of the disk at some point in time we find the time evolution of the initial distribution of matter, in the time interval by the formula
| (15) |
The total mass falling onto the neutron star during the flare in this model is determined by the initial distribution (eq. 14). In the locally static approximation a surface density of the accretion disk at the radius depends on the local value of , as well as of and . The physical conditions in the accretion disk at radius are characterized by a gas pressure and Krammers opacity. The surface density in this region written as (Bisnovatyi-Kogan, 2010), taking the system parameters
| (16) |
Introducing , we obtain
| (17) |
where cm. The mass falling onto the neutron star during the flare is obtained by the integration of over the disk, with the distribution of the from eq. 14. We have
| (18) |
The integral in eq. 18 is converging rapidly in both limits, therefore we may integrate from zero to infinity making only small error. Taking into account , and making the integration
we obtain the value of in the form
| (19) |
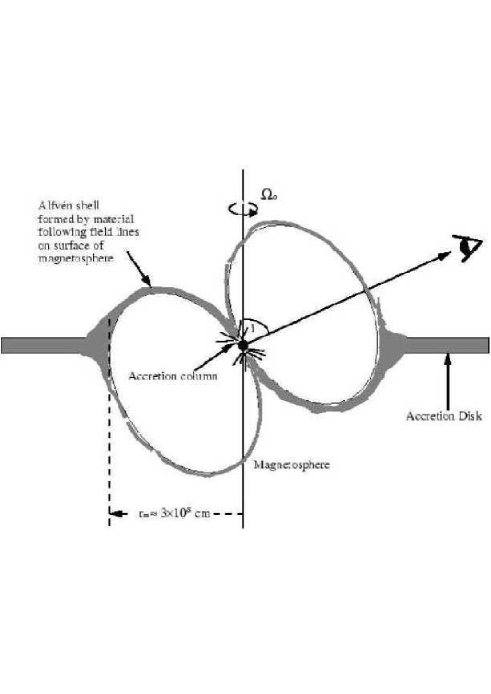
Note, that during the luminous phases the radiation is coming from the disk radius which is much smaller than the initial one, and where the opacity is determined mainly by the Thomson scattering. This is taken into account in the subsequent calculations. Knowing how the matter in the disk is moving, we can calculate the variation of the luminosity of the disk with time, in the optical and X-ray ranges. The luminosity of this object will consist of two components: emission from the disk and emission from hot spots, which are formed on the neutron star by a matter falling onto the magnetic poles (Fig. 13). The integrated luminosity of the disk is determined by the following formula
| (20) |
where is a radiation coming from an elementary ring at the radius , and thickness , in the wavelength range from to , calculated by the formula of blackbody radiation at temperature . To calculate the integrated luminosity in the optical band, the integral (eq. 16)) was calculated in the range 300–700 nm, and for the luminosity in the X-rays band it was done in the range 2–10 keV.
The second component of the radiation comes from the hot spots. Hot spot is formed at the magnetic poles of the neutron star due to infall of the matter from the disk along the magnetic field lines. The magnetic field lines, form a column of matter over the poles of the neutron star. The angular size of the bottom of the column on the neutron star surface is approximately defined by the expression (Baan & Treves, 1973), where is the radius of the neutron star, and is the radius of the Alfvénic surface which is determined by the following expression (Lamb, Pethick & Pines, 1973)
| (21) |
For our system the equatorial magnetic field on the neutron star surface is taken equal to G (Terada et al., 2006), the maximum accretion rate /year (Persi et al., 1979), and the radius of the neutron star km. Knowing the size of the hot spots, it is possible to estimate its effective temperature.
| (22) |
where is the surface of the hot spot, is the efficiency of a conversion of the kinetic energy of a falling matter into a radiation. Knowing the effective temperature and the surface of the hot spot it is possible to calculate the radiation power in the optical and X-ray spectral bands, similar to what was done for the accretion disk.
5 Results
We have calculated the time dependence of the radiation power of the object in two ranges. In the optical (300–700 nm) and X-rays (2–10 keV) ranges. The results for the light curves of the system in these two bands are given in Fig. 14. Upper, middle, and lower panels of Fig. 14 refer to different values of and , as indicated in the figures. The bolometric luminosity is also reported in each panel.
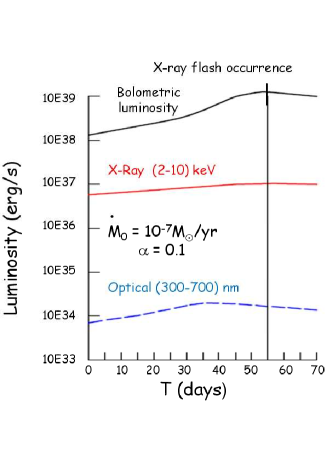
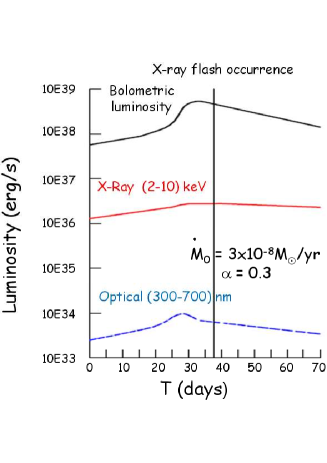
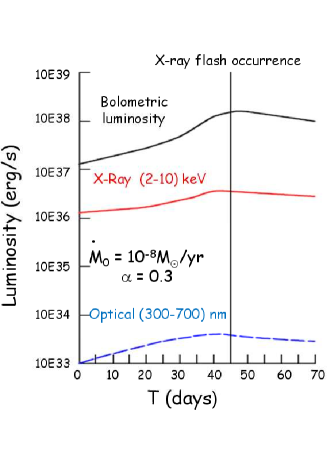
It shows that the maxima of the time dependence of the light curves in different bands are shifted relative to each other. The maximum radiation in the X-ray range is reached later than the maximum of radiation at optical wavelengths. The main parameter of the problem that we have been able to vary is the Shakura-Sunyaev viscosity parameter for the accretion disk. The time delay between the peaks in the optical and X-ray is directly dependent on this parameter. We have found that the time delay between the maxima of the X-ray and optical emissions that we need for explaining of the observational data (for the object A0535+26/HDE245770 it is equal to 8 days) is reached at a value of the viscosity parameter for the powerful flash with /year (Fig. 14, upper panel); and at a value of the viscosity parameter for the flashes with /year, and /year (Fig. 14 middle and lower panels, respectively). The maximum and minimum values of were derived from the papers by Persi et al. (1979) and de Loore et al. (1984), respectively. The mass of the gas falling onto the neutron star during the flare is found from eq. 19
| (23) |
This delay can be explained quite simply. At the beginning the disk was formed due to strong increase of the mass flux when the neutron star approaches the periastron of the orbit. The main emission initially comes from outside, relatively cold regions of the disk, and the maximum luminosity comes just at the optical range. The matter flux rate in the inner parts of the disk is small at this stage and the contribution of the whole disk to the X-ray luminosity is small. The mass flows from the outer to the inner regions as a result of the evolution of the disk.
The contribution of the outer regions in the optical radiation decreases, while the contribution of the radiation from inner hot disk in the X-ray band begins to grow. The radiation from the hot spots at the poles of the neutron star is added, which makes a significant contribution to the radiation in the X-rays.
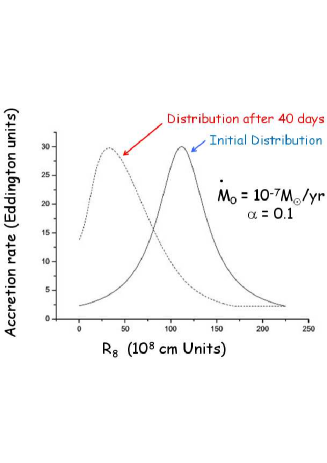
Figure 15 shows the radial dependence of the accretion rate in the disk. Accretion rate is in the units of the Eddington accretion rate. Solid line shows the initial distribution and the broken line shows the distribution of accretion rate on the disk after 40 days of evolution. Upper, middle, and lower panels of Fig. 15 refer to different values of and , as indicated in the figure caption. It is also evident from Fig. 15, that the graphs of the time dependence of the radiation power in X-rays is asymmetrical with respect to the maximum. The increase of radiation power occurs more rapidly than the decline. This is because the initial symmetric distribution of matter in the disk during its evolution becomes asymmetrical. This is consistent with the observed asymmetry in the X-ray light curves of A 0535+26.
Similar behavior may be expected in other high-mass transient systems with highly eccentric orbits. The time delay between optical luminosity enhancement – occurring at the periastron – and X-ray flashes with asymmetric light curves is expected to be similar to that measured in A0535+26/HDE245770.
Note that, according to our model, during the falling flow onto the accreting star, the increase of the luminosity should always start from the low energy part of the spectra, and the maximum in the high energy band follows that in the low energy. This fact can be clearly seen in Fig. 8 where the maximum of the X-ray outburst in the range 2–10 keV (SAS III measures) is reached days before the maximum in the range 28–40 keV (Prognoz 6 satellite – Signe II experiment measures).
This is contrary to that occurring during the ejection of the hot gas from a star or active galactic nucleus (AGN), where the increasing of luminosity starts from the high energy side, and the maximum in the low energy part happens after.
6 Conclusions
The ephemeris used in this paper – JDopt-outb = JD0(2,444,944) n(111.0 0.4) days, derived from the orbital period of the system P days and from the optical flare of December 5, 1981 (811205-E), followed by the X-ray flare of December 13, 1981 (811213-E), allowed us to demonstrate that the A0535+26/Flavia’ star system scans the neutron star passage at the periastron with this periodicity. This passage is roughly 8 days before any kind of X-ray outbursts, but that of June–August 2010.
It appears evident that also the very strong X-ray outbursts, named casual outbursts by GSG92, follow the periastron passage of about 8 days. Indeed, even in the case when a shell is ready to be expelled from the O9.7 IIIe star, the event is triggered at the periastron, because of gravitational corkscrew rule. A huge amount of matter is going onto the temporary accretion disk around the neutron star, producing an enhancement in the optical luminosity. This matter slowly flows onto the neutron star producing the 8-day-delayed strong X-ray outburst. This evidence is astonishingly confirmed looking at the light curve of A0535+26 (Rosenberg et al., 1975), when the X-ray source was detected by the Ariel V satellite: the detection of the outburst started on April 13, 1975 (the first Ariel V measure), and the periastron passage – accordingly with our ephemeris – occurred on March 30, 1975 (JD 2,442,502), days before the beginning of the X-ray outburst, exactly 22 orbital periods before 811205-E (see Fig. 12).
We have constructed a quantitative model of this event, basing on a nonstationary accretion disk behavior, connected with a high ellipticity of the orbital motion. The observed time delay is related to the motion of a high-mass flux region from the outer boundary of the NS Roche lobe to the Alfvén surface due to the action of the –viscosity. For bright outbursts the 8 days delay happens for .
Our model could be valid also in the cases of AGNs. Indeed, Nandra et al. (1998) found a delay of 4 days between UV and X-ray emissions in NGC 7469; Maoz, Edelson & Nandra (2000) found a delay of 100 days between optical and X-ray emissions in the Seyfert galaxy NGC 3516; Marshall, Ryle & Miller (2008) found a delay of 15 days between optical and X-ray emissions in Mkr 509, and Doroshenko et al. (2009) found a delay of 10 days between R, I and X-ray luminosities in the Seyfert galaxy 3C 120.
It is interesting to note that a short qualitative explanation of these lags in AGNs, very similar to our quantitative model, was suggested by Marshall, Ryle & Miller (2008).
7 Acknowledgements
We would like to thank the anonymous referee for his/her very useful suggestions that rendered this paper much more clear, Mr Francesco Reale and Mr Massimo Frutti for their help in the preparation of several figures. This research made use of NASA’s Astrophysics Data System.
References
- [1] Artemova, I. V., Bisnovatyi-Kogan, G. S., Bjoernsson, G., Novikov, I. D.: 1996, ApJ 456, 119
- [2] Baan W.A. Treves A.: 1973, A&A, 22, 421
- [3] Bartolini, C., Guarnieri, A., Piccioni, A., Giangrande, A., Giovannelli, F.: 1978, IAU Circ. No. 3167
- [4] Bartolini, C., Bianco, G., Guarnieri, A., Piccioni, A., Giovannelli, F.: 1983, Hvar Obs. Bull. 7(1), 159.
- [5] Bisnovatyi-Kogan, G. S.: 2010, Stellar Physics. Vol. 2. Stellar evolution and stability. Berlin Heidelberg: Springer (2d Edition)
- [6] Bisnovatyi-Kogan, G. S., Fridman A.M.: Astron. Zh., 1969, 46, 721
- [7] Burger, M., van Dessel, E.L., Giovannelli, F., Sabau-Graziati, L., Bartolini, C. et al.: 1996, in Multifrequency Behaviour of High Energy Cosmic Sources, F. Giovannelli & L. Sabau-Graziati (eds.), Mem. SAIt. 67, 365
- [8] Caballero, I., Kretschmar, P., Santangelo, A., Staubert, R., Klochkov, D., et al.: 2007, A&A 465, L21
- [9] Caballero, I., Lebrun, F., Rodriguez, J., Soldi, S., Mattana, F., et al.: 2010a, ATel. 2496
- [10] Caballero, I., Santangelo, A., Pottschmidt, K., Klochkov, D., Rodriguez, J., et al.: 2010b, ATel. 2541
- [11] Caballero, I., Pottschmidt, K., Barragán, L., Ferrigno, C., Klochkov, D., et al.: 2010c, Talk at CRSF Meeting, Tübingen 2010
- [12] Caballero, I., Kretschmar, P., Pottschmidt, K., Santangelo, A., Wilms, J., et al.: 2010d, AIPC 1248, 147
- [13] Caballero, I., Pottschmidt, K., Santangelo, A., Barragán, L., Klochkov, D., et al.: 2011, arXiv:1107.3417
- [14] Camero-Arranz, A., Finger, M.H., Wilson-Hodge, C.A., Jenke, P., Steele, I., et al.: 2012, ApJ 754, 20
- [15] Coe, M.J., Carpenter, G.F., Engel, A.R., Quenby, J.J.: 1975, Nature 256, 630
- [16] Coe, M.J., Reig, P., McBride, V.A., Galache, J.L., Fabregat, J.: 2006, MNRAS 368, 447
- [17] Doroshenko, V.T., Sergeev, S.G., Efimov, Yu.S., Klimanov, S.A., Nazarov, S.V.: 2009, Astron. Lett. 35, 361
- [18] Eggleton P.P. 1983, ApJ 268, 368
- [19] Finger, M.H., Cominsky, L.R., Wilson, R.B., Harmon, B.A., Fishman, G.J.: 1994, in The Evolution of X-Ray Binaries, S.S. Holt & C.S. Day (eds.), AIP Conf. Proc., 308, 459
- [20] Finger, M.H., Wilson, R.B., Harmon, B.A.: 1996, ApJ 459, 288
- [21] Giangrande, A., Giovannelli, F., Bartolini, C., Guarnieri, A., Piccioni, A.: 1980, A&AS 40, 289.
- [22] Giovannelli, F., Ferrari-Toniolo, M., Persi, P., Golynskaya, I.M., Kurt, V.G., et al.: 1984, in X-Ray Astronomy ’84, M. Oda and R. Giacconi (eds.), Institute of Space and Astronautical Science, Tokyo, p. 205.
- [23] Giovannelli, F., Ferrari-Toniolo, M., Persi, P., Golynskaya, I.M., Kurt, V.G., et al.: 1985, in Multifrequency Behaviour of Galactic Accreting Sources, Proceedings of the 1984 Frascati Workshop, Franco Giovannelli (ed.). Frascati: CNR, Istituto di Astrofisica, Ed. Scientifiche SIDEREA, Roma, p. 284
- [24] Giovannelli, F.; Ziolkowski, J.: 1990, AcA 40, 95
- [25] Giovannelli, F.; Sabau-Graziati, L.: 1992, SSRv 59, 1 (GSG92)
- [26] Giovannelli, F.; Bernabei, S.; Rossi, C.; Sabau-Graziati, L.: 2007, A&A 475, 651G
- [27] Giovannelli, F., Gualandi, R., Sabau-Graziati, L.: 2010, ATel. 2497
- [28] Giovannelli F, Sabau-Graziati L, 2011, Acta Polytechnica 51, No. 2., 21
- [29] Gnedin, Y.N., Zaitseva, G.V., Larionov, V.M., Lyutyi, V.M., Khozov, G.V., Sheffer, E.K.: 1988, Sov. Astron. 32(6), 624
- [30] Guarnieri, A., Bartolini, C., Piccioni, A., Giovannelli, F.: 1985, in Multifrequency Behaviour of Galactic Accreting Sources, Proceedings of the 1984 Frascati Workshop, Franco Giovannelli (ed.). Frascati: CNR, Istituto di Astrofisica, Ed. Scientifiche SIDEREA, Roma, p. 310
- [31] Hutchings, J.B.: 1984, PASP 96, 312
- [32] Janot-Pacheco, E., Motch, C., Mouchet, M.: 1987, A&A 177, 91
- [33] Joss, P.C., Rappaport, S.A.: 1984, Ann. Re. A&A 22, 537
- [34] Kaluzienski, L.J., Holt, S.S., Boldt, E.A. Serlemitsos, P.J.: 1975, Nature 256, 633
- [35] van Kerkwijk, M.H., van Paradijs, J., Zuiderwijk, E.J.: 1995, A&A 303, 497
- [36] Lamb F.K., Pethick C.J., Pines D.: 1973, ApJ 184, 271
- [37] Landau L.D., Lifshitz E.M. 1988, Vol. 1 Mechanics. Nauka. Moscow
- [38] de Loore, C., Giovannelli, F., van Dessel, E.L., Bartolini, C., Burger, M., et al. 1984, A&A 141, 279
- [39] Lyuty, V.M., Zaitseva, G.V.: 2000, Astron. Lett. 26, 9
- [40] Maoz, D., Edelson, R., Nandra, K.: 2000, AJ 119, 119
- [41] Margon, B., Nelson, J., Chanan, G., Bowyer, S., Thorstensen, J.R.: 1977, ApJ 216, 811
- [42] Marshall, K., Ryle, W.T., Miller, H.R.: 2008, ApJ 677, 880
- [43] de Martino, D., Vittone, A., Giovannelli, F., Ciatti, F., Margoni, R., et al.: 1985, in Multifrequency Behaviour of Galactic Accreting Sources, Proceedings of the 1984 Frascati Workshop, Franco Giovannelli (ed.). Frascati: CNR, Istituto di Astrofisica, Ed. Scientifiche SIDEREA, Roma, p. 326
- [44] Motch, C., Stella, L., Janot-Pacheco, E., Mouchet, M.: 1991, ApJ 369, 490
- [45] Nagase, F., Hayakawa, S., Kunieda, H., Makino, F., Masai, K., et al.: 1982, ApJ 263, 814
- [46] Nagase, F., Hayakawa, S., Tsuneo, K., Sato, N., Ikegami, T., et al.: 1984, PASJ 36, 667
- [47] Nandra, K., Clavel, J., Edelson, R.A., George, I.M., Malkan, M.A., et al.: 1998, ApJ 505, 594
- [48] Persi, P., Ferrari-Toniolo, M., Spada, G., Conti, G., di Benedetto, P. et al.: 1979, MNRAS, 187, 293
- [49] Priedhorsky, W.C., Terrell, J.: 1983, Nature 303, 681
- [50] Ricketts, M.J., Turner, M.J.L., Page, C.G., Pounds, K.A.: 1975, Nature, 256, 631
- [51] Rosenberg, F.D., Eyles, C.J., Skinner, G.K., Willmore, A.P.: 1975, Nature 256, 628
- [52] Rössiger, S,: 1978, IBVS 1395
- [53] Sembay, S., Schwartz, R.A., Orwig, L.E., Dennis, B.R., Davies, S.R.: 1990, ApJ 351, 675
- [54] Shakura, N.I., Sunyaev, R.A.: 1973, A&A 24, 337
- [55] Terada, Y., Mihara, T., Nakajima, M., Suzuki, M., Isobe, N., et al.: 2006, ApJ 648, L139
- [56] Thorsett, S.E., Arzoumanian, Z., McKinnon, M.M., Taylor, J.H.: 1993, ApJ 405, L29
- [57] Violes, F., Niel, M., Bui-van, A., Vedrenne, G., Chambon, G., et al.: 1982, ApJ 263, 320
- [58] Yan, J., Li, H., Liu, Q.: 2012, ApJ 744, 37