Rapid and multi-band variability of the TeV-bright active nucleus of the galaxy IC 310
Abstract
Context. The radio galaxy IC 310 has recently been identified as a -ray emitter based on observations at GeV energies with Fermi-LAT and at very high energies (VHE, E100 GeV) with the MAGIC telescopes. Originally classified as a head-tail radio galaxy, the nature of this object is subject of controversy since its nucleus shows blazar-like behavior.
Aims. In order to understand the nature of IC 310 and the origin of the VHE emission we studied the spectral and flux variability of IC 310 from the X-ray band to the VHE -ray regime.
Methods. The light curve of IC 310 above 300 GeV has been measured with the MAGIC telescopes from October 2009 to February 2010. Contemporaneous Fermi-LAT data (2008–2011) in the 10–500 GeV energy range were also analyzed. In the X-ray regime, archival observations from 2003 to 2007 with XMM-Newton, Chandra, and Swift-XRT in the 0.5–10 keV band were studied.
Results. The VHE light curve reveals several high-amplitude and short-duration flares. Day-to-day flux variability is clearly present ( 5 ). The photon index between 120 GeV and 8 TeV remains at the value during both low and high flux states. The VHE spectral shape does not show significant variability, whereas the flux at 1 TeV changes by a factor of . Fermi-LAT detected only eight -ray events in the energy range 10 GeV–500 GeV in three years of observation. The measured photon index of in the Fermi-LAT range is very hard. The X-ray measurements show strong variability in both flux and photon index. The latter varied from to .
Conclusions. The rapid variability measured in -rays and X-rays confirms the blazar-like behavior of IC 310. The multi-TeV -ray emission seems to originate from scales of less than 80 Schwarzschild radii (for a black hole mass of M⊙) within the compact core of its FR I radio jet with orientation angle . The spectral energy distribution resembles that of an extreme blazar, albeit the luminosity is more than two orders of magnitude lower.
Key Words.:
Galaxies: active – Galaxies: individual: IC 310 – -rays: galaxies – X-rays: galaxies1 Introduction
The galaxy IC 310 (redshift of ; Bernardi et al. (2002)) is one of the brightest objects of the Perseus cluster of galaxies at radio frequencies as well as at X-ray energies. It has been detected in the high energy -ray band above 30 GeV with the Fermi Large Area Telescope (Fermi-LAT; Neronov et al. (2010)) and above 260 GeV with the MAGIC telescopes (Aleksić et al. aleksic10 (2010)).
IC 310 was originally classified as a head-tail radio galaxy (HTRG; Sijbring & de Bruyn (1998)) based on the radial alignment of its radio jet on kiloparsec scale with the radially oriented pressure gradient in the surrounding intracluster medium (ICM). The radio morphology of such radio galaxies consists of a bright “head”, located at the core of the host galaxy, and “tails” pointing away from the center of the cluster. In the case of IC 310, the jet bending was assumed to be large, giving rise to the classification as a narrow-angle HTRG (Ryle & Windram (1968); Sijbring & de Bruyn (1998); Miley (1980); Lal & Rao et al. (2005); Feretti et al. (1998)).
A recent detailed investigation of the radio structure of IC 310 using VLBA observations (Kadler et al. kadler (2012)) questions this classification. Inside the “head”, a parsec-scale core-jet structure was detected with no significant detection of a counter jet. The parsec-scale jet appears oriented in the same direction as the kiloparsec structure (the “tail”). This morphology disagrees with the classification as a HTRG since there is no indication for a jet bending process that determines the direction of the tail. Instead, the missing counter-jet implies that Doppler-boosting or other anisotropies play a significant role in this object. Relativistic beaming is commonly found in blazars, i.e., active galactic nuclei (AGN) with their jets pointing very close to the line of sight. Thus, IC 310 appears to be more similar to other AGN detected in the very high energy regime (VHE, 100 GeV) that are mostly blazars (Ackermann et al. (2011)).
On the other hand, if there is no bend, the 400 kpc scale (projected) radio jet (Sijbring & de Bruyn (1998)) would indicate at least a moderately large angle between the jet and the line of sight. IC 310 would then belong to the same class as the three other “non-blazar” AGN detected at VHE, M 87 (Aharonian et al. (2003); Aharonian et al. (2006); Acciari et al. (2008); Albert et al. (2008)), Centaurus A (Aharonian et al. (2009)), and NGC 1275 (Aleksić et al. 2012a ) which are Fanaroff-Riley I (FR I) radio galaxies. Hence, IC 310 may be considered either the closest TeV blazar or the brightest radio galaxy at TeV energies.
The classification of IC 310 in a transitional population between BL Lac objects and FR I radio galaxies was suggested by Rector et al. (1999), based on its optical, radio and X-ray properties. Its weak optical emission lines are similar to those typically found in FR I radio galaxies but the non-thermal continuum from radio to the X-ray range is comparable to a low-luminosity BL Lac (Owen et al. (1996)) . In X-rays, the object is strongly dominated by the non-thermal point-like emission coincident with the radio “head” (Schwarz et al. (1992); Rhee et al. (1994); Sato et al. (2005)). A faint X-ray halo has been observed by Chandra extending in the direction of the radio tail (Dunn et al. (2010)).
Aleksić et al. (aleksic10 (2010)) reported the detection of IC 310 during observations of the Perseus cluster with MAGIC taken place between 2008 November and 2010 February. A hard spectrum ( with ) between 150 GeV and 7 TeV and indications for flux variability on time scale of months and years were reported. The variability time scales of years is confimed by the non-detection of the source reported in 2010 August - 2011 February (Aleksić et al. 2012a ) as well as by a re-detection in more recent MAGIC observations (ATel #4583).
We present a re-analysis of the MAGIC stereo-observation taken during the period of strong activity between 2009 October and 2010 February allowing faster sampling of the light curve and more accurate spectral analysis. We also investigate -ray data of the Fermi-LAT instrument between 2008–2011 and archival X-ray observations with XMM-Newton (2003), Chandra (2004 and 2005) and Swift-XRT (2007). In Sect. 2, the -ray and X-ray observations and methods of data extraction and analysis are presented, while the resulting light curves and energy spectra are reported in Sect. 3. Finally, the observational findings are discussed in Sect. 4.
We adopt a cosmology with , and km s-1 Mpc-1.
2 Data: observations and analysis
2.1 VHE -ray data: The MAGIC telescopes
VHE observations of IC 310 were carried out with the MAGIC telescopes which are two Imaging Atmospheric Cherenkov Telescopes located on the island of La Palma at an altitude of 2200 m. Both telescopes consist of a mirror dish of 17 m diameter associated with a fast imaging camera of field of view. The trigger threshold is 50 GeV and the sensitivity above 290 GeV (in 50 h) is 0.8% of the Crab Nebula flux with an angular resolution better than (Aleksić et al. 2012b ).
From 2009 October to 2010 February, the Perseus cluster was observed with MAGIC in the so-called wobble mode, i.e. pointing alternatively to two positions away from the center of the cluster (NGC 1275). Since IC 310 is located from the cluster center, it appeared as an off-axis source in these observations. The position of the source is and away from the camera center in the two wobble positions, respectively. In our previous publication on IC 310 (Aleksić et al. aleksic10 (2010)) only data of the closest wobble position were used to construct the light curve and the spectrum. Here, we used an improved analysis method that can handle the data of both wobble positions and hence provides more accurate results.
After data quality selection mainly based on the atmospheric conditions, the data sample corresponds to 43.3 h effective time, . The effective time of single MAGIC observations is reported in Tab. 1. The calibration, image cleaning, parameterization, and event reconstruction as well as the gamma/hadron separation were performed with the standard analysis software MARS described in Moralejo et al. (2009). The background estimation is done separately for each wobble position. For the closer wobble position 2 OFF (signal-free) regions at away from the camera center were used and for the wobble position further away 5 OFF regions were chosen with an offset of . The -ray signal is calculated by subtracting the estimated background from the on-source region events. The effective area, , of MAGIC strongly depends on the distance from the camera center. It is estimated separately for each wobble position using Monte Carlo simulations of rays initiated at the same distance from the camera center as the source position.
The spectrum and the light curve from both wobble positions are combined by calculating the sum, over two wobble positions, of the total number of excess events, , measured during each wobble observation weighted by the corresponding effective area and effective time.
Because IC 310 is not located in the central position, the systematic errors can be higher than reported for the standard wobble observation by Aleksić et al. (2012b ). In order to study the systematic effects, we analyzed Crab Nebula observations taken at different offsets from the camera center (from to ) with the same analysis chain. The Crab spectra measured at different offsets, e.g. with and , are in good agreement with the standard observation result. The systematic errors on the flux normalization and photon index are estimated to be below 17% and 0.2, respectively (instead of 11% and 0.15 for standard wobble observations; Aleksić et al. 2012b ). The systematic uncertainty on the energy scale is evaluated to be 15% (Aleksić et al. 2012b ).
2.2 HE -ray data: Fermi-LAT
The Fermi-LAT is a pair-conversion telescope sensitive to photons between 20 MeV and several hundred GeV (Atwood et al. (2009); Ackermann et al. (2012)). Since August 5, 2008 it has operated primarily in sky survey mode, scanning the entire sky every three hours. The data used in this paper were taken between August 5, 2008 and July 31, 2011 (MJD 54683–55773), overlapping the MAGIC observations. The Fermi-LAT results presented here were obtained with the analysis pipeline used to produce the “The First Fermi-LAT Catalog of Sources Above 10 GeV”, designated 1FHL (Ackermann et al. (2013)). This analysis was performed with the ScienceTools software package version v9r26p02. The results presented here were obtained with “Clean” class events in the energy range 10–500 GeV from the region centered at (R.A., Dec.) = (, ) (J2000), and has a radius of . Only data for time periods when the spacecraft rocking angle was less than 52∘ were used, and events with zenith angles larger than 105∘ were excluded in order to reduce the contamination from Earth limb -rays, which are produced by cosmic rays interacting with the upper atmosphere.
In the analysis, the Galactic and extragalactic diffuse backgrounds were parameterized with the files gal_2yearp7v6_v0.fits and iso_p7v6clean.txt, which are publicly available111See http://fermi.gsfc.nasa.gov/ssc/data/access/lat/BackgroundModels.html. Because of the relatively small size of the region, the limited photon count, and the relatively small effective energy range (most photons cluster in the energy range 10–100 GeV), there is some degeneracy in the simultaneous characterization of the Galactic and isotropic diffuse components, so we fixed the normalization of the isotropic component to the best-fit value over the entire sky, and left free the normalization of the Galactic component.
The region analyzed contains only two sources detected above 10 GeV, which based on close positional agreement we have associated with IC 310 and NGC 1275. The source positions used in the spectral fit were the optimized positions from the LAT analysis, which are (, ) for IC 310 and (, ) for NGC 1275. These positions differ from the actual source positions by and respectively for IC 310 and NGC 1275, which are well within the 95% confidence regions (error ellipses) for these two objects: and . The source associated with NGC 1275 is 20 times brighter than IC 310 at GeV energies and separated by only . We note that above 10 GeV the 68% containment radius of the point-spread function of the LAT is about , which means that the sources are resolved, and in particular the spectrum of IC 310 can be separately measured.
We used simple power-law models to characterize the spectra of the sources. The spectral fitting was performed with the binned likelihood method using the P7_V6_CLEAN instrument response functions (see Ackermann et al. ackermann09 (2009)), ten bins per decade in energy starting at 10 GeV, and an angular binning of and for -rays that converted in the thin and thick tungsten layers of the tracker, respectively. Following the global fitting over the full energy range, we extracted photon fluxes in three energy bands: 10–30 GeV, 30–100 GeV and 100–500 GeV by fixing the photon indices (to those from the overall spectral fit) and leaving free only the normalizations in the fits. Because of the low statistics, the flux errors are strongly dominated by Poisson fluctuations and so are not symmetric. In this manuscript we report separate 1 uncertainties toward low/high fluxes obtained via MINOS in the MINUIT package.
2.3 X-ray data: Chandra, XMM-Newton, Swift-XRT
Two Chandra observations of IC 310 were taken with the Advanced CCD Imaging Spectrometer (ACIS) in the 0.5–8 keV band (ACIS-I Observation ID 5596 and 5597). The data sets are not affected by pile-up or detector heating. The observations were made within four months of each other: December 26, 2004 with effectively 25.2 ks for Obs. ID 5597 and March 23, 2005 with 1.5 ks for Obs. ID 5596. The data were analyzed with the Chandra Interactive Analysis of Observations (CIAO 4.4) software using Version 4.4.8 of the calibration files. The extraction radii were chosen to be 4.92′′ for Obs. ID 5597 and 2.46′′ for Obs. ID 5596.
One observation of IC 310 with an exposure of 22.6 ks was taken on February 26, 2003 (Obs. ID 0151560101) with XMM-Newton. Here, we analyzed only data taken with the pn detector of the European Photon Imaging Camera (EPIC-pn) covering the energy range 0.2–15 keV (Strüder et al. (2001)). Data were reduced using the XMM-Newton Software Analysis System (SAS v.11.0.0) and the newest calibration files. For the source spectra, we used a circular region of 30′′ radius, centered on the source. The background was extracted from an equally large circle, but located outside any distinct source of radiation. Only single and double events were used to derive the spectrum.
Swift consists of several instruments covering a broad spectral range including the X-ray telescope (XRT; Burrows et al. (2005)) operating in the 0.2–10 keV band. The observation of IC 310 was performed on February 19, 2007 with an effective observation time of 4.1 ksec. The data were reduced with XRTPIPELINE (V 0.12.6). For the source region, a circle with a radius of 47′′ was used. The background region was created using an annulus centered on the source coordinates with an inner radius of 118′′ and an outer radius of 165′′. The extraction of events was done in XSELECT (V2.4b), using event grades 0–12.
The X-ray data analysis was performed with the Interactive Spectral Interpretation System (Houck & Denicola (2000)). In order to allow for a reasonable spectral fitting, we re-binned the data according to a signal-to-noise criteria for each bin (eight for Swift and XMM-Newton, and four in the case of the two Chandra observations). For the spectral fitting, we used data between 0.5 keV and 10 keV for all three instruments. The photon index and the column density of the neutral hydrogen absorption was determined by the spectral fitting. As IC 310 is located away from the center of the cluster, the contribution of the thermal ICM emission to the X-ray signal is very small, and therefore, it was not necessary to include it when modeling the data.
3 Results
3.1 VHE light curve
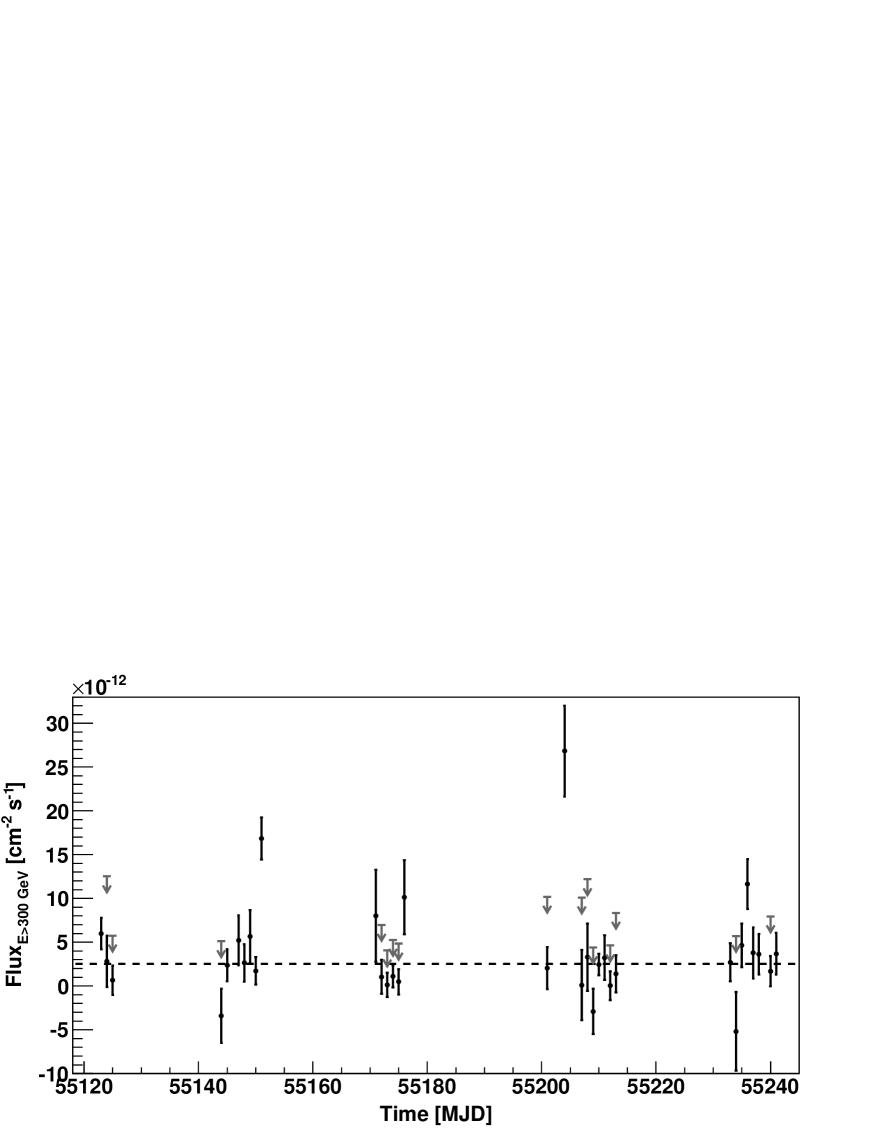
The integral VHE -ray flux of IC 310 has been derived assuming a differential spectrum for the calculation of the effective area following a power-law with a photon index as found in Aleksić et al. (aleksic10 (2010)). However, the dependence of the resulting light curve on the index is only minor. The flux above 300 GeV measured during 33 individual days between 2009 October and 2010 February is shown Fig. 1 and listed in Table 1. Integral upper limits have also been calculated for days showing an excess below one standard deviation (). The upper limits are determined by applying model 4 of Rolke et al. (2005), using a confidence level (c.l.) of 95% and 30% systematic uncertainty. The mean flux above 300 GeV during this period is cm-2s-1 which is in good agreement with the mean flux reported previously, cm-2s-1, using only the wobble position (Aleksić et al. aleksic10 (2010)). The best fit of the flux points, i.e. not including the upper limits, with a constant flux (dashed line, cm-2s-1) has a test value of for 32 degrees of freedom corresponding to a probability of that the source is not variable. Note, that since the high value rejects the validity of the constant flux fit, this value cannot be interpreted as the average flux of the source in the observed time span. The variability of the source is thus detected with a confidence level of 5.8 .
| used dataa𝑎aa𝑎aDates in MAGIC night notation. | MJD start | b𝑏bb𝑏bMeasured flux above 300 GeV in units of ph cm-2s-1. Upper limits are given with 95% confidence level. | |
| [h] | [ ph cm-2 s-1] | ||
| all data | 43.32 | ||
| 2009-10-19 | 55123.02 | 2.43 | |
| 2009-10-20 | 55124.05 | 1.11 | |
| 2009-10-21 | 55125.02 | 1.58 | |
| 2009-11-09 | 55143.96 | 0.80 | |
| 2009-11-10 | 55144.97 | 1.19 | |
| 2009-11-12 | 55146.98 | 0.99 | |
| 2009-11-13 | 55147.98 | 1.17 | |
| 2009-11-14 | 55148.98 | 1.11 | |
| 2009-11-15 | 55149.94 | 2.61 | |
| 2009-11-16 | 55150.94 | 2.34 | |
| 2009-12-06 | 55170.89 | 0.44 | |
| 2009-12-07 | 55171.89 | 1.44 | |
| 2009-12-08 | 55172.88 | 2.51 | |
| 2009-12-09 | 55173.89 | 3.18 | |
| 2009-12-10 | 55174.88 | 2.40 | |
| 2009-12-11 | 55175.88 | 0.54 | |
| 2010-01-05 | 55200.83 | 0.81 | |
| 2010-01-08 | 55203.89 | 0.78 | |
| 2010-01-11 | 55206.87 | 0.62 | |
| 2010-01-12 | 55207.90 | 0.61 | |
| 2010-01-13 | 55208.88 | 0.86 | |
| 2010-01-14 | 55209.84 | 1.47 | |
| 2010-01-15 | 55210.83 | 1.46 | |
| 2010-01-16 | 55211.83 | 1.90 | |
| 2010-01-17 | 55212.84 | 1.22 | |
| 2010-02-06 | 55232.84 | 1.22 | |
| 2010-02-07 | 55233.87 | 0.60 | |
| 2010-02-08 | 55234.85 | 0.90 | |
| 2010-02-09 | 55235.85 | 1.38 | |
| 2010-02-10 | 55236.87 | 0.62 | |
| 2010-02-11 | 55237.86 | 0.87 | |
| 2010-02-13 | 55239.84 | 0.92 | |
| 2010-02-14 | 55240.84 | 1.24 |
Three days show a flux 3 above the constant flux fit: November 16, 2009 (MJD = 55151), January 8 (MJD = 55204) and February 9, 2010 (MJD = 55236)333Observations were taken around midnight UTC. The dates given in this paper correspond to the following day. Exact observation times are given in Table 1.. The mean flux during these three days is cm-2s-1, which is more than six times higher than the constant fit flux. Excluding these three days, the light curve is compatible with a constant flux (probability of 36%).
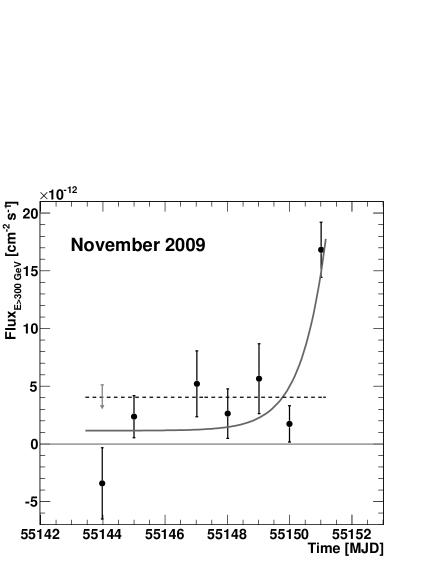
The three flares are isolated and seem to be restricted to a single day bin. The most significant one happened in 2009 November. Figure 2 shows a zoom-in of the daily light curve for this month. IC 310 was observed every day from 9 to 16 except for November 11. The probability of a constant flux during this period is 10-6. The flare appeared during the last day of observation in November and no evidence of an increased flux was seen before. The variability time scale might be shorter than the daily-scale sampling of the light curve but, due to limited statistics intra-night variability could not be established.
The characteristic flux doubling time during a flare can be estimated by fitting the data with a constant plus an exponential increase. However, in the night just before the flare in November the flux was particularly low and the best fit doubling time goes to zero. To estimate the flux-doubling time, we fit the data with fixed doubling times and calculate the probability of each hypothesis with the method. The largest flux-doubling time providing a fit probability above 5% is =0.55 d (thick line in Fig. 2).
The 2010 January and February flares provide much less constraining results because of a sparse time coverage in January and a much less significant flare in February. For the rest of the paper, we consider only the upper limit obtained from the November data.
3.2 VHE spectra
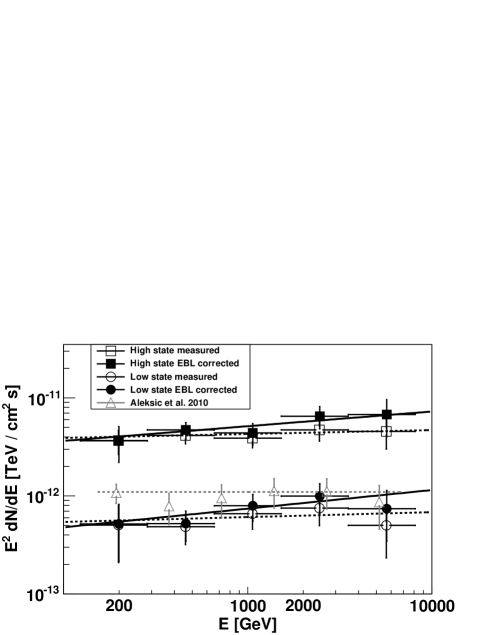
For the spectral analysis, we split the MAGIC data set into two samples corresponding to different -ray emission states. We define a “high state” containing the three measurements with cm-2 s-1 (MJD 55151, 55204 and 55236, =4.5 h), which are the three days with the single-night flux measurements that deviate by more than 2 with respect to the average flux, as shown in Fig. 1. The remaining observations (=38.8 h) were grouped to produce a spectrum for the non-flaring or “low state”. The reconstructed spectra between 120 GeV and 8.1 TeV for both states are shown in Fig. 3. Due to the absorption of VHE rays by the Extragalactic Background Light (EBL) through pair creation, the observed spectra of extragalactic sources are softened. We corrected the spectra for the EBL absorption according to different EBL models (Dominguez et al. dominguez11 (2011); Franceschini et al. (2008); Kneiske & Dole (2010)) which all provide comparable results within the systematic errors. The EBL correction applied here uses the model by Dominguez et al. (dominguez11 (2011)). Due to the proximity of IC 310 (), the effect of the absorption is relatively modest, reducing the flux above 1 TeV by 15–20% and steepening the photon index by 0.1.
Both observed and de-absorbed spectra can be well described by a simple power law for both emission states:
| (1) |
Results for the flux normalization at 1 TeV, , and the photon index, , are summarized in Table 2. Changes in by a factor of 7 between the low and high states had been observed, but no significant change in the photon index.
| state | |||
|---|---|---|---|
| high | observed | ||
| intrinsic | |||
| low | observed | ||
| intrinsic |
3.3 Fermi-LAT results
The three year data taken with -LAT resulted in the detection of IC 310 above 10 GeV with a test statistic of (4.5 ). The integrated flux between 10 and 500 GeV is measured to be . The spectrum in this energy band can be fitted by the following power-law formula with a very hard photon index of :
| (2) |
Here, and are the lower and the upper boundary of the energy bins in GeV, respectively.
The estimated fluxes in three energy bands (10–30 GeV, 30–100 GeV and 100–500 GeV) are shown in Fig. 5. Because of the low statistics, the flux errors are strongly dominated by Poisson fluctuations. Thus, they are asymmetric. In this manuscript we report separate 1 uncertainties toward low/high fluxes obtained via MINOS in the MINUIT package.
In -LAT data, seven of the eight photons detected above 10 GeV arrived within the first 1.5 years of observation (see arrival times in Table 3). This also suggests variability even if the low statistics do not allow a certain conclusion. We did not find any relation between the -LAT photon arrival times and the MAGIC flares.
| MJD | Energy [GeV] |
|---|---|
| 54720.03 | 96.4 |
| 54833.95 | 112.1 |
| 54846.64 | 22.2 |
| 54972.38 | 12.6 |
| 55081.11 | 39.0 |
| 55118.56 | 148.3 |
| 55247.01 | 12.1 |
| 55462.98 | 46.3 |
| instrument | date | exposure | a𝑎aa𝑎aMeasured flux between 0.5 and 2 keV determined by a simple power-law fit. | b𝑏bb𝑏bMeasured flux between 2 and 10 keV determined by a simple power-law fit. | c𝑐cc𝑐cPhoton index: . | d𝑑dd𝑑dAbsorption with a equivalent column of hydrogen. | /d.o.f. |
|---|---|---|---|---|---|---|---|
| [MJD] | [ks] | [10-3 keV s-1 cm-2] | [10-3 keV s-1 cm-2] | [1022 cm-2] | |||
| XMM-Newton | 52697 | 22.6 | 1.0070.012 | 0.828 | 2.55 | 0.146 | 124/104 |
| Chandra ObsID 5596 | 53456 | 1.5 | 1.770.13 | 2.50.4 | 2.010.20 | 0.07 | 62/78 |
| Chandra ObsID 5597 | 53363 | 25.2 | 0.6560.019 | 1.390.08 | 1.760.07 | 0.089 | 97/78 |
| Swift-XRT | 54152 | 4.1 | 0.820.10 | 1.2 | 2.0 | 0.07 | 12/16 |
3.4 X-ray behavior
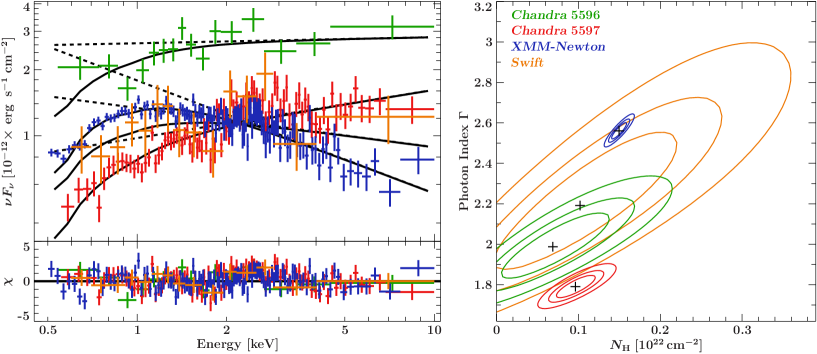
Table 4 and Fig. 4 summarize the analysis results of archival X-ray data for an XMM-Newton, two Chandra and a Swift-XRT observations. The photon index, , and the absorption column, , are derived from fits of power-law models to the 0.5–10 keV data. Because intrinsic absorption due to material close to the X-ray source in excess of the neutral Galactic absorption towards IC 310 (; Kalberla et al., kalberla10 (2010)) cannot be excluded, is left as a free parameter in these fits. Note that the obtained values are compatible with the Galactic absorption except for XMM-Newton. We also tried an analysis of the XMM-Newton data with a broken power law and a fixed . It resulted in a good /d.o.f. but the break energy was found to be at energies where the absorption takes place, i.e, at keV. Thus, a break in the spectrum is potentially mimicked by the absorption.
Our analysis shows that between 2003 and 2007, flux variability is present in the low energy regime (0.5–2 keV) as well as in the higher energy range (2–10 keV) on timescales of years. This variability is accompanied by changes in the photon index and . A problem with this kind of analysis is that there is a well known correlation between the parameters, i.e., softer spectra with larger absorption columns cannot be distinguished from harder spectra with slightly smaller absorption. The right hand panel of Fig.4 shows confidence contours between and for all observations. While the Swift data have too low a signal-to-noise ratio to make a statement on changes in the spectral parameters, a statistically very significant change in photon index and absorption column is present when comparing the higher quality XMM-Newton and Chandra data. The change in the spectral shape cannot be explained solely by a change in absorption, but the intrinsic spectrum of the source appears to have changed between the different observations.
We conclude that the intrinsic source spectral index varies varies between (soft) and (hard). During the Chandra observation the absorption column was consistent with the Galactic value towards IC 310, but was significantly higher during the XMM-Newton observation, which could be due to an increase in the source intrinsic absorption. A possible cause for a change in the internal absorption of the source could be, e.g., the presence of material close to the black hole. Such variation has been seen in a few other active galaxies. For example, a long-term variation of the intrinsic absorption by 30% has been observed in Centaurus A (Benlloch et al. (2010)), where recent observations also found evidence for a short term absorption event that lasted for 170 d (Rivers et al. (2012)).
4 Discussion
4.1 Size and energetics of the emission region
The MAGIC observations establish IC 310 as a source of variable VHE -ray emission down to time scales of the order of one day. The observations rule out the previously discussed origin of the VHE emission at a bow shock driven into the ICM by the radio jets (Neronov et al. (2010)), as this should produce almost steady-state emission. Causality allows us to constrain the radius of a spherical emission region from the observed variability time scale (in units of days)
| (3) |
where denotes the cosmological redshift and the Doppler factor accounting for relativistic bulk motion. Using the upper limit for the doubling time of the 2009 November flare with and , it follows that . For a black hole mass of M⊙ inferred from the central velocity dispersion of IC 310 mcelroy1995 (McElroy 1995) and the M- relation gultekin2009 (Gültekin et al. 2009), we can compare the size with the Schwarschild radius yielding . Adopting a Doppler factor of consistent with the properties of the pc-scale radio jet (Kadler et al. kadler (2012)), the inferred source size becomes . This is the scale on which jet formation is expected to take place, close to the light cylinder of a rotating magnetosphere surrounding the central compact object (McKinney & Blandford (2009), Punsly (2001)). Alternatively, substructures within the jet such as a current-carrying surface sheet (Appl & Camenzind (1993)) or mini-jets due to magnetic reconnection events (Giannios (2013)) also could be possible. The emission from small (compared to the jet diameter) substructures would, however, imply extremely high local photon densities and thus risk -ray absorption by pair production on the low-energy photon fields. This would be in conflict with the optically thin -ray spectrum up to energies of 10 TeV energies. In turn, the optically thin -ray spectrum can be used to constrain the local near-infrared (NIR) photon density within the emission region, presumably due to synchrotron radiation of accelerated electrons. Approximating the -ray energy where the effective cross section is maximized for target photons of energy , the condition leads to the constraint
| (4) |
where denotes the observed NIR luminosity of the
host galaxy skrutskie (Skrutskie et al. 2006).
Adopting , the allowed nonthermal low-energy emission component may reach up to
in the NIR, thus allowing only very weak, but still detectable, brightness variations. Such a non-thermal component extending into the X-ray regime
could explain the observed X-ray luminosity. Even if the source of multi-TeV photons is located in the central galaxy, where the isotropic infared photons from the gas and dust torus
of radius provide a target for pair production, the photons can escape freely since
interpolating the mid-IR luminosity from the observed luminosities and
(IRAS, Beichman et al. (1988)). If an accretion disk is present, its thermal photons would not significantly increase the optical depth at multi-TeV energies due to the fall-off of the pair production cross section above threshold.
Fermi acceleration of electrons with time scale
is possible up to the electron Lorentz factors of
for any plausible magnetic field strength in the jet,
and the synchrotron emission of the accelerated electrons could be responsible for the observed (non-simultaneous) X-ray spectrum (Tammi & Duffy (2009)).
The observed range of spectral indices is suggestive of an underlying power-law particle distribution with a variable cooling break.
The comoving frame -ray luminosity of inferred from the
shock-in-jet scenario amounts to only a small fraction of the total jet luminosity determined from the large-scale radio jet
(Sijbring & de Bruyn (1998)), consistent with the observed unperturbed morphology of the radio jet.
4.2 Comparison with other VHE-emitting AGN
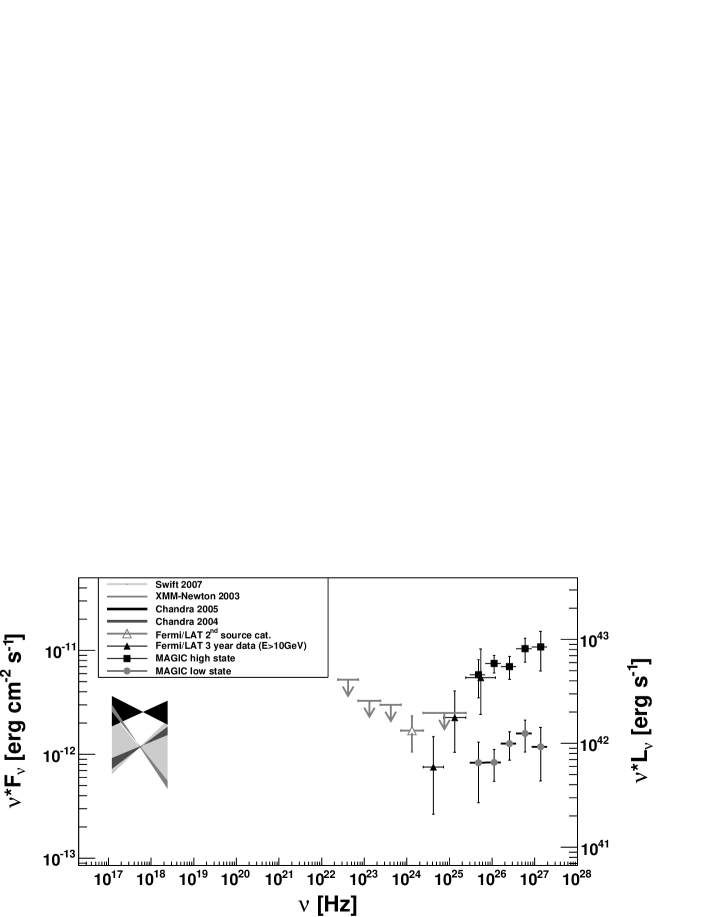
IC 310 shows the spectral energy distribution (SED) and short variability time scale characteristic of blazars, but with an apparent luminosity of erg s-1, i.e. two to three orders of magnitude lower than typical TeV blazars (Fig. 5). The very hard TeV spectrum of IC 310 is reminiscent of extreme high frequency peaked BL Lacs (HBL) similar to 1ES 1426+428 (Wolter et al. (2008)), seemingly extending the blazar sequence claimed by Fossati et al. (fossati98 (1998)) and Ghisellini et al. (ghisellini98 (1998)) to very low luminosities. The low apparent luminosity of the blazar in IC 310 could be the consequence of a relatively large angle between the line of sight and the jet. For example, an angle of and bulk Lorentz factor of corresponding to a Doppler factor of , would imply that the same source, if viewed under an angle would look one hundred times more luminous. Indeed, Ghisellini & Tavecchio (ghisellini08 (2008)) have predicted a large population of weak blazars with angle to the line of sight .
It must be noted, however, that the X-ray and VHE data discussed here are non-simultaneous, and the SED peak values thus uncertain. Therefore, conclusions have to be drawn with caution especially with respect to flaring episodes present in both data sets. The blazar component in IC 310 dominates at X-to--ray energies but is only marginal at infrared-to-optical energies where the host galaxy is at least two orders of magnitude more luminous. Giommi et al. (2012a ) argue that of the moderately beamed blazars in the local Universe () are known as radio-galaxies since their blazar components are sub-luminous compared to the host galaxies. Moderate beaming corresponding to a viewing angle of can indeed explain the one-sidedness of the jet in IC 310 (Kadler et al. kadler (2012)). If there is no bending of the jet, as suggested by the close match between the observed orientation angles of the radio jet between pc and kpc scales the lower limit restricts the length of the de-projected jet from exceeding the extreme end of the jet length distribution of radio galaxies at 1 Mpc (Neeser et al. neeser95 (1995)). A jet length in excess of 1 Mpc would also conflict with the jet life-time of yrs (Sijbring & de Bruyn (1998); de Young (2002)).
On the other hand, the VHE variability of IC 310 is not faster than the variability of other TeV radio galaxies, e.g. M87 (Aharonian et al. (2006); Abramowski et al. (2012)) or NGC 1275 (Colin et al. (2012)), which have relatively large angles between the jet and the line of sight. This may indicate that the bulk Lorentz factor is lower in these radio galaxies than in blazars and that the shock-in-jet scenario becomes inappropriate to accommodate for the short variability time scales. Pulsar-type models for emission from the immediate vicinity of the central object (Levinson & Rieger (2011)) might be a viable option, since anisotropies in the particle and photon distributions would strongly affect the conclusions drawn in the previous paragraph. However, the observed constancy of the spectral shape is unexpected in this scenario. Although variations in the accretion rate of an advection-dominated accretion flow and corresponding variations in the gap size can readily explain the flickering behavior of the -ray flux, the sensitive dependence of the pair-creation optical depth on the accretion rate, and also the energy dependence of the photospheric radius should lead to notable spectral variability.
Another alternative explanation is -ray emission associated with cloud passage through the jet, and vice versa, as originally proposed by Blandford & Königl (blandford (1979)) to explain variability and mass entrainment. Such a scenario has been considered to explain the day-scale VHE flare of M87 as the consequence of proton-proton interactions in the colliding clouds (Barkov et al. (2010); barkov12 (2012)). Bednarek & Protheroe (bednarek97 (1997)) proposed stellar-wind-jet interactions leading to highly anisotropic secondary radiation to explain the rapid -ray variability in AGN jets, and this could also be of relevance in IC 310 if star formation in its central region can supply the short-lived massive stars with strong winds at a sufficiently high rate (Araudo et al. (2013)).
5 Summary and Conclusions
In this paper we presented the re-analysis of the IC 310 data taken with the MAGIC telescopes between 2009 October and 2010 February. Using an improved analysis taking into account the data from both wobble positions, we revealed day-scale flux variability for this object. The size of the emission region is thereby constrained to be smaller than 60-80 Schwarzschild radii of the central supermassive black hole powering the jet in IC 310 (for a black hole mass of M⊙).
A high and a low state spectrum of the source were defined and investigated independently. The photon indices of both were comparable within the error bars whereas the flux at 1 TeV is 7 times higher in the high state compared to the low state. The analysis of Fermi-LAT data above 10 GeV from 2008 August to 2011 August shows very faint emission. At X-ray photon energies, archival data from Chandra, XMM-Newton and Swift-XRT show clear evidence for flux and spectral variability on times scales of years. In the X-ray band, both hard and steep spectra with slopes – were found, but due to their non-simultaneity, it is unclear whether the hard spectral slope is indeed representative of the SED during the -ray observations, as suggested by comparison with extreme blazar SEDs. At -ray energies, the slope of the spectrum measured by Fermi-LAT above 10 GeV is , while the one measured by MAGIC above 120 GeV and reaching almost 10 TeV is .
The day-scale VHE variability rules out emission models occurring in a bow shock between the jet and the ICM, but strongly support the blazar-like scenario. The SED of IC 310 can be interpreted as an extreme HBL with synchrotron radiation peaking in the X-ray band and inverse Compton radiation peaking in the multi-TeV band, although detailed spectral modeling has to await simultaneous data. IC 310 may be considered a representative of a transition population between low-luminosity blazars and FR I radio galaxies at the faint end of their luminosity distributions.
Acknowledgements.
We would like to thank the Instituto de Astrofísica de Canarias for the excellent working conditions at the Observatorio del Roque de los Muchachos in La Palma. The support of the German BMBF and MPG, the Italian INFN, the Swiss National Fund SNF, and the Spanish MICINN is gratefully acknowledged. This work was also supported by the CPAN CSD2007-00042 and MultiDark CSD2009-00064 projects of the Spanish Consolider-Ingenio 2010 programme, by grant 127740 of the Academy of Finland, by the DFG Cluster of Excellence “Origin and Structure of the Universe”, by the DFG Collaborative Research Centers SFB823/C4 and SFB876/C3, and by the Polish MNiSzW grant 745/N-HESS-MAGIC/2010/0. This research has made use of the NASA/IPAC Extragalactic Database (NED) which is operated by the Jet Propulsion Laboratory, California Institute of Technology, under contract with the National Aeronautics and Space Administration. This research has made use of data obtained from the Chandra Data Archive and the Chandra Source Catalog, and software provided by the Chandra X-ray Center (CXC) in the application packages CIAO, ChIPS, and Sherpa. Based on observations obtained with XMM-Newton, an ESA science mission with instruments and contributions directly funded by ESA Member States and NASA. This research has made use of data obtained from the High Energy Astrophysics Science Archive Research Center (HEASARC), provided by NASA’s Goddard Space Flight Center. The Fermi LAT Collaboration acknowledges support from a number of agencies and institutes for both development and the operation of the LAT as well as scientific data analysis. These include NASA and DOE in the United States, CEA/Irfu and IN2P3/CNRS in France, ASI and INFN in Italy, MEXT, KEK, and JAXA in Japan, and the K. A. Wallenberg Foundation, the Swedish Research Council and the National Space Board in Sweden. Additional support from INAF in Italy and CNES in France for science analysis during the operations phase is also gratefully acknowledged. T. Dauser would like to thank the bayerisches Elitenetzwerk and the Bundesministerium für Forschung und Technologie under Deutsches Zentrum für Luft- und Raumfahrt grant 50OR1207”. We would like to thank the referee for helpful comments.References
- Abramowski et al. (2012) Abramowski, A., Acero, F., Aharonian, F., et al. 2012, ApJ, 746, 151
- Acciari et al. (2008) Acciari, V. A., Beilicke, M., Blaylock, G., et al. 2008, ApJ, 679, 397
- (3) Ackermann, M., Ajello, M., Albert, A., et al. 2012, ApJS, 203, 4
- Ackermann et al. (2011) Ackermann, M., Ajello, M., Allafort, A., et al. 2011, ApJ, 743, 171
- Ackermann et al. (2012) Ackermann, M., Ajello, M., Albert, A., et al. 2012, ApJS, 203, 4
- Ackermann et al. (2013) Ackermann, M., Ajello, M., Allafort, A., et al. 2013, ApJS, 209, 34
- Aharonian et al. (2003) Aharonian, F., Akhperjanian, A., Beilicke, M., et al. 2003, A&A, 403, L1
- Aharonian et al. (2006) Aharonian, F., Akhperjanjan, A. G., Bazer-Bachi, A. R., et al. 2006, Science, 314, 1424
- Aharonian et al. (2009) Aharonian, F., Akhperjanjan, A. G., Anton, G., et al. 2009, ApJ, 695, L40
- Albert et al. (2008) Albert, .J, Aliu, E., Anderhub, H., et al. 2008, ApJ, 685, L23
- (11) Aleksic, J., Antonelli, L. A., Antoranz, P., et al. 2010, ApJ, 723., L207
- (12) Aleksić, J., Alvarez, E. A., Antonelli, L. A., et al. 2012a, A&A, 539, L2
- (13) Aleksić, J., Alvarez, E. A., Antonelli, L. A., et al. 2012b, Astropart. Phys. 35, 435
- Appl & Camenzind (1993) Appl, S., & Camenzind, M. 1993, A&A 270, 71
- Araudo et al. (2013) Araudo, A. T., Bosch-Ramon, V., & Romero, G. E. 2013, MNRAS, 436, 3626
- Atwood et al. (2009) Atwood, W. B., Abdo, A. A., Ackermann, M., et al. 2009, ApJ, 697, 1071
- Barkov et al. (2010) Barkov, M. V., Aharonian, F. A., & Bosch-Ramon, V. 2010, ApJ, 724, 1517
- (18) Barkov, M. V., Bosch-Ramon, V., & Aharonian, F. A. 2012, ApJ, 755, 170
- (19) Bednarek, W., & Protheroe, R. J. 1997, MNRAS, 287, 9
- Beichman et al. (1988) Beichman, C. A., Neugebauer, G., Habing, H. J., et al. 1988, NASA Ref. Publ. 1190, 1
- Benlloch et al. (2010) Benlloch, S., Rothschild, R. E., Wilms, J., et al. 2001, A&A, 371, 858
- Bernardi et al. (2002) Bernardi, M., Alonso, M. V., da Costa, L. N., et al. 2002, AJ, 123, 2990
- (23) Blandford, R., & Königl, A. 1979, ApJ, 232, 34
- Burrows et al. (2005) Burrows, D. N., Hill, J. E., Nousek, J. A., et al. 2005, Space Sci. Rev., 120, 165
- Colin et al. (2012) Colin, P., Eisenacher, D., Hildeberg, D., et al. 2012, High energy -ray astronomy meeting in Heidelberg, AIP Conf. Proc. 1505, 578
- de Young (2002) de Young, D. S. 2002, The Physics of Extragalactic Radio Sources (Univ. Chicago Press, Chicago IL)
- (27) Dominguez, A., Primack, J. R., Rosario, D. J., et al. 2011, MNRAS, 410, 2556
- Dunn et al. (2010) Dunn, R. J. H., Allen, S. W., Taylor, G. B., et al. 2010, MNRAS, 404, 180
- Feretti et al. (1998) Feretti, L., Giovannini, G., Klein, U., et al. 1998, A&A, 331, 475
- (30) Fossati, G., Maraschi, L., Celotti, A., et al. 1998, MNRAS, 229, 433
- Franceschini et al. (2008) Franceschini, A., Rodighiero, G., & Vaccari, M. 2008, A&A, 487, 837
- (32) Ghisellini, G., Celotti, A, Fossati, G., et al. 1998, MNRAS, 301, 451
- (33) Ghisellini, G., & Tavecchio, F. 2008, MNRAS, 387, 1669
- Giannios (2013) Giannios D. 2013, MNRAS, 431, 355
- (35) Giommi P., Padovani, P., Polenta, G., et al. 2012a, MNRAS, 420, 2899
- (36) Gültekin, K., Richstone, D. O., Gebhardt, K., et al. 2009, ApJ, 698, 198
- Houck & Denicola (2000) Houck, J. C., & Denicola, L. A. 2000, ASP Conf. Ser., 216, 591
- (38) Kadler, M., Eisenacher, D., Ros, E., et al. 2012, A&A, 538, L1
- (39) Kalberla, P. M., McClure-Griffiths, N. M., Pisano, D. J., et al. 2010, A&A, 521, A17
- Kneiske & Dole (2010) Kneiske, T. M., & Dole, H. 2010, A&A, 515, 19
- Lal & Rao et al. (2005) Lal, D. V., & Rao, A. P. 2005, ASP Conf. Ser., 345, 294
- Levinson & Rieger (2011) Levinson, A., & Rieger, F. 2011, ApJ, 730, 123
- (43) McElroy, D. B. 1995, ApJS 100, 105
- McKinney & Blandford (2009) McKinney, J.C., & Blandford, R. D. 2009, MNRAS, 418, L79
- Moralejo et al. (2009) Moralejo, A., Gaug, M., Carmona, E., et al. 2009, Proc. of 31st ICRC, Łódź, Poland [arXiv:0907.0943]
- Miley (1980) Miley, G. 1980, Annu. Rev. Astron, Astrophys., 18, 165
- (47) Neeser, M. J., Eales, S. A., Law-Green, J. D. 1995, ApJ, 451, 76
- Neronov et al. (2010) Neronov, A., Demikoz, D., & Vovk, Ie. 2010, A&A 519, L6
- Nolan et al. (2012) Nolan, P. L., Abdo, A. A., Ackermann, M., et al. 2012, ApJS, 199, 31
- Owen et al. (1996) Owen, F. N., Ledlow, M. J., & Keel, W. C. 1996, AJ, 111, 53
- Punsly (2001) Punsly, B. 2001, Black Hole Gravitohydromagnetics (Springer, New York)
- Rector et al. (1999) Rector, T. A., Stocke, J. T., & Perlman, E. S. 1999, ApJ, 516, 145
- Rhee et al. (1994) Rhee, G., Burns, J. O. & Kowalski, M. P. 1994, AJ, 108, 1137
- Rivers et al. (2012) Rivers, E., Markowitz, A., Rothschild, R., et al. 2011, ApJ, 742, L29
- Rolke et al. (2005) Rolke, W. A., Lopez, A. M., & Conrad, J. 2005, Nucl. Instr. Meth. Phys. Res. A, 551, 493
- Ryle & Windram (1968) Ryle, M. & Windram, M. D. 1968, MNRAS, 138, 1
- Sato et al. (2005) Sato, N. Y., Furusho, T., Yamasaki, N. Y., et al. 2005, PASJ, 57, 743
- Schwarz et al. (1992) Schwarz, R. A., Edge, A. C., Voges, W., et al. 1992, A&A, 256, L11
- Sijbring & de Bruyn (1998) Sijbring, D., & de Bruyn, A. G. 1998, A&A, 331, 901
- (60) Skrutskie, M. F., Cutri, R. M., Stiening, R., et al. 2006, AJ, 131, 1163 (2MASS Survey)
- Strüder et al. (2001) Strüder, L., Briel, U., Dennerl, K., et al. 2001, A&A, 365, L18-L26
- Tammi & Duffy (2009) Tammi, J., & Duffy, P. 2009, MNRAS, 393, 1063
- Wolter et al. (2008) Wolter, A., Beckmann, V., Ghisellini, G., et al. 2008, ASP Conf. Ser., 386, 302
- (64) Wright, E. L. 2006, PASP, 118, 1711