Activity in Galactic Nuclei of Compact Group Galaxies in the Local Universe
Abstract
We study the nuclear activity of galaxies in local compact groups. We use a spectroscopic sample of 238 galaxies in 58 compact groups from the Sloan Digital Sky Survey data release 7 to estimate the fraction of AGN-host galaxies in compact groups, and to compare it with those in cluster and field regions. We use emission-line ratio diagrams to identify AGN-host galaxies, and find that the AGN fraction of compact group galaxies is 17-42% depending on the AGN classification method. The AGN fraction in compact groups is not the highest among the galaxy environments. This trend remains even if we use several subsamples segregated by galaxy morphology and optical luminosity. The AGN fraction for early-type galaxies decreases with increasing galaxy number density, but the fraction for late-type galaxies changes little. We find no mid-infrared detected AGN-host galaxies in our sample of compact groups using Wide-field Infrared Survey Explorer data. These results suggest that the nuclear activity of compact group galaxies (mostly early types) is not strong because of lack of gas supply even though they may experience frequent galaxy-galaxy interactions and mergers that could trigger nuclear activity.
Subject headings:
galaxies : groups — galaxies : interactions — galaxies : active — galaxies : nuclei1. INTRODUCTION
Understanding what powers the activity in galactic nuclei is one of the key issues in the study of galaxy formation and evolution. There is growing evidence that most galaxies harbor supermassive black holes (SMBHs) in their centers (Kormendy, 2004; Ho, 2008; McConnell & Ma, 2013). However, it is poorly understood why some galaxies show strong nuclear activity through active mass accretion to SMBHs, but other galaxies do not.
Several mechanisms for triggering nuclear activity in galaxies are suggested to explain a gas inflow towards the center of galaxies to feed SMBHs: galaxy-galaxy interaction (e.g., Sanders et al., 1988; Barnes & Hernquist, 1992; Springel et al., 2005; Di Matteo et al., 2007), bar-driven gas inflow (e.g., Combes, 2003), and stellar wind (e.g., Ciotti & Ostriker, 2007). Among these, the galaxy-galaxy interaction has been extensively studied because it is expected in the hierarchical picture of galaxy formation as the star formation is triggered through galaxy-galaxy interactions and mergers. For example, numerical simulations showed that both circumnuclear starburst and nuclear activity can be triggered by gas inflow during galaxy-galaxy interactions (Mihos & Hernquist, 1996; Springel et al., 2005; Di Matteo et al., 2007). Some observational studies detected an enhancement of active galactic nuclei (AGN) fraction in galaxy pairs compared to isolated galaxies, suggesting a strong connection between galaxy interaction and nuclear activity (Alonso et al., 2007; Ellison et al., 2011). However, there are also other studies that found no significant excess of AGN fraction in galaxy pairs (Schmitt, 2001; Grogin et al., 2005; Coldwell & Lambas, 2006; Li et al., 2008).
The studies on the environmental dependence of nuclear activity can provide important hints of AGN triggering mechanism, because the physical mechanisms for nuclear activity, especially galaxy-galaxy interaction, are strongly affected by galaxy environments. In this regard, several studies investigated the fraction of AGN in field and clusters. For example, Sabater et al. (2008) identified AGN candidates among their isolated galaxy sample using far infra-red colors based on IRAS 25 m and 60 m fluxes, and found that 7-22% of the isolated galaxies host AGN (see also Alonso et al., 2007). In contrast, other studies suggested a much lower AGN fraction for galaxy clusters. Dressler et al. (1999) reported that only 1% of cluster galaxies show AGN features in the optical spectra, and Martini et al. (2007) found that the AGN fraction in galaxy clusters based on X-ray data can increase up to 5%. Thus the AGN fraction for high-density regions appears to be smaller than for low-density regions. However, the AGN fraction strongly depends on the AGN selection criteria so that this conclusion needs to be checked.
Hence, it is very important to apply uniform AGN selection criteria for a homogeneous set of data to understand better environmental dependence of the AGN fraction. Haggard et al. (2010) used uniform AGN selection criteria based on X-ray luminosity from Chandra for field and cluster galaxies in the Sloan Digital Sky Survey (SDSS), and found similar AGN fractions between the two regions, in contrast to the previous results described above.
Recently Hwang et al. (2012a) also used uniform AGN selection criteria based on optical spectra for a large sample of cluster and field galaxies in the SDSS. They confirmed the difference in the AGN fraction between cluster and field regions in the case of early-type galaxies in the sense that the cluster galaxies show three times higher AGN fraction than the field galaxies. However, they found little difference in the AGN fraction between the cluster and field galaxies in the case of late-type galaxies. From these results they further suggested that the environmental effects on the AGN fraction strongly depend on the host galaxy morphology as well as environments.
Compact groups of galaxies also provide an interesting environment to examine the physical mechanisms for nuclear activity. These groups are isolated association of several galaxies within the compact angular configuration. Because of their high galaxy number density (e.g., Rubin et al., 1991) and low velocity dispersions ( with a median of 266 (McConnachie et al., 2009), smaller than for rich clusters with (Rines & Diaferio, 2006)), the compact groups are expected to have frequent galaxy-galaxy interactions, which could trigger the activity in galactic nuclei. A formal definition of compact groups was first introduced by Hickson (1982): , , and mag arcsec-2. is the total number of galaxies within 3 mag of the brightest galaxy. is the mean surface brightness of these galaxies within the smallest circular area of , where is the angular diameter of the smallest circle that contains their geometric centers. is the angular diameter of the largest concentric circle that contains no additional galaxies within this magnitude range or brighter. Using these (or slightly modified) selection criteria for compact groups, several authors construct compact group catalogs (e.g., Hickson, 1982; Lee et al., 2004; McConnachie et al., 2009), and study the properties of these groups (e.g., Hickson et al., 1992; Hickson, 1997; Bitsakis et al., 2010, 2011; Mendel et al., 2011; Coenda et al., 2012).
In particular, several studies examined how special the compact groups are for nuclear activity in galaxies (Coziol et al., 1998, 2000; Shimada et al., 2000; Gallagher et al., 2008; Martínez et al., 2010; Sabater et al., 2012). For example, Coziol et al. (2000) estimated the AGN fraction (41%) for 193 galaxies in 49 compact groups based on the analysis of the optical spectra. They suggested that compact groups could be the best location to find AGN in the local universe. Using the 2MASS and Spitzer data, Gallagher et al. (2008) found that 54% of galaxies in 12 Hickson compact groups show hot dust emissions in the mid-infrared, indicating the existence of ongoing nuclear activity and/or star formation. Martínez et al. (2010) compiled the optical spectra of 270 galaxies in 64 Hickson compact groups, and suggested that the AGN fraction could be up to 42% if they include composite galaxies (harboring both AGN and star formation) in the AGN class. These AGN fractions in compact groups apparently are larger than those in field and cluster regions. However, because of different AGN selection criteria and inhomogeneous sample of galaxies in different studies, it is very difficult to have a fair comparison of the AGN fractions in various environments. Recently, Sabater et al. (2012) compared the AGN population of Hickson compact groups and isolated galaxies using a uniform AGN selection criteria based on the optical spectra. They found that AGN do not preferentially appear in compact groups after correcting the morphology and luminosity effects.
In this paper, we study the activity in galactic nuclei of compact group galaxies in the local universe. We use uniform AGN selection criteria for a homogeneous sample of galaxies to compare nuclear activity of compact group galaxies with those of field and cluster galaxies. This paper is organized as follows. In Section 2, we describe the sample of compact groups and control samples of field and clusters. Section 3 explains the AGN selection methods. We present the results on the AGN fraction in compact groups, and compare it with those in other environments in Section 4. We discuss our results in Section 5 and summarize our main results in Section 6. Throughout, we adopt flat CDM cosmological parameters: , and .
2. DATA
We use the compact group catalog in McConnachie et al. (2009, hereafter M09). M09 constructed a compact group catalog using the SDSS (York et al., 2000) data release 6. This catalog contains 2297 CGs with 9713 member galaxies. M09 identified compact groups based only on photometric information. Therefore, their sample could be contaminated by interlopers. They suggested that at least 55% of their groups may contain interlopers.
To select genuine compact groups without any interlopers, we use only compact group galaxies with spectroscopic redshifts in the M09 sample. We first select 58 compact groups at that contain at least four member galaxies with measured redshifts in the SDSS DR7111We use DR7 to add more spectroscopic redshifts (if available) for compact group galaxies originally drawn from the photometric data in DR6.. We then select 238 member galaxies with concordant redshifts in these compact groups (), which will be used for the following analysis. We emphasize that our results are based only on the spectroscopic sample of compact group galaxies, more robust than the results based on the photometric sample of galaxies.
We use several value-added galaxy catalogs (VAGCs) for physical parameters of the group galaxies. Photometric and spectroscopic parameters are adopted from the SDSS pipeline (Stoughton et al., 2002) and from the MPA/JHU DR7 VAGC222http://www.mpa-garching.mpg.de/SDSS/DR7/, respectively. Morphology information is adopted from the Korea Institute for Advanced Study (KIAS) DR7 VAGC333http://astro.kias.re.kr/vagc/dr7/(Choi et al., 2010).
We use [O III] line fluxes taken from the MPA/JHU VAGC (Tremonti et al., 2004), which is the straight integration over the fixed bandpass from the continuum-subtracted emission line. We correct internal extinction of the line fluxes using the Balmer decrement and reddening curve given by Cardelli et al. (1989) by assuming an intrinsic H/H value of 3.1 for AGN host-galaxies. We compute black hole masses () for AGN-host galaxies using the relation: km s-1). We adopt for early-type galaxies, for late-type galaxies, respectively (McConnell & Ma, 2013).
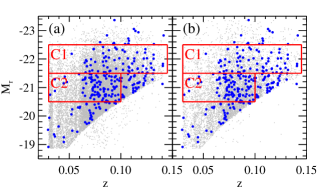
We show -band absolute magnitudes of our compact group galaxies as a function of redshifts in Figure 1 (blue filled circles in both panels). For comparison, we also plot the galaxies in the field (gray dots in the left panel) and in galaxy clusters (gray dots in the right panel). We use these field and cluster galaxies to compare their nuclear activity with those of compact group galaxies in Section 5.2. The field and cluster galaxy samples are taken from Hwang et al. (2012a) who use the same spectroscopic sample of galaxies in SDSS DR7. They compiled galaxies with spectroscopic redshifts associated with 129 relaxed Abell clusters at . Among them, we use 7211 cluster galaxies within the virial radii of clusters (), and 20,331 field galaxies outside the cluster region (R ). is the projected clustercentric radius. To study the environmental dependence of the AGN fraction at a fixed optical luminosity, we divide the galaxies into two magnitude subsamples based on absolute -band magnitudes and redshifts: a bright subsample (C1; and ) and a faint subsample (C2; and ). The C1 and C2 samples contain 64 and 83 galaxies, respectively.
3. AGN SELECTION
To identify AGN-host galaxies in our sample, we use three methods based on emission-line flux ratios: one with strong emission lines and two with weak emission lines.
3.1. Strong emission-line galaxy classification
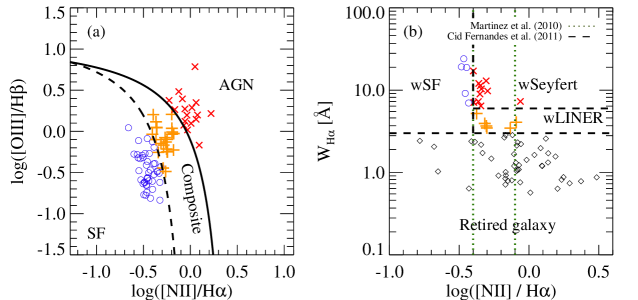
We first use the Baldwin-Phillips-Terlevich (BPT) line ratio diagrams based on [O III]/H and [N II]/H (Baldwin et al., 1981). Among 238 compact group galaxies, we apply this method only to 83 galaxies with signal-to-noise ratio (S/N) in the emission lines H, H, [O III] , and [N II] . We show the line ratios of these 83 galaxies in the left panel in Figure 2. We classify them (star-forming galaxies, AGN, and composite galaxies) based on their relative positions with respect to the demarcation lines identifying extreme starbursts (Kewley et al., 2001) and pure SF (Kauffmann et al., 2003).
Composite galaxies are between the two demarcation lines. They could be extreme star-forming galaxies (Kewley et al., 2001), or host a mixture of star formation and AGN (Kewley et al., 2006). Although the physical origin of this class is not completely understood (Ho, 2008), several observational results in other wavelengths suggest that many of them host (hidden) AGN (e.g., Panessa et al., 2005; Lee et al., 2012). In this study, we include composite galaxies in the AGN class to compute the AGN fraction. We call ‘pure SF’ and ‘pure AGN’ for star-forming and AGN types (pSF and pAGN in tables and figures), respectively, to distinguish them from composite galaxies. Excluding composite galaxies to compute the AGN fraction does not change our conclusions, although our statistics become worse as the number of AGN-host galaxies becomes smaller.
3.2. Weak emission-line galaxy classification
To determine the optical spectral types of the remaining 155 compact group galaxies with low-S/N emission lines, we use two methods based on flux ratios of weak emission lines.
We use the WHAN method (Cid Fernandes et al., 2010, 2011) that uses [N II]/H and H equivalent width (). This method classifies galaxies into five spectral types: pure SFs, Seyferts, LINERs, retired galaxies and passive galaxies (no emission lines). We can apply this method only to 71 galaxies with S/N3 in [N II] and H emission lines. We show the classification diagram in the right panel of Figure 2 (dashed lines), and list the selection criteria for each spectral type,
-
•
weak emission-line star-forming galaxies: log([N II]/H and Å;
-
•
weak emission-line Seyferts: log([N II]/H and Å;
-
•
weak emission-line LINERs: log([N II]/H and 3 Å Å.
We include weak emission-line Seyferts and LINERs in the AGN class when we compute the AGN fraction using this method.
We also adopt the classification method in Martínez et al. (2010), which is based only on [N II]/H (hereafter N2H method). Their classification scheme is as follows (vertical dotted lines in the right panel of Figure 2):
-
•
star-forming galaxies: log([N II]/H;
-
•
composite galaxies: log([N II]/H;
-
•
AGN: log([N II]/H.
4. RESULTS
4.1. AGN fraction in compact groups
| pSF | Composite | pAGNddPure AGN including Seyferts and LINERs. | AGNeeAGN including pAGN and composite galaxies. | ||||||||||
|---|---|---|---|---|---|---|---|---|---|---|---|---|---|
| Method | N(sample)aaThe number of galaxies used for spectral classification. | NbbThe number of galaxies in each spectral type. | ccThe fraction of each type among total 238 compact group galaxies in our sample. The error in the fraction represents 68% () confidence interval that is determined from the bootstrap resampling method. | N | N | N | |||||||
| BPT | 83 | 43 | 23 | 17 | 40 | ||||||||
| WHAN | 71 | 5 | – | – | 18 | 18 | |||||||
| N2H | 71 | 10 | 31 | 30 | 61 | ||||||||
| BPT + WHAN | 154 | 48 | – | – | 58 | 58 | |||||||
| BPT + N2H | 154 | 53 | 54 | 47 | 101 | ||||||||
Among the 238 compact group galaxies in our sample, we can determine the spectral types of 83 galaxies with high-S/N emission lines based on the BPT method: 43 pure SFs, 23 composite galaxies, and 17 pure AGN. These correspond to , , and among the strong emission-line galaxies. If we compute the fraction among the total sample of compact group galaxies, the fraction of each spectral type would be , , and for pure star-forming, composite, and pure AGN-host galaxies, respectively. The AGN fraction (including composite galaxies) is then . We summarize these results in Table 1. We also list the results for 71 weak emssion-line galaxies based on WHAN and N2H methods in Table 1.
Table 1 indicates that the AGN fractions based on strong plus weak emission-line galaxies are higher than for based only on strong emission-line galaxies. If we combine BPT and WHAN methods, the total AGN fraction is . On the other hand, the total AGN fraction is if we combine BPT and N2H methods. We discuss in Section 5.1 why different AGN selection methods give different AGN fractions.
We also examine the AGN fractions of compact group galaxies segregated by their morphologies. Among the 238 compact group galaxies, there are 152 (64%) early-type and 86 (36%) late-type galaxies. The higher fraction of early-type galaxies in compact groups is also apparent for the compact groups in McConnachie et al. (2009) and for the Hickson compact groups (Hickson, 1982). The spectra of early-type galaxies typically do not show emission lines. Therefore, we can determine the spectral types based on the BPT method only for 17.8% (27 galaxies) of early-type galaxies. Using the WHAN and the N2H methods, we can increase the number of early-type galaxies with spectral types up to 73 (48.0%). For late-type galaxies, we can determine the spectral types for 65.1% (56 galaxies) based on the BPT method, and 94.2% (81 galaxies) based on the combination of BPT and N2H/WHAN methods.
We summarize the fraction of each spectral type segregated by galaxy morphologies in Table 2. As expected, the AGN fractions are different depending on the AGN selection method. However, all the AGN selection methods yield higher AGN fractions for late-type galaxies than for early-type galaxies.
| pSF | Composite | pAGN | AGN | |||||||||||
|---|---|---|---|---|---|---|---|---|---|---|---|---|---|---|
| Method | Types | N(sample) | N | aaThe fraction whose numerator is the number of ETGs (or LTGs) with a spectral type and whose denominator is the number of total 152 ETGs (or total 86 LTGs). | N | N | N | |||||||
| BPT | ETG | 27 | 9 | 8 | 10 | 18 | ||||||||
| LTG | 56 | 34 | 15 | 7 | 22 | |||||||||
| BPT | ETG | 73 | 9 | – | – | 23 | 23 | |||||||
| + WHAN | LTG | 81 | 39 | – | – | 34 | 34 | |||||||
| BPT | ETG | 73 | 14 | 25 | 34 | 59 | ||||||||
| + N2H | LTG | 81 | 39 | 29 | 13 | 42 | ||||||||
4.2. Comparison of AGN fractions in various environments
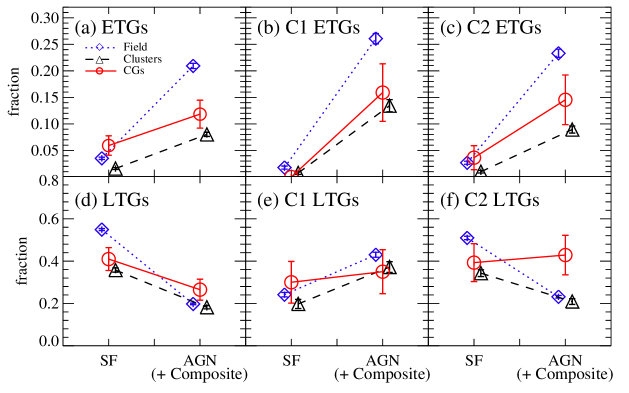
To study the environmental dependence of nuclear activity, we plot the fractions of each spectral type for compact group galaxies (red solid line) in comparison with cluster (black dashed line) and field (blue dotted line) galaxies in Figure 3. The fractions are based on the BPT method, and the results do not change even if we use the AGN fractions based on other methods (i.e., WHAN and N2H). Because the AGN fraction strongly depends on host galaxy properties (Choi et al., 2009; Schawinski et al., 2010), we compute the fractions of each spectral type segregated by absolute magnitude and morphology. The top panels are for early-type galaxies, and bottom panels are for late-type galaxies. The left, middle and right panels are for total, bright and faint samples of galaxies.
The top left panel shows that the AGN fraction (including composite galaxies) for early-type galaxies is not the highest in compact groups. This is also apparent for two magnitude subsamples (middle and right panels). The AGN fraction seems to decrease from field to cluster regions. The AGN fraction for late-type galaxies is not higher in compact groups compared to other regions (left bottom panels), similar to early-type galaxies. However, the difference in AGN fractions among different environments is insignificant for late-type galaxies. The two magnitude subsamples show similar trends. Although the C2 sample shows the higher AGN fraction in compact groups, the difference is insignificant () due to the large error. The fractions of star-forming galaxies among late types are again similar in all environments. We also summarize these results in Table 3, 4 and 5.
| Environment | N(total) | pSF | Composite | pAGN | AGN | ||||
|---|---|---|---|---|---|---|---|---|---|
| N | (%) | N | (%) | N | (%) | N | (%) | ||
| Field | 20331 | 6917 | 2393 | 1705 | 4098 | ||||
| Compact Groups | 238 | 43 | 23 | 17 | 40 | ||||
| Clusters | 7211 | 911 | 464 | 349 | 813 | ||||
| (1) Early-type galaxies in the total sample | |||||||||||||
|---|---|---|---|---|---|---|---|---|---|---|---|---|---|
| Environment | N(total)aaThe number of total galaxies in each category. | N(sample)bbThe number of galaxies classified their spectral type using the BPT method. | pSF | Composite | pAGN | AGN | |||||||
| N | (%) | N | (%) | N | (%) | N | (%) | ||||||
| Field | 8185 | 2001 | 288 | 753 | 960 | 1713 | |||||||
| Compact Groups | 152 | 27 | 9 | 8 | 10 | 18 | |||||||
| Clusters | 4849 | 466 | 77 | 201 | 188 | 389 | |||||||
| (2) Early-type galaxies in the C1 sample | |||||||||||||
| Environment | N(total) | N(sample) | pSF | Composite | pAGN | AGN | |||||||
| N | N | N | N | ||||||||||
| Field | 2033 | 566 | 36 | 173 | 357 | 530 | |||||||
| Compact Groups | 44 | 7 | 0 | 1 | 6 | 7 | |||||||
| Clusters | 923 | 131 | 7 | 58 | 66 | 124 | |||||||
| (3) Early-type galaxies in the C2 sample | |||||||||||||
| Environment | N(total) | N(sample) | pSF | Composite | pAGN | AGN | |||||||
| N | N | N | N | ||||||||||
| Field | 3209 | 834 | 86 | 330 | 418 | 748 | |||||||
| Compact Groups | 55 | 10 | 2 | 5 | 3 | 8 | |||||||
| Clusters | 1812 | 180 | 18 | 85 | 77 | 162 | |||||||
| (1) Late-type galaxies in the total sample | |||||||||||||
|---|---|---|---|---|---|---|---|---|---|---|---|---|---|
| Environment | N(total) | N(sample) | pSF | Composite | pAGN | AGN | |||||||
| N | (%) | N | (%) | N | (%) | N | (%) | ||||||
| Field | 12,071 | 9013 | 6628 | 1640 | 745 | 2385 | |||||||
| Compact Groups | 86 | 56 | 34 | 15 | 7 | 22 | |||||||
| Clusters | 2332 | 1258 | 834 | 263 | 161 | 424 | |||||||
| (2) Late-type galaxies in the C1 sample | |||||||||||||
| Environment | N(total) | N(sample) | pSF | Composite | pAGN | AGN | |||||||
| N | N | N | N | ||||||||||
| Field | 1717 | 1152 | 414 | 408 | 330 | 738 | |||||||
| Compact Groups | 20 | 13 | 6 | 3 | 4 | 7 | |||||||
| Clusters | 344 | 196 | 68 | 60 | 68 | 128 | |||||||
| (3) Late-type galaxies in the C2 sample | |||||||||||||
| Environment | N(total) | N(sample) | pSF | Composite | pAGN | AGN | |||||||
| N | N | N | N | ||||||||||
| Field | 4359 | 3229 | 2221 | 751 | 257 | 1008 | |||||||
| Compact Groups | 28 | 23 | 11 | 9 | 3 | 12 | |||||||
| Clusters | 828 | 457 | 284 | 108 | 65 | 173 | |||||||
To further examine the environmental dependence of nuclear activity, we use a surface galaxy number density () as an environment indicator. We compute the surface galaxy number density with , where is a projected distance to the third nearest galaxy. To minimize the contamination by foreground and background galaxies, we identify the third nearest galaxies among the neighbor galaxies with M and from the spectroscopic sample of galaxies in the SDSS DR7. The neighbor galaxies should have relative velocities to the target galaxy smaller than .
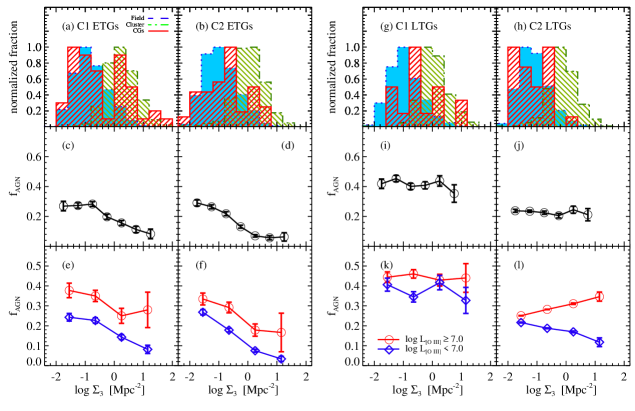
We show the normalized distribution of in top panels of Figure 4. The left two panels are for early-type galaxies, and right two panels are for late-type galaxies. gradually increases from field (dashed-filled histogram) to cluster (dot-dashed-hatched histogram) in all panels. Compact group (solid-hatched histogram) galaxies are distributed in wide range, generally in between field and cluster galaxies, except bright early-type galaxies in C1 sample.
The middle panels show the AGN fractions as a function of for each subsample. For early-type galaxies, the AGN fraction in high-density regions is lower than for low-density regions in both two magnitude subsamples (panels (c-d)). The difference is larger for relatively faint galaxy sample (panel (d)). On the other hand, the AGN fraction for late-type galaxies does not change with surface galaxy number density (panels (i-j)). These results are consistent with those in Figure 3, which are based on different subsamples rather than surface galaxy number densities.
In bottom panels, we show the fractions of AGN-host galaxies segregated by their [O III] line luminosities. The [O III] line luminosity could be an accretion rate indicator (Kauffmann et al. 2003; Heckman et al. 2005; but see also Trouille & Barger 2010). The left two panels for early-type galaxies show that the AGN fractions again decrease with increasing surface galaxy number density except the strong AGN () in C1 sample. For late-type galaxies, the dependence of AGN fraction for each subsample is not conclusive, but no subsamples show strong dependence.
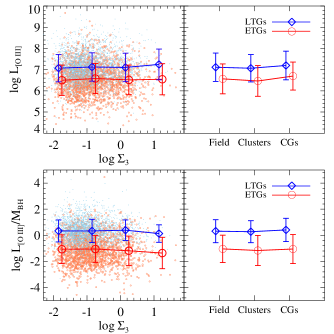
To further study the dependence of nuclear activity, we plot [O III] luminosities of AGN-host galaxies (pAGN and composite galaxies from the BPT method) as a function of (top left panel) and of different environments (top right panel) in Figure 5. It is apparent that [O III] luminosities of late-type galaxies are, on average, larger than those of early-type galaxies. Interestingly, the [O III] luminosities for both early- and late-type galaxies do not show any environmental dependence.
In bottom panels, we plot of AGN-host galaxies. is proportional to the Eddington ratio, and can be used as an indicator of AGN power. The again does not show any environmental dependence, similar to [O III] luminosities. These results are consistent with those in previous studies (Hwang et al., 2012a), suggesting that the triggering of nuclear activity depends on the environment, but the AGN power is not controlled by the environment.
5. DISCUSSION
5.1. AGN fraction in compact groups: comparison with other studies
In this section, we compare the AGN fractions estimated in this study with those for other compact group samples in previous studies. Previous studies on the AGN fraction were mainly based on Hickson compact group galaxies (Coziol et al., 1998; Shimada et al., 2000; Coziol et al., 2004; Martínez et al., 2010). For example, Coziol et al. (1998) first found that the AGN fraction for 82 bright galaxies in 17 Hickson compact groups is based on the BPT method. Similar values of AGN fractions (from 28% in Coziol et al. 2004 to 44% in Shimada et al. 2000) were reported based on similar sample sizes. Recently, Martínez et al. (2010) studied the AGN fraction in Hickson compact groups using the largest sample with 270 galaxies in 64 Hickson compact groups up to date. They obtained optical spectra for 200 galaxies, and compiled the spectra for the rest of sample galaxies in the literature. According to their classification based on emission-line flux ratios, 28.4% and 14.4% of their sample are classified as pure AGN and composite galaxies, respectively. This corresponds to the AGN fraction (including composite galaxies) of 42.8% among the total sample. Although the AGN selection methods in these studies are similar to the one in this study (i.e., emission-line ratio diagrams), the previous values of AGN fractions seem higher than our fractions.
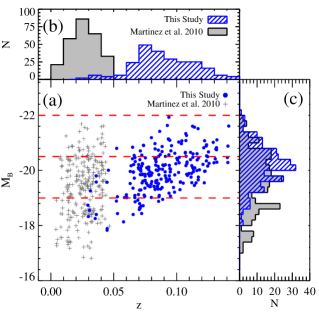
To examine what makes the AGN fraction different depending on galaxy samples, we compare our compact group galaxy sample with the one in Martínez et al. (2010). Figure 6 shows absolute B-band magnitudes of our compact group galaxies (blue filled circles) as a function of redshift. We compute the B-band absolute magnitudes using the SDSS photometric data with the K-correct routine of Blanton & Roweis (2007). Because our sample is from the SDSS spectroscopic sample, the increase of magnitude limit with redshift is apparent in the figure. For comparison, we also plot the galaxies in Martínez et al. (2010, gray crosses). Our compact group galaxies are in the redshift range , but the galaxies in Martínez et al. (2010) are at . We divide the galaxies into two magnitude subsamples (dashed lines) to reduce the magnitude effects.
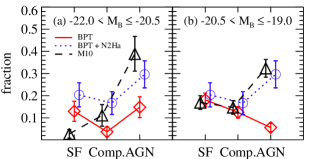
In Figure 7, we show the fraction of each spectral type for two galaxy samples (this study and Martínez et al. 2010). The left and right panels are for bright and faint galaxy subsamples. In both panels, the fractions of composite galaxies and pure AGN based on the BPT method in this study (red solid lines) are significantly lower than those for Martínez et al. (2010). Note that Martínez et al. (2010) included weak emission-line galaxies, and used the N2H method. When we use the same classification method as Martínez et al. (2010) (i.e., N2H method), the fractions in this study (blue dotted lines) are similar to those in Martínez et al. (2010, black dashed lines)444Because of increasing magnitude limit with redshift in our sample (see Figure 6), the faint galaxy sample may not be complete. However, we confirm that the results do not change even if we use the galaxies not affected by the magnitude limit.. This demonstrates that the estimated AGN fraction is strongly affected by the AGN selection method. This also emphasizes the importance of using a consistent AGN selection method to have a fair comparison between different galaxy samples.
Table 1 shows that the AGN fraction based on the BPT+N2H method is higher than those based on other AGN selection methods. This could result from a contamination from ‘fake’ AGN to the AGN sample in the N2H method. For example, the galaxies with small H equivalent widths (i.e., Å) are classified as ‘retired’ or ‘passive’ galaxies in the WHAN method (Cid Fernandes et al., 2011). However, these galaxies are classified as either star-forming, composite or AGN in the N2H method even though their emission lines are very weak. Actually, 22 composite galaxies and 40 pure AGN based on the N2H method have H equivalent widths smaller than 3Å, suggesting that the classification of these galaxies can be uncertain.
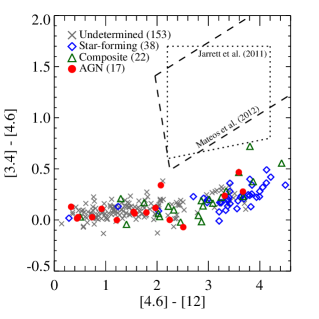
We also examine the mid-infrared colors of compact group galaxies to identify AGN missed by the spectral diagnostics. We use the Wide-Field Infrared Survey Explorer (WISE, Wright et al., 2010) all-sky source catalog555http://wise2.ipac.caltech.edu/docs/release/allsky/#srccat, containing photometric data for over 563 million objects at four MIR bands (3.4, 4.6, 12, and 22 m). We use the point-source profile-fitting magnitudes, and restrict our analysis to the sources with at 3.4, 4.6 and 12 m bands.
The combination of WISE colors is useful for identifying dusty AGN-host galaxies (e.g., Jarrett et al., 2011; Mateos et al., 2012; Hwang et al., 2012b, c). We show the WISE color-color distribution of compact group galaxies in Figure 8. We also overplot two AGN selection criteria proposed by Jarrett et al. (2011, dotted line) and Mateos et al. (2012, dashed line). Interestingly, none of compact group galaxies are selected as AGN in this plot, suggesting that there are few dusty AGN-host galaxies in compact groups.
5.2. Are the compact groups favored environments for the activity in galactic nuclei?
We find that the AGN fraction in compact groups is not the highest among various galaxy environments. If we assume that the activity in galactic nuclei is triggered through galaxy-galaxy interactions, the low AGN fraction in compact groups can suggest that galaxy-galaxy interactions are not frequent in compact groups. This is different from what is usually expected in compact group environment; compact group galaxies would experience frequent interactions and mergers because of their high galaxy number density and low velocity dispersion (Rubin et al., 1991; Forbes et al., 2006; McIntosh et al., 2008). However, Zabludoff & Mulchaey (1998) pointed out that the galaxy interaction rate in X-ray detected groups could be indeed lower than for galaxy-dominated systems because only 1020% of mass of X-ray detected groups is associated with individual galaxies.
On the other hand, the compact groups are considered to be dynamically old systems that already underwent interaction frequent stage. The high fraction of early-type galaxies () in the current epoch also suggests that the compact group galaxies could have experienced frequent galaxy interactions in early epoch. For example, Wilman et al. (2009) found that the fraction of S0 galaxies in groups is already much higher than those in the field, suggesting that the morphological transformation occurred at the early times. The nuclear activity of compact group galaxies may also have been triggered with morphological transformation at early epoch, and then be turned off in the present epoch probably because of lack of fuel (i.e., gas).
In other words, the lower AGN fraction of early-type compact group galaxies than for early-type field galaxies could be understood in terms of lack of gas to fuel SMBHs. Galaxy-galaxy interactions can produce a gas inflow to the central regions of galaxies, and then can trigger both nuclear activity and star formation (e.g., Storchi-Bergmann et al., 2001). However, if there is no gas left in the interacting galaxies, the nuclear activity cannot be triggered in spite of frequent galaxy interactions (Park & Choi, 2009; Park & Hwang, 2009). As shown in Figures 3 and 4, the AGN fraction of early-type galaxies is lower in high-density regions than in low-density regions. This suggests that compact group galaxies contain less amount of gas than field galaxies because the galaxies in compact groups might have consumed or lost their gas. This argument is supported by the atomic gas depletion observed in Hickson compact groups (Verdes-Montenegro et al., 2001). Verdes-Montenegro et al. found that the HI deficiency is stronger for compact groups with more early-type galaxies. These imply that galaxy interactions involving early-type galaxies in compact groups do not trigger nuclear activity because of lack of gas. This interpretation is also valid for early-type cluster galaxies that might have consumed or lost most of their gas (see Hwang et al., 2012a).
For late-type galaxies, the AGN fraction varies little with the environment. The atomic gas in late-type compact group galaxies also seems to be depleted as in early-type compact group galaxies (Verdes-Montenegro et al., 2001). However, the amount of molecular gas in late-type compact group galaxies is still similar to that in field galaxies (Martinez-Badenes et al., 2012). This suggests that the cold gas (mainly molecular gas) of late-type galaxies in compact groups or clusters are not be stripped or consumed yet. This could be because late-type galaxies in compact groups or clusters are accreted recently (Biviano & Katgert, 2004; Hwang & Lee, 2008). Similarly, Haines et al. (2012) concluded that X-ray AGN in their galaxy clusters at 0.150.30 appear to be an infalling population. These results suggest that late-type AGN host galaxies in compact groups or clusters can still feed their SMBHs to be active using the gas that they keep from the field (Martini et al., 2009; Haggard et al., 2010; Hwang et al., 2012a). Therefore, the AGN fractions for late-type galaxies are similar in high- and low-density regions.
We also find that there are few dusty AGN-host galaxies in compact groups (see Figure 8). Considering that the dust depletion in cluster galaxies is strongly connected to the atomic gas depletion (Cortese et al., 2012), the lack of dusty AGN in compact groups is consistent with expectation (Verdes-Montenegro et al., 2001).
6. SUMMARY
Using 238 spectroscopically selected member galaxies in 58 compact groups at , we study the activity in galactic nuclei in compact groups. We also compare nuclear activity of compact group galaxies with those of cluster and field galaxies. Our primary results are summarized as follows.
-
1.
Among the 238 compact group galaxies, we determine the spectral types of 83 galaxies with strong emission lines based on the BPT method. We also use WHAN and N2H methods to classify other 71 galaxies with weak emission lines.
-
2.
We find a strong environmental dependence of AGN fraction for early-type galaxies: highest in the field, but lowest in cluster regions. We confirm this trend with the surface galaxy number density, . These results suggest the nuclear activity in early-type galaxies is not strong in high-density regions because of lack of gas to fuel SMBHs.
-
3.
The AGN fraction for late-type galaxies shows little environmental dependence. This can indicate that late-type galaxies in compact groups are accreted recently, thus they can still keep their gas to fuel SMBHs.
-
4.
and of AGN-host galaxies are higher in late-type galaxies than in early-type galaxies. and of AGN-host galaxies do not show any environmental dependence.
-
5.
We find no dusty AGN-host galaxies in our galaxy sample of compact groups.
References
- Alonso et al. (2007) Alonso, M. S., Lambas, D. G., Tissera, P., & Coldwell, G. 2007, MNRAS, 375, 1017
- Baldwin et al. (1981) Baldwin, J. A., Phillips, M. M., & Terlevich, R. 1981, PASP, 93, 5
- Barnes & Hernquist (1992) Barnes, J. E., & Hernquist, L. 1992, Nature, 360, 715
- Bitsakis et al. (2010) Bitsakis, T., Charmandaris, V., Le Floc’h, E., et al. 2010, A&A, 517, A75
- Bitsakis et al. (2011) Bitsakis, T., Charmandaris, V., da Cunha, E., et al. 2011, A&A, 533, A142
- Biviano & Katgert (2004) Biviano, A., & Katgert, P. 2004, A&A, 424, 779
- Blanton & Roweis (2007) Blanton, M. R., & Roweis, S. 2007, AJ, 133, 734
- Cardelli et al. (1989) Cardelli, J. A., Clayton, G. C., & Mathis, J. S. 1989, ApJ, 345, 245
- Choi et al. (2009) Choi, Y.-Y., Woo, J.-H., & Park, C. 2009, ApJ, 699, 1679
- Choi et al. (2010) Choi, Y.-Y., Han, D.-H., & Kim, S. S. 2010, J. Korean Astron. Soc., 43, 191
- Cid Fernandes et al. (2010) Cid Fernandes, R., Stasińska, G., Schlickmann, M. S., et al. 2010, MNRAS, 403, 1036
- Cid Fernandes et al. (2011) Cid Fernandes, R., Stasińska, G., Mateus, A., & Vale Asari, N. 2011, MNRAS, 413, 1687
- Coenda et al. (2012) Coenda, V., Muriel, H., & Martínez, H. J. 2012, A&A, 543, A119
- Ciotti & Ostriker (2007) Ciotti, L., & Ostriker, J. P. 2007, ApJ, 665, 1038
- Coldwell & Lambas (2006) Coldwell, G. V., & Lambas, D. G. 2006, MNRAS, 371, 786
- Combes (2003) Combes, F. 2003, in ASP Conf. Ser. 209, Active Galactic Nuclei: From Central Engine to Host Galaxy, ed. S. Collin, F. Combes, & I. Shlosman (San Francisco, CA: ASP), 411
- Cortese et al. (2012) Cortese, L., Ciesla, L., Boselli, A., et al. 2012, A&A, 540, A52
- Coziol et al. (1998) Coziol, R., Ribeiro, A. L. B., de Carvalho, R. R., & Capelato, H. V. 1998, ApJ, 493, 563
- Coziol et al. (2000) Coziol, R., Iovino, A., & de Carvalho, R. R. 2000, AJ, 120, 47
- Coziol et al. (2004) Coziol, R., Brinks, E., & Bravo-Alfaro, H. 2004, AJ, 128, 68
- Di Matteo et al. (2007) Di Matteo, P., Combes, F., Melchior, A.-L., & Semelin, B. 2007, A&A, 468, 61
- Dressler et al. (1999) Dressler, A., Smail, I., Poggianti, B. M., et al. 1999, ApJS, 122, 51
- Ellison et al. (2011) Ellison, S. L., Patton, D. R., Mendel, J. T., & Scudder, J. M. 2011, MNRAS, 418, 2043
- Forbes et al. (2006) Forbes, D. A., Ponman, T., Pearce, F., et al. 2006, PASA, 23, 38
- Gallagher et al. (2008) Gallagher, S. C., Johnson, K. E., Hornschemeier, A. E., Charlton, J. C., & Hibbard, J. E. 2008, ApJ, 673, 730
- Grogin et al. (2005) Grogin, N. A., Conselice, C. J., Chatzichristou, E., et al. 2005, ApJ, 627, L97
- Haggard et al. (2010) Haggard, D., Green, P. J., Anderson, S. F., et al. 2010, ApJ, 723, 1447
- Haines et al. (2012) Haines, C. P., Pereira, M. J., Sanderson, A. J. R., et al. 2012, ApJ, 754, 97
- Heckman et al. (2005) Heckman, T. M., Ptak, A., Hornschemeier, A., & Kauffmann, G. 2005, ApJ, 634, 161
- Hickson (1982) Hickson, P. 1982, ApJ, 255, 382
- Hickson et al. (1992) Hickson, P., Mendes de Oliveira, C., Huchra, J. P., & Palumbo, G. G. 1992, ApJ, 399, 353
- Hickson (1997) Hickson, P. 1997, ARA&A, 35, 357
- Ho (2008) Ho, L. C. 2008, ARA&A, 46, 475
- Hwang & Lee (2008) Hwang, H. S., & Lee, M. G. 2008, ApJ, 676, 218
- Hwang et al. (2012a) Hwang, H. S., Park, C., Elbaz, D., & Choi, Y.-Y. 2012a, A&A, 538, A15
- Hwang et al. (2012b) Hwang, H. S., Geller, M. J., Diaferio, A., & Rines, K. J. 2012b, ApJ, 752, 64
- Hwang et al. (2012c) Hwang, H. S., Geller, M. J., Kurtz, M. J., Dell’Antonio, I. P., & Fabricant, D. G. 2012c, ApJ, 758, 25
- Jarrett et al. (2011) Jarrett, T. H., Cohen, M., Masci, F., et al. 2011, ApJ, 735, 112
- Kauffmann et al. (2003) Kauffmann, G., Heckman, T. M., Tremonti, C., et al. 2003, MNRAS, 346, 1055
- Kewley et al. (2001) Kewley, L. J., Dopita, M. A., Sutherland, R. S., Heisler, C. A., & Trevena, J. 2001, ApJ, 556, 121
- Kewley et al. (2006) Kewley, L. J., Groves, B., Kauffmann, G., & Heckman, T. 2006, MNRAS, 372, 961
- Kormendy (2004) Kormendy, J. 2004, Coevolution of Black Holes and Galaxies, 1
- Lee et al. (2004) Lee, B. C., Allam, S. S., Tucker, D. L., et al. 2004, AJ, 127, 1811
- Lee et al. (2012) Lee, J. C., Hwang, H. S., Lee, M. G., Kim, M., & Lee, J. H. 2012, ApJ, 756, 95
- Li et al. (2008) Li, C., Kauffmann, G., Heckman, T. M., White, S. D. M., & Jing, Y. P. 2008, MNRAS, 385, 1915
- Mateos et al. (2012) Mateos, S., Alonso-Herrero, A., Carrera, F. J., et al. 2012, MNRAS, 426, 3271
- Martínez et al. (2010) Martínez, M. A., Del Olmo, A., Coziol, R., & Perea, J. 2010, AJ, 139, 1199
- Martinez-Badenes et al. (2012) Martinez-Badenes, V., Lisenfeld, U., Espada, D., et al. 2012, A&A, 540, A96
- Martini et al. (2007) Martini, P., Mulchaey, J. S., & Kelson, D. D. 2007, ApJ, 664, 761
- Martini et al. (2009) Martini, P., Sivakoff, G. R., & Mulchaey, J. S. 2009, ApJ, 701, 66
- McConnachie et al. (2009) McConnachie, A. W., Patton, D. R., Ellison, S. L., & Simard, L. 2009, MNRAS, 395, 255
- McConnell & Ma (2013) McConnell, N. J., & Ma, C.-P. 2013, ApJ, 764, 184
- McIntosh et al. (2008) McIntosh, D. H., Guo, Y., Hertzberg, J., et al. 2008, MNRAS, 388, 1537
- Mendel et al. (2011) Mendel, J. T., Ellison, S. L., Simard, L., Patton, D. R., & McConnachie, A. W. 2011, MNRAS, 418, 1409
- Mihos & Hernquist (1996) Mihos, J. C., & Hernquist, L. 1996, ApJ, 464, 641
- Osterbrock & Ferland (2006) Osterbrock, D. E., & Ferland, G. J. 2006, Astrophysics of gaseous nebulae and active galactic nuclei, 2nd. ed. by D.E. Osterbrock and G.J. Ferland. Sausalito, CA: University Science Books, 2006,
- Panessa et al. (2005) Panessa, F., Wolter, A., Pellegrini, S., et al. 2005, ApJ, 631, 707
- Park & Choi (2009) Park, C., & Choi, Y.-Y. 2009, ApJ, 691, 1828
- Park & Hwang (2009) Park, C., & Hwang, H. S. 2009, ApJ, 699, 1595
- Rines & Diaferio (2006) Rines, K., & Diaferio, A. 2006, AJ, 132, 1275
- Rubin et al. (1991) Rubin, V. C., Hunter, D. A., & Ford, W. K., Jr. 1991, ApJS, 76, 153
- Sabater et al. (2008) Sabater, J., Leon, S., Verdes-Montenegro, L., et al. 2008, A&A, 486, 73
- Sabater et al. (2012) Sabater, J., Verdes-Montenegro, L., Leon, S., Best, P., & Sulentic, J. 2012, A&A, 545, A15
- Sanders et al. (1988) Sanders, D. B., Soifer, B. T., Elias, J. H., et al. 1988, ApJ, 325, 74
- Schmitt (2001) Schmitt, H. R. 2001, AJ, 122, 2243
- Schawinski et al. (2010) Schawinski, K., Urry, C. M., Virani, S., et al. 2010, ApJ, 711, 284
- Shimada et al. (2000) Shimada, M., Ohyama, Y., Nishiura, S., Murayama, T., & Taniguchi, Y. 2000, AJ, 119, 2664
- Springel et al. (2005) Springel, V., Di Matteo, T., & Hernquist, L. 2005, ApJ, 620, L79
- Storchi-Bergmann et al. (2001) Storchi-Bergmann, T., González Delgado, R. M., Schmitt, H. R., Cid Fernandes, R., & Heckman, T. 2001, ApJ, 559, 147
- Stoughton et al. (2002) Stoughton, C., Lupton, R. H., Bernardi, M., et al. 2002, AJ, 123, 485
- Tremonti et al. (2004) Tremonti, C. A., Heckman, T. M., Kauffmann, G., et al. 2004, ApJ, 613, 898
- Trouille & Barger (2010) Trouille, L., & Barger, A. J. 2010, ApJ, 722, 212
- Verdes-Montenegro et al. (2001) Verdes-Montenegro, L., Yun, M. S., Williams, B. A., et al. 2001, A&A, 377, 812
- Wilman et al. (2009) Wilman, R. J., Edge, A. C., & Swinbank, A. M. 2009, MNRAS, 395, 1355
- Wright et al. (2010) Wright, E. L., Eisenhardt, P. R. M., Mainzer, A. K., et al. 2010, AJ, 140, 1868
- York et al. (2000) York, D. G., Adelman, J., Anderson, J. E., Jr., et al. 2000, AJ, 120, 1579
- Zabludoff & Mulchaey (1998) Zabludoff, A. I., & Mulchaey, J. S. 1998, ApJ, 496, 39