Observation of magnetically hard grain boundaries in double-perovskite Sr2FeMoO6
Abstract
Unusual low temperature magneto-resistance (MR) of ferromagnetic Sr2FeMoO6 polycrystals has been attributed to magnetically hard grain boundaries which act as spin valves. We detected the different magnetic hysteresis curves for the grains and the grain boundaries of polycrystalline Sr2FeMoO6 by utilizing the different probing depths of the different detection modes of x-ray absorption spectroscopy (XAS) and x-ray magnetic circular dichroism (XMCD), namely, the total electron yield (TEY) mode (probing depth 5 nm) and the total fluorescence yield (TFY) mode (probing depth 100 nm). At 20 K, the magnetic coercivity detected in the TEY mode () was several times larger than that in the TFY mode (), indicating harder ferromagnetism of the grain boundaries than that of the grains. At room temperature, the grain boundary magnetism became soft and and were nearly the same. From line-shape analysis of the XAS and XMCD spectra, we found that in the grain boundary region the ferromagnetic component is dominated by Fe2+ or well-screened signals while the non-magnetic component is dominated by Fe3+ or poorly-screened signals.
pacs:
75.60.-d, 61.72.Mm, 75.50.Cc, 78.70.DmColossal magneto-resistance (CMR) Jonker and Santen (1950), a giant decrease of
the electrical resistivity under a magnetic field, is a remarkable
property that can be applied to spintronics devices. CMR has been
observed in many complex oxides of Mn such as La1-xCaxMnOy
Jin et al. (1994), La1-xBaxMnOy von Helmolt et al. (1993), and Tl2Mn2O7 Subramanian et al. (1996). However, it needs high magnetic
fields in the 1 T range, making the pravtical use of these materials
difficult. On the other hand, low-field grain-boundary magneto-resistance has been discovered in the pyrochlore-type Tl2Mn2O7
Hwang and Cheong (1997). The polycrystalline double perovskite
Sr2FeMoO6 (SFMO), which has a high Curie temperature K, has also been discovered to show CMR at low
magnetic field and room temperature
Kobayashi et al. (1998) and therefore has become one of
the most promising materials for the application of CMR. Because the
same low-field magneto-resistance (LFMR) has not been observed in single
crystalline samples Tomioka et al. (2000), tunneling
magneto-resistance (TMR) between ferromagnetic grains via insulating
grain boundaries has been proposed as a mechanism of the LFMR of
SFMO Tomioka et al. (2000).
However, a recent study of polycrystalline
SFMO has shown unusual magneto-resistance (MR) that cannot be explained
by the conventional TMR mechanism, according to which the peak MR should
occur at a magnetic
field which coincides with the magnetic coercivity ()
Ohno et al. (2001). At low temperatures, the MR peak of SFMO occurs
at magnetic fields () about 6 times larger than
Sarma et al. (2007), while such a difference between and
disappears at high temperatures Ray et al. (2011). It has been suggested
Sarma et al. (2007) that the unusual MR in SFMO is controlled by the spin polarization of grain-boundary
regions acting as spin valves, and is called spin-valve-type MR
(SVMR), in contrast to the conventional MR in which the tunnel barriers are
non-magnetic. If the of the magnetic tunnel barrier is
larger than that of the grains, the discrepancy between and
can be understood. However, it is difficult to
differentiate between the magnetic states of
the grains and the grain boundaries using conventional magnetization
measurements.
In this work, we have investigated the different coersivities between the grains and the grain boundaries by using x-ray magnetic
circular dichroism (XMCD) at the Fe edges. We have
utilized the different probing depths of different detection modes,
namely, the total electron yield (TEY,
probing depth 5 nm) and total fluorescence yield (TFY, probing
depth 100 nm) modes.
Polycrystalline samples were prepared by arc melting and annealing in 2% hydrogen and 98% argon atmosphere at 1250 ∘C
111This sample is similar to sample C in Ref Sarma et al. (2007). Details of the sample
preparation are given in Ref Sarma et al. (2007).. Electron microscopy observation
showed that the
average grain size was 5 - 10
m. The grain
boundaries are expected to have the thickness of order 1 nm. X-ray absorption
spectroscopy (XAS) and XMCD measurements
were carried out at the Dragon beam line 11A of National Synchrotron Radiation Research
Center (NSRRC), Taiwan. The monochromator resolution was and
the degree of circular polarization of x-rays was 60 %. Angle
between the incident light and the magnetic field was 30∘, and
magnetic fields (from -1 T
to 1 T) were applied parallel to the sample surface. The measurement
temperatures were 20 and 300 K. The samples were scraped in situ by a diamond file under an ultrahigh
vacuum of Torr. When sintered
polycrystalline samples are scraped, if intergranular fracture
dominates intragranular one, the scraped surface would largely consist of
grain boundaries. Because the thickness of the grain
boundaries is expected to be of order a few nm, it is comparable to the probing depth of
the TEY mode. Therefore, spectra taken in the TEY mode would be dominated by
spectra of grain boundaries. On the other hand, the TFY mode has a much
deeper probing depth (100 nm) than the thickness of grain
boundaries, signals from the interior of grains would
be dominant in the spectra.
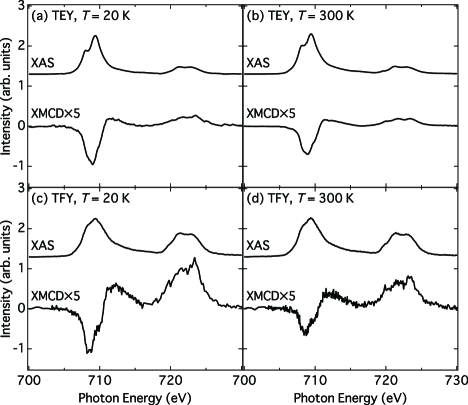
In Fig. 1, we show the XAS [] and XMCD ()
spectra at the Fe (2
3d) absorption edges normalized to the XAS peak intensity. Here, and denote the absorption coefficients
for the photon helicity parallel and antiparallel to the Fe 3
majority spin, respectively. In these spectra, the higher and lower
energy parts of the Fe peaks are expected to originate
mainly from the
Fe3+ and Fe2+ components in the ground state,
respectively. The Fe2+ signals may also originate from the
screening of the core hole for the Fe3+ ground state. If we compare the spectra
taken at 20 and 300 K, the XMCD intensity decreases with increasing
temperature by about 30 % as can be seen from Figs. 1(a) and 1(b),
which reflects the decrease of the ferromagnetic moment with
increasing temperature. The XMCD spectra taken in the bulk-sensitive TFY mode [Figs. 1(c) and 1(d)] show the same trend but the
intensity of the Fe peak relative to the peak is
lowered due to self-absorption and quantitative analysis is
hindered. Nevertheless, the TFY spectra clearly show a higher Fe2+-like
intensity than the TEY ones, indicating that the grain interior has more
Fe2+ component or stronger core-hole screening due to the higher density
of conduction electrons than the grain boundaries. In addition, the
XMCD intensity of the Fe edge in the TFY mode, which is
less affected by the self-absorption, is higher than that in the TEY
mode, indicating that the grain interior has
a larger magnetic moment than the grain boundaries. This suggests that Fe atoms inside the grains are almost fully spin polarized with insignificant amount of non-magnetic component. The XMCD
intensity in the TFY mode also decreases with increasing
temperature, corresponding to the decrease of magnetization in the
grain interior Kobayashi et al. (1998).
From now on, we focus on the grain boundary region within the TEY
probing depth, where the ferromagnetism is weaker than the interior
of the grains, in order to obtain the quantitative information about
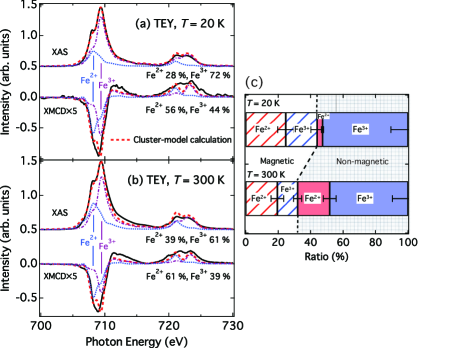
the Fe valence and magnetization. We performed line-shape
analysis of the experimental XAS and XMCD spectra by least mean
square fitting to a superposition of the Fe2+ and Fe3+
spectra calculated using the cluster model, as shown by the dotted curves in Fig. 2. Parameters used in this calculation are as
follows (in units of eV): Fe2+: , , , ; Fe3+: , , , . Figures 2(a) and
2(b) show that the Fe valence deduced from the XAS spectrum
is quite different from that deduced from the XMCD spectrum. This
indicates that the apparent valence of the ferromagnetic Fe ions is more
Fe2+-like while that of the non-magnetic Fe ones is more
Fe3+-like.
The experimental XMCD intensities are lower than those expected for fully spin-polarized Fe2+ and
Fe3+ components, indicating that part of the Fe2+ and
Fe3+ ions are in the paramagnetic or antiferromagnetic state. We
have obtained the weight of the Fe2+-like and Fe3+-like components in each of the
ferromagnetic and non-magnetic (i.e., para/antiferromagnetic) components, as shown in
Fig. 2(c). In going from 20 to 300 K, the amount of the
ferromagnetic component decreases by 12 %, in agreement with the
temperature dependence of magnetization
Kobayashi et al. (1998). Therefore, the ferromagnetic component of the grain boundary is not much different from the ferromagnetic bulk material. The amount of the Fe2+-like component
in the non-magnetic component
increases with increasing temperature,
which may partly be due to the actual increase of Fe2+ but also due to the
enhancement of screening effect related with the decrease of
the resistivity with increasing temperature
Kobayashi et al. (1998).
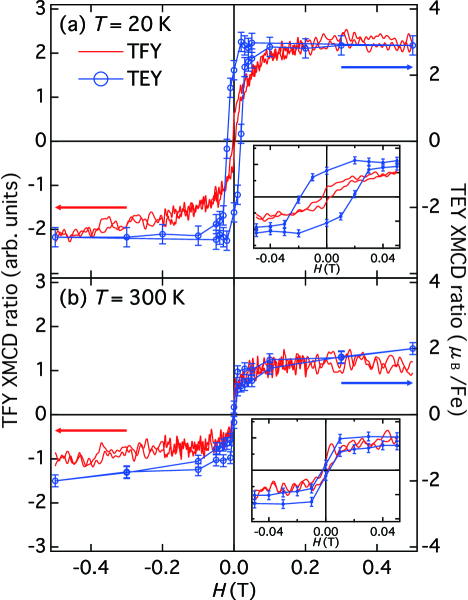
Figure 3 shows - curves obtained from the
XMCD intensity in both detection modes. Hereafter, of the hysteresis loop of the
TEY mode and that of the TFY mode are denoted by and , respectively. Figure
3(a) shows that at 20 K is 0.02 T, 6 times larger than of 0.003 T. The difference between and is similar to the different values between the magnetization and MR measurements
Sarma et al. (2007). Because TEY and TFY have the probing depths
of several nm and 100 nm, respectively, and correspond to the of grain boundaries and that of grains, respectively. This is consistent
with the scenario that SVMR is
driven by the large coercivity of the grain boundaries at low
temperatures Sarma et al. (2007). At 300 K, is reduced and becomes as small as as shown in
Fig. 3(b), resulting in the absence of coercivity difference between TEY and TFY, that is,
between the grain boundaries and the grain interior. This explains the disappearance of SVMR at
high temperatures Ray et al. (2011).
In conclusion, we have performed a detailed XAS and XMCD studies
of polycrystalline SFMO. The different magnetic hardness of the grain
boundaries and the grains were observed at 20 K as different values in the hysteresis loops recorded in the surface-sensitive TEY and
bulk-sensitive TFY modes. These results are consistent with the SVMR
mechanism proposed for the unusual MR in SFMO polycrystals. From the
line-shape analysis of the XAS and XMCD spectra, we revealed that in the
grain boundary region the Fe valence in the magnetic component is more
Fe2+-like than that in the non-magnetic component.
The authors thank S. Ray for useful discussions. This work was
supported by a Grant-in-Aid for Scientific Research, Basic Research S
(S22224005) from JSPS. YT was supported by JSPS through the Program for Leading Graduate Schools (MERIT). BP and DDs were supported by the Department of
Science and Technology, Government of India.
References
- Jonker and Santen (1950) G. Jonker and J. V. Santen, Physica 16, 337 (1950).
- Jin et al. (1994) S. Jin, T. H. Tiefel, M. McCormack, R. A. Fastnacht, R. Ramesh, and L. H. Chen, Science 264, 413 (1994).
- von Helmolt et al. (1993) R. von Helmolt, J. Wecker, B. Holzapfel, L. Schultz, and K. Samwer, Phys. Rev. Lett. 71, 2331 (1993).
- Subramanian et al. (1996) M. A. Subramanian, B. H. Toby, A. P. Ramirez, W. J. Marshall, A. W. Sleight, and G. H. Kwei, Science 273, 81 (1996).
- Hwang and Cheong (1997) H. Y. Hwang and S. W. Cheong, Nature 389, 942 (1997).
- Kobayashi et al. (1998) K. I. Kobayashi, T. Kimura, H. Sawada, K. Terakura, and Y. Tokura, Nature 395, 677 (1998).
- Tomioka et al. (2000) Y. Tomioka, T. Okuda, Y. Okimoto, R. Kumai, K.-I. Kobayashi, and Y. Tokura, Phys. Rev. B 61, 422 (2000).
- Ohno et al. (2001) H. Ohno, F. Matsukura, and Y. Ohno, Materials Science and Engineering: B 84, 70 (2001).
- Sarma et al. (2007) D. D. Sarma, S. Ray, K. Tanaka, M. Kobayashi, A. Fujimori, P. Sanyal, H. R. Krishnamurthy, and C. Dasgupta, Phys. Rev. Lett. 98, 157205 (2007).
- Ray et al. (2011) S. Ray, S. Middey, S. Jana, A. Banerjee, P. Sanyal, R. Rawat, L. Gregoratti, and D. D. Sarma, Europhys. Lett. 94, 47007 (2011).
- Note (1) This sample is similar to sample C in Ref Sarma et al. (2007). Details of the sample preparation are given in Ref Sarma et al. (2007).