Swift discovery of the orbital period of the HMXB IGR J015712–7259 in the Small Magellanic Cloud.
Abstract
Context. In the last years the hard X-ray astronomy has made a significant step forward, thanks to the monitoring of the IBIS/ISGRI telescope on board the INTEGRAL satellite and of the Burst Alert Telescope (BAT) on board of the Swift observatory. This has provided a huge amount of novel information on many classes of sources.
Aims. We have been exploiting the BAT survey data to study the variability and the spectral properties of the new high mass X-ray binary sources detected by INTEGRAL. In this letter we investigate the properties of IGR J015712–7259.
Methods. We perform timing analysis on the 88-month BAT survey data and on the XRT pointed observations of this source. We also report on the broad-band 0.2–150 keV spectral analysis.
Results. We find evidence for a modulation of the hard-X-ray emission with period d. The significance of this modulation is 6.1 standard deviations. The broad band spectrum is modeled with an absorbed power law with photon index and a steepening in the BAT energy range modeled with a cutoff at an energy of keV.
Key Words.:
X-rays: general - : data analysis - stars: neutron - X-rays: individuals: IGR J015712–72591 Introduction
Since the first years of the last decade, astronomy has been having two profitable protagonists in the hard X-ray energy band: the IBIS/ISGRI telescope (Ubertini et al., 2003; Lebrun et al., 2003) on board the INTEGRAL satellite (Winkler et al., 2003) and the Burst Alert Telescope (BAT, Barthelmy et al., 2005) on board of the Swift observatory (Gehrels et al., 2004). IBIS/ISGRI has conducted a fruitful exploration of the Galactic Plane, revealing a large number of new X-ray sources: some of them are characterized by a strongly absorbed spectrum that made them elusive to previous soft X-ray monitoring; others show very bright transient episodes and they were revealed thanks to the continuous scan of the Galactic Plane. Many of these sources have been identified as high mass X-ray binaries (HMXBs), as inferred by the discovery of their optical counterparts (e.g., Filliatre & Chaty, 2004; Reig et al., 2005; Masetti et al., 2006; Negueruela et al., 2006) and/or by the observation of long periodicities due to the occultation of the neutron star by the supergiant companion or to the enhancement of the neutron star accretion rate at periastron passage in an eccentric orbit. BAT is playing a momentous role in the study of many of these new INTEGRAL sources (e.g. Cusumano et al., 2010a; La Parola et al., 2010; D’Aì et al., 2011a, b). Thanks to a field of view two orders of magnitude larger than IBIS/ISGRI and to frequent changes of pointing direction, it efficiently records emission variability due to orbital eclipses or to the turn on of transient episodes.
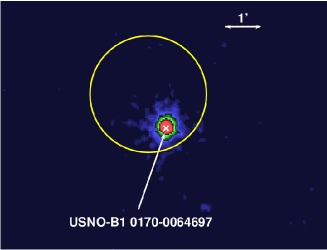
IGR J015712–7259 is an X-ray binary discovered during the INTEGRAL scan of the Small Magellanic Cloud (SMC) and of the Magellanic Bridge in December 2008. A Swift-XRT follow-up observation found the soft X-ray counterpart at RA= 01h 57m 16.4s, Dec= 58’ 33” (J2000) with an uncertainty localization of 3.8” (90% confidence level, Coe et al., 2008), and the USNO (Monet et al., 2003) star USNO-B1 0170-0064697, that lies within the XRT error box, was associated with IGR J015712–7259. The B and R magnitude of this star are 15.48 and 15.51, respectively (McBride et al., 2010). Timing analysis of the XRT and RXTE data revealed a periodicity of s (Coe et al., 2008). A broad band spectral analysis that combines the XRT and ISGRI data showed a flat power law spectrum () with an exponential cutoff with a cutoff energy of keV (McBride et al., 2010). This spectral shape is consistent with the spectrum typically shown by a HMXB.
This letter, that reports the results derived by the analysis of the soft and hard X-ray data collected by Swift on IGR J015712–7259, is organized as follows: section 2 describes the data reduction; section 3 reports on the timing analysis; in section 4 we describe the spectral analysis and in section 5 we briefly discuss our results.
2 Observations and data reduction
We have used the batimager code (developed for the analysis of coded mask telescopes data, see Segreto et al., 2010 for details) to analyze the data collected by Swift-BAT between November 2004 and March 2012 in survey mode. IGR J015712–7259 is detected in the 15–150 BAT all-sky map with a significance of standard deviations in 88 months. The light curve of IGR J015712–7259 (Fig. 1) shows that the source is in a low intensity state in the first months, rising to a higher state throughout the following months. The significance of the source in this second interval rises to standard deviation in the 15–150 keV band, and it is maximised to standard deviations in the 15–45 keV energy band. Therefore, in order to study the timing and spectral properties of the source we have used the BAT data collected after MJD 54510. The light curve with the maximum resolution achievable with the BAT survey data was extracted in the 15–45 keV energy band.

The times were corrected to the Solar System barycentre (SSB) using the task earth2sun111http://heasarc.gsfc.nasa.gov/ftools/fhelp/earth2sun.txt and the JPL DE-200 ephemeris (Standish, 1982). The background subtracted spectrum averaged over the entire survey period was extracted in eight energy channels and analyzed using the BAT redistribution matrix available in the Swift calibration database222http://swift.gsfc.nasa.gov/docs/heasarc/caldb/swift/.
Swift-XRT observed IGR J015712–7259 four times, once in December 2008 (ObsID 00031313001) and three times in October 2010, for a total exposure time of ksec. The details of each XRT observation are in Table 1. All the observations are in Photon Counting mode (Hill et al., 2004).
| Obs ID | Exposure | rate | phase | |||
|---|---|---|---|---|---|---|
| Obs # | (MJD) | (s) | (s) | c/s | ||
| 1 | 00031313001 | 54820.3171 | 1985.7 | 1950.9 | 0.15 | 0.63 |
| 2 | 00041740001 | 55474.6958 | 23255.5 | 4613.9 | 0.02 | 0.03 |
| 3 | 00041740002 | 55488.2508 | 4461.2 | 4443.4 | 0.16 | 0.41 |
| 4 | 00041740003 | 55490.1957 | 29626.6 | 4214.4 | 0.26 | 0.46 |
Data were processed with standard procedures, filtering and screening criteria (xrtpipeline v.0.12.4). Fig. 1 shows the 0.2–10 keV XRT image where the soft X-ray counterpart of IGR J015712–7259 is well within the BAT error circle (1.61 arcmin). We extracted the source events from a circular region (20 pixel radius, with 1 pixel corresponding to 2.36 arcsec) centered on the source centroid as calculated with xrtcentroid (RA=01h 57m 15.9s, Dec= 58’ 29.9”, error radius 3.6”). The source events arrival times were corrected to the SSB using the task barycorr444http://http://heasarc.gsfc.nasa.gov/ftools/caldb/help/barycorr.html. The background was extracted from an annular region with inner and outer radii 40 and 70 pixels, respectively. XRT ancillary response files were generated with xrtmkarf555http://heasarc.gsfc.nasa.gov/ftools/caldb/help/xrtmkarf.html. The source and background spectra of each observation were averaged to obtain a single spectrum, and the ancillary files were combined using addarf, weighting them by the exposure times of the relevant spectra. Both the summed spectrum and each single spectrum were rebinned with a minimum of 20 counts per energy channel, in order to allow the use of the statistics. We used the spectral redistribution matrix v013. The spectral analysis was performed using xspec v.12.5. Errors are given at 90% confidence level, if not stated otherwise.


3 Timing analysis
The light curve of IGR J015712–7259 in the 15–45 keV energy range was investigated for the presence of periodic modulations. A timing folding analysis (Leahy et al., 1983) was applied to the baricentered arrival times. This method consists in building the light curve profile at different trial periods by folding the photon arrival times in phase bins. For each trial profile the with respect to the average count rate is evaluated: a high value will signal the presence of a periodic pulsation. We searched in the 0.5–500 d period range with a step resolution of , where P is the trial period, is the number of folded profile phase bins and ( Ms) is the data time span. The average rate in each phase bin was calculated weighting the light curve rates by the inverse square of the relevant statistical error. This procedure, adopted to deal with the large span in statistical errors, is justified by the fact that the data are characterized by a large range of signal-to-noise ratio because BAT monitors the source over a wide range of off-axis directions. Figure 3a shows the resulting periodogram. We find several features emerging over the average trend. The feature at the lowest period is at d () where the period and its error are evaluated as the position of the centroid and the standard deviation obtained from a Gaussian fit of the periodogram feature. The features at higher P result to be multiples of .
The average in the periodogram increases monotonically with
the trial period deviating from what is expected for a white noise
signal, where the is expected to have an average value of .
As a consequence, we cannot apply the statistics
to evaluate the significance of the feature at and an ad hoc procedure has
to be used.
The following steps summarize what we have done to estimate the significance of
the feature:
(1) we modeled the distribution with a 2nd order polynomial to derive the average trend of the versus P.
(2) was then subtracted from the distribution to obtain a flattened periodogram (hereafter, z). This allows to evaluate the significance of the feature with respect to the average noise level of the periodogram. The value of z corresponding to is .
(3) We built the histogram of the z distribution (Figure 3b) from P=15 d to P=55 d (where the periodogram is characterized by a noise level quite consistent with the noise level ) at excluding the interval around .
(4) We modeled the positive tail () of the histogram with an exponential function.
(5) We evaluated the area () of the z histogram summing the contribution of each single bin from its left boundary up to z=5 and integrating the best-fit exponential function beyond z=5 up to infinity.
(6) We evaluated the integral of the best-fit exponential function between z=110 and infinity and normalized it dividing by .
The result () is the probability of chance occurrence to find a z value (or ) and it corresponds to a significance for the feature of standard deviations in Gaussian statistics.
In Fig. 3 (c) we show the BAT light curve folded at with a MJD. The profile is characterized by a single symmetric peak with a minimum consistent with null intensity, whose centroid, evaluated by fitting the data around the dip with a Gaussian function, is at phase corresponding to MJD (55225.2) . The peak is at phase , corresponding to MJD .
The phase corresponding to the epochs of the XRT observations and referred to the folded BAT light curve are represented in Figure 3c by vertical arrows. The rates averaged over each observation (column 6 in Table 1) show a variability in good agreement with the BAT rate profile.
In order to search for the pulsed modulation at s we have applied the folding analysis to XRT pointings 1 and 4 in Table 1 (pointings 2 and 3 have a low statistic content, with counts each). The periodogram derived from observation 1 shows a feature at s (, 7 d.o.f.), where the error is , with N=8, confirming the result reported by Coe et al. (2008). The probability of chance occurrence for a feature with such a value at 11.6 s is , corresponding to a significance of standard deviations in Gaussian statistics. The periodogram of observation 4 does not show any significant feature. We also performed a folding analysis on each of the five snapshots of observation 4, without finding any significant feature either in each single snapshot periodogram or in the periodogram produced by their sum.
4 Spectral analysis and results
The broad band spectral analysis puts together XRT data of different epochs and BAT data accumulated over the 88-month of monitoring. We therefore performed a preliminary analysis to verify that no significant spectral variability affects the 4 XRT observations and during the BAT monitoring. The background subtracted spectra of each single XRT observation were fitted simultaneously with an absorbed power law with the photon index and absorbing column density forced to have the same value for the 4 datasets. This model, yielding a best fit photon index of and N of cm-2, produced residuals with a similar trend for all the datasets. Different BAT spectra were also produced selecting the data in different time intervals (MJD intervals 53383.478–54593.061, 54593.061–55233.428, and 55233.428–56016.101; see Figure 1) and in three different phase intervals (0.94–1.31, 0.31–0.44 plus 0.69–0.81, and 0.44–0.69, see Figure 3). These spectra were fitted with a power law model and, as above, we forced the photon index to assume the same value for all the spectra leaving the normalization free to vary. The residuals between best fit model and data showed a similar trend for all the datasets. The best fit photon index is .
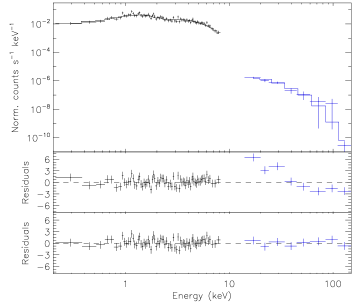
The broad band spectral analysis was then performed coupling the 15–150 keV BAT spectrum extracted from the data collected after MJD 54510 and the XRT spectrum obtained by adding the individual XRT spectra (see Sect. 2). A multiplicative factor that disengages the normalization parameter of the model for the two datasets was introduced in the fit to take into account both the intercalibration uncertainty between XRT and BAT and the non simultaneity of the data. We started fitting the data with an absorbed power law model phabs*(powerlaw). This model yields an unacceptable =149.7, with 76 degrees of freedom [dof] and is not able to describe the BAT data, as shown in Figure 4, (middle panel). The steepening in the BAT energy range (see figure 4) suggesting the presence of a cutoff. Indeed, the spectrum turned out to be much better described adopting the model phabs*cutoffpl (see table 2) with a photon index of 0.4 and an folding energy of 13 keV, resulting in a , for 75 dof. The hydrogen column density is lower than . Figure 4 shows data and best fit model (top panel) and residuals (bottom panel) for the cutoff powerlaw model.
| Parameter | Cutoff pl | Units |
|---|---|---|
| N | ||
| keV | ||
| ph at 1 keV | ||
| F (0.2–10 keV) | ||
| F (15–150 keV) | ||
| 70.1 (75 dof) |
5 Conclusions
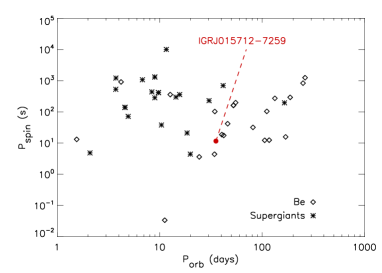
IGR J015712–7259, discovered by INTEGRAL in the SMC, is a HXMB with an X-ray emission modulated by a spin period of 11.6 s (Coe et al., 2008). The timing analysis of the BAT survey data has allowed to add a new piece of information on this binary system, with the discovery of a long term periodic modulation in its hard X-ray emission at P d. The significance of this result is standard deviations in Gaussian statistics. We interpret this modulation as the orbital period of the binary system. Its knowledge, together with the spin period measurement allows us to locate the source on the Corbet diagram (Corbet, 1986), where its position is consistent with the Be X-ray binaries region (Figure 5). On the other hand, the BAT light curve folded at Po shows a triangular symmetric peak with a minimum consistent with zero intensity suggesting that accretion happens for most of the orbit. The minimum could be related to the occultation of the neutron star by the companion star. This behavior is not typical for HXRB with a Be companion, that usually are observed through short-lived enhancements of their emission caused by accretion episodes driven either by disk instabilities or to the periastron passage in a highly eccentric orbit.
The BAT long-term light curve (Figure 1) shows that this source has enhanced its hard X-ray activity since early 2009, after showing a modest intensity level in the first three years of the survey monitoring. This behavior prevented the source from being reported in the first Palermo BAT catalogues (Cusumano et al., 2010b, c), while it is listed with a significance of standard deviations in the latest issue of the catalogue777http://bat.ifc.inaf.it (that covers 66 months of survey). The INTEGRAL detection reported by Coe et al. (2008) is located in time during the early stages of enhanced emission.
The broad-band (0.2–150 keV) spectral analysis of IGR J015712–7259 was performed combining all the available Swift-XRT observations and the BAT spectrum extracted from the data collected after MJD 54510 when the source is observed to be in a high intensity state. The data are well described by a flat () powerlaw with a cut-off at keV. This spectral shape is commonly observed among HMXBs. The best fit parameters are in agreement with the analysis reported by McBride et al. (2010) based on the December 2008 XRT observation and on the ISGRI data.
The results reported above need to be integrated with optical observations aimed at the identification of the spectral type of the companion star. This will allow to ascertain the class of this binary system and to set more constraints on its orbital characteristics.
Acknowledgements.
This work has been supported by ASI grant I/011/07/0.References
- Barthelmy et al. (2005) Barthelmy, S. D., et al. 2005, Space Science Reviews, 120, 143
- Coe et al. (2008) Coe M. J., McBride V. A., Bird A. J., Corbet R.H.D., et al., 2008, ATEL 1882
- Corbet (1986) Corbet, R. H. D. 1986, MNRAS, 220, 1047
- Cusumano et al. (2010a) Cusumano, G., La Parola, V., Romano, P., et al. 2010, MNRAS, 406, L16
- Cusumano et al. (2010b) Cusumano, G., La Parola, V., Segreto, A., et al. 2010, A&A, 524, A64
- Cusumano et al. (2010c) Cusumano, G., La Parola, V., Segreto, A., et al. 2010, A&A, 510, A48
- D’Aì et al. (2011a) D’Aì, A., Cusumano, G., La Parola, V., et al. 2011, A&A, 532, A73
- D’Aì et al. (2011b) D’Aì, A., La Parola, V., Cusumano, G., et al. 2011, A&A, 529, A30
- Filliatre & Chaty (2004) Filliatre, P., & Chaty, S. 2004, ApJ, 616, 469
- Gehrels et al. (2004) Gehrels, N., et al. 2004, ApJ, 611, 1005
- Hill et al. (2004) Hill, J. E., Burrows, D. N., Nousek, J. A., et al. 2004, Proc. SPIE, 5165, 217
- La Parola et al. (2010) La Parola, V., Cusumano, G., Romano, P., et al. 2010, MNRAS, 405, L66
- Lebrun et al. (2003) Lebrun, F., Leray, J. P., Lavocat, P., et al. 2003, A&A, 411, L141
- Leahy et al. (1983) Leahy, D. A., Darbro, W., Elsner, R. F., et al. 1983, ApJ, 266, 160
- Masetti et al. (2006) Masetti, N., Morelli, L., Palazzi, E., et al. 2006, A&A, 459, 21
- McBride et al. (2010) McBride, V. A., Bird, A. J., Coe, M. J., et al. 2010, MNRAS, 403, 709
- Monet et al. (2003) Monet, D. G., Levine, S. E., Canzian, B., et al. 2003, AJ, 125, 984
- Negueruela et al. (2006) Negueruela, I., Smith, D. M., Reig, P., Chaty, S., & Torrejón, J. M. 2006, The X-ray Universe 2005, ed. A. Wilson, ESA Special Publication, 604, 165
- Reig et al. (2005) Reig, P., Negueruela, I., Papamastorakis, G., Manousakis, A., & Kougentakis, T. 2005, A&A, 440, 637
- Segreto et al. (2010) Segreto, A., Cusumano, G., Ferrigno, C., La Parola, V., Mangano, V., Mineo, T., & Romano, P. 2010, A&A, 510, A47
- Standish (1982) Standish, E. M., Jr. 1982, A&A, 114, 297
- Ubertini et al. (2003) Ubertini, P., Lebrun, F., Di Cocco, G., et al. 2003, A&A, 411, L131
- Winkler et al. (2003) Winkler, C., Courvoisier, T. J.-L., Di Cocco, G., et al. 2003, A&A, 411, L1