Distances to Dwarf Galaxies of the Canes Venatici I Cloud
Abstract
We determined the spatial structure of the scattered concentration of galaxies in the Canes Venatici constellation. We redefined the distances for 30 galaxies of this region using the deep images from the Hubble Space Telescope archive with the WFPC2 and ACS cameras. We carried out a high-precision stellar photometry of the resolved stars in these galaxies, and determined the photometric distances by the tip of the red giant branch (TRGB) using an advanced technique and modern calibrations. High accuracy of the results allows us to distinguish the zone of chaotic motions around the center of the system. A group of galaxies around M 94 is characterized by the median velocity km/s, distance Mpc, internal velocity dispersion km/s and total luminosity . The projection mass of the system amounts to , which corresponds to the mass–luminosity ratio of . The estimate of the mass–luminosity ratio is significantly higher than the typical ratio for the nearby groups of galaxies. The CVn I cloud of galaxies contains 4–5 times less luminous matter compared with the well-known nearby groups, like the Local Group, M 81 and Centaurus A. The central galaxy M 94 is at least fainter than any other central galaxy of these groups. However, the concentration of galaxies in the Canes Venatici may have a comparable total mass.
I INTRODUCTION
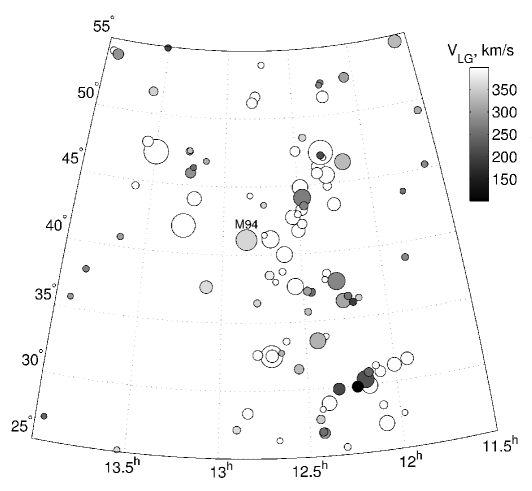
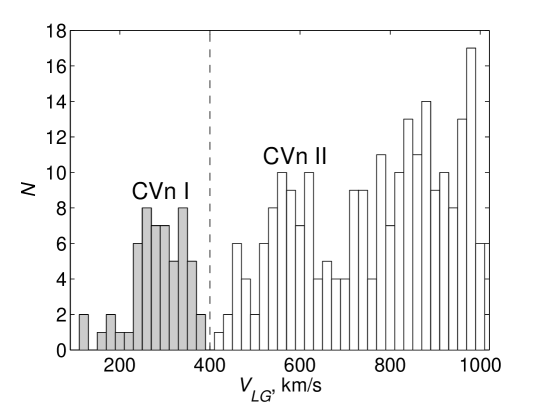
The distribution of nearby galaxies of the Local Volume in the sky reveals a significant concentration of objects in a small region located in the Canes Venatici constellation (Fig. 1). This feature has been noted by Karachentsev (1966) and de Vaucouleurs (1975) karachentsev1966:Makarov_n ; vaucouleurs1975:Makarov_n . This complex is mostly populated by dwarf galaxies of late morphological types. Two peaks are distinguished in the distribution of the line-of-sight velocities of galaxies in the sky region , (Fig. 2). The first peak located around km/s corresponds to the CVn I cloud, while the CVn II concentration has an average velocity of about 560 km/s. The Canes Venatici I cloud clearly differs from the other nearby galaxy clusters, such as the Local Group, M 81 or the groups in the Centaurus by the absence of a clearly prominent gravitational center and looks diffuse. The concentration of galaxies in the Canes Venatici constellation has repeatedly attracted the attention of researchers. In the series of papers makarova+1997:Makarov_n ; tikhonov+1998:Makarov_n ; makarova+1998:Makarov_n ; karachentsev+1998:Makarov_n the structure of the complex was studied by the photometry of the brightest blue stars in these galaxies. The use of the Hubble Space Telescope (HST) has significantly improved the distance accuracy and allowed to study the kinematics of the CVn I cloud of galaxies karachentsev+2003:Makarov_n . A blind survey of the sky in neutral hydrogen HIsurvey2009:Makarov_n was recently conducted in the region of nearby groups of galaxies in the Canes Venatici in order to study the functions of the H I-masses in dwarf galaxies. Only one object from this survey has no optical identification. In addition, Kaisin and Karachentsev Hasurvey2008:Makarov_n have investigated the current star formation of galaxies in the Canes Venatici according to the H survey data. The authors did not find any significant correlations between the star formation rates (SFR) in the galaxies and their neighborhood.
A rapid progress in the deep observations of the Canes Venatici galaxies, performed at the HST/ACS and HST/WFPC2, as well as a significant improvement of distance measurement by the tip of the red giant branch (TRGB) method allow us to refine the structure of this unusual concentration of galaxies. In this paper, we determined the distances for 30 galaxies of the CVn I cloud, using the optimized TRGB method TRGB1:Makarov_n and new zero point calibration TRGB2:Makarov_n .
II STELLAR PHOTOMETRY OF GALAXIES IN THE CANES VENATICI I CLOUD
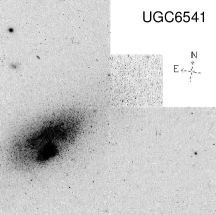
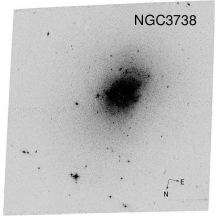
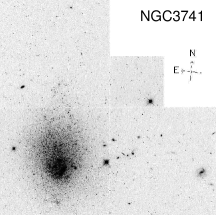
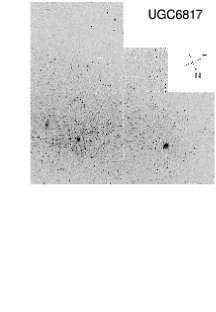
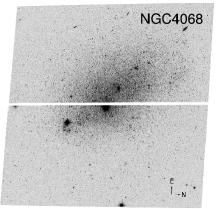
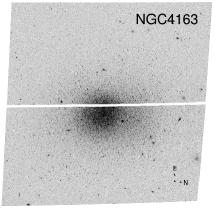
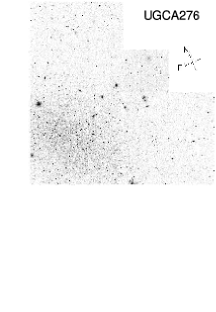
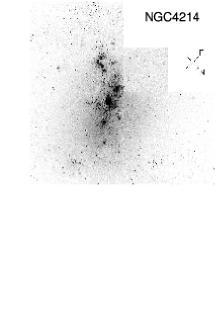
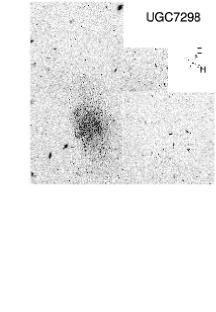
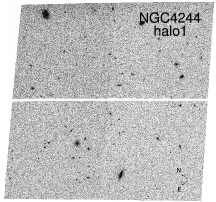
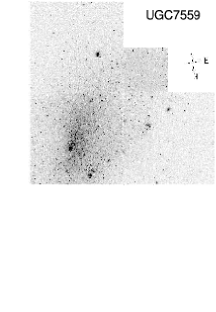
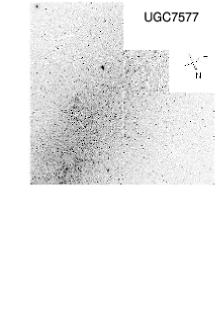
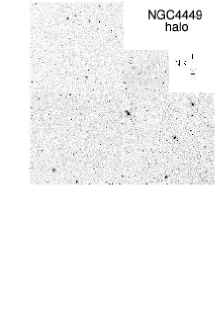
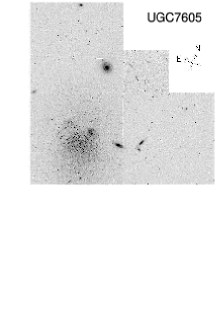
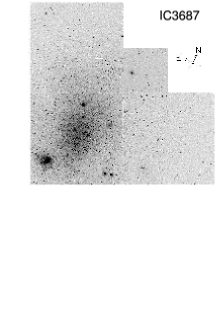
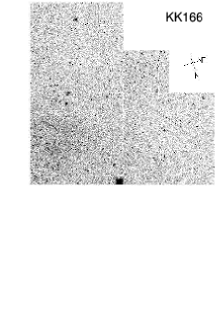
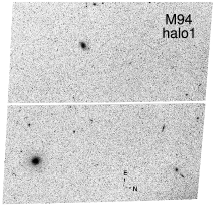
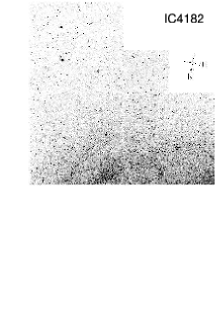
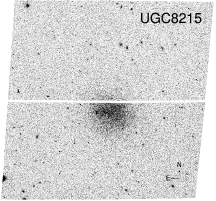
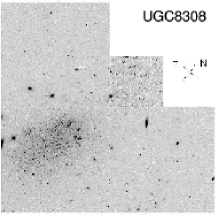
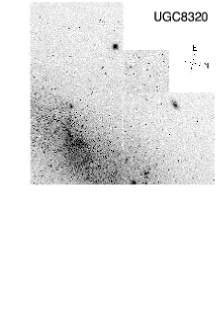
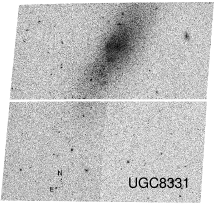
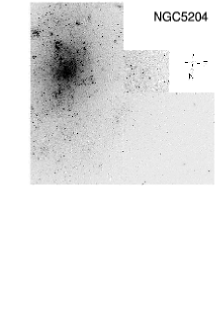
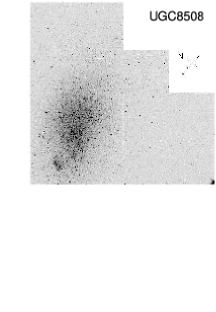
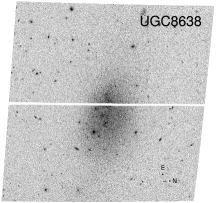
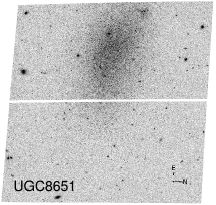
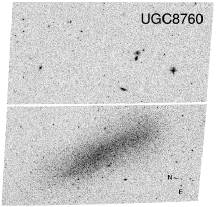
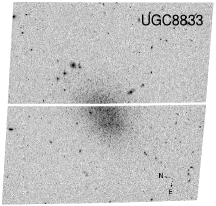
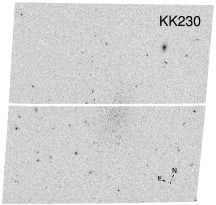
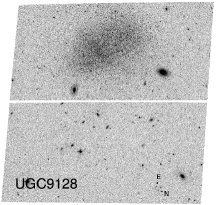
The sample of galaxies from the Canes Venatici complex is presented in Table 1. Direct images of the galaxies obtained with the ACS/HST and WFPC2/HST were taken from the archive of the Hubble Space Telescope. The images of all the galaxies were obtained in the F606W and F814W filters, with the exception of NGC 4214, which was observed in F555W and F814W. Standard initial reduction of images is done “on the fly.” Thus, the user gets the images with subtracted dark frames, flat field-corrected, and accounted for the presence of “bad” rows and some “hot”/“cold” pixels. The images of the studied galaxies are demonstrated in Fig. 3.
| Name | RA (J2000) Dec | Camera | Proposal | Filters | , s | |
|---|---|---|---|---|---|---|
| UGC 6541 | 113328.9491418 | WFPC2 | 8601 | F814W/F606W | 600/ | 600 |
| NGC 3738 | 113548.6543122 | ACS/WFC | 12546 | F814W/F606W | 450/ | 450 |
| NGC 3741 | 113606.0451708 | WFPC2 | 8601 | F814W/F606W | 600/ | 600 |
| UGC 6817 | 115052.9385251 | WFPC2 | 8601 | F814W/F606W | 600/ | 600 |
| NGC 4068 | 120401.9523519 | ACS/WFC | 9771 | F814W/F606W | 900/ | 1200 |
| NGC 4163 | 121209.2361010 | ACS/WFC | 9771 | F814W/F606W | 900/ | 1200 |
| UGCA 276 | 121458.1361306 | WFPC2 | 8601 | F814W/F606W | 600/ | 600 |
| NGC 4214 | 121539.2361939 | WFPC2 | 6569 | F814W/F555W | 1300/ | 1300 |
| UGC 7298 | 121630.1521340 | WFPC2 | 8601 | F814W/F606W | 600/ | 600 |
| NGC 4244 | 121729.5374826 | ACS/WFC | 10523 | F814W/F606W | 735/ | 735 |
| UGC 7559 | 122705.0370836 | WFPC2 | 8601 | F814W/F606W | 600/ | 600 |
| UGC 7577 | 122741.7432939 | WFPC2 | 8601 | F814W/F606W | 600/ | 600 |
| NGC 4449 | 122811.0440535 | WFPC2 | 5971 | F814W/F606W | 1400/ | 1400 |
| UGC 7605 | 122838.7354304 | WFPC2 | 8601 | F814W/F606W | 600/ | 600 |
| IC 3687 | 124215.1383010 | WFPC2 | 8601 | F814W/F606W | 600/ | 600 |
| KK 166 | 124913.1353646 | WFPC2 | 8601 | F814W/F606W | 600/ | 600 |
| M 94 | 125053.0410712 | ACS/WFC | 10523 | F814W/F606W | 730/ | 730 |
| IC 4182 | 130549.6373618 | WFPC2 | 8584 | F814W/F606W | 2600/ | 2600 |
| UGC 8215 | 130803.6464941 | ACS/WFC | 9771 | F814W/F606W | 900/ | 1200 |
| UGC 8308 | 131322.7461913 | WFPC2 | 8601 | F814W/F606W | 600/ | 600 |
| UGC 8320 | 131428.2455511 | WFPC2 | 8601 | F814W/F606W | 600/ | 600 |
| UGC 8331 | 131529.8472959 | ACS/WFC | 10905 | F814W/F606W | 1148/ | 938 |
| NGC 5204 | 132936.5582510 | WFPC2 | 8601 | F814W/F606W | 600/ | 600 |
| UGC 8508 | 133044.4545441 | WFPC2 | 8601 | F814W/F606W | 600/ | 600 |
| UGC 8638 | 133919.6244631 | ACS/WFC | 9771 | F814W/F606W | 900/ | 1200 |
| UGC 8651 | 133953.8404421 | ACS/WFC | 10210 | F814W/F606W | 1209/ | 1016 |
| UGC 8760 | 135051.2380116 | ACS/WFC | 10210 | F814W/F606W | 1189/ | 998 |
| UGC 8833 | 135448.5355016 | ACS/WFC | 10210 | F814W/F606W | 1189/ | 998 |
| KK 230 | 140710.4350340 | ACS/WFC | 9771 | F814W/F606W | 900/ | 1200 |
| UGC 9128 | 141556.5230320 | ACS/WFC | 10210 | F814W/F606W | 1174/ | 985 |
The photometry of resolved stars in the galaxies was performed using the HSTphot dolphin00:Makarov_n and DOLPHOT dolphin02:Makarov_n specialized software packages, developed for the PSF photometry in a crowded stellar field obtained with the WFPC2/HST and ACS/HST. The procedures of photometric reduction included masking the “bad” columns and pixels, removing the traces of cosmic ray particles from the images, and the simultaneous PSF photometry of the detected stars in two filters using the recommended parameters dolphin00:Makarov_n ; dolphin02:Makarov_n . Only the stars with photometry satisfying a number of quality criteria were used for the further measurements and analysis. Specifically, we selected the stars with the signal-to-noise ratio of in both filters, and .
During the photometry, we paid special attention to the photometric errors. Since the quality of measurements in the crowded star fields is severely affected by the presence of close neighbors, we ran artificial star tests. We created a large library of artificial stars for each galaxy, the color–magnitude distribution of which would correspond to the actual one. Exactly the same photometry procedures were applied to these artificial stars in the galaxy images, as did the real stars. This time consuming process is the best way to estimate the real photometric errors, accounting for the incompleteness of photometry, very close neighbors, and superimposed stars.
| Name | ,∗ | ,∗∗ | , | TRGB, | Color, | , | , | , | , | , | Ref | |
| mag | km/s | mag | mag | mag | mag | Mpc | km/s | mag | mag | |||
| UGC 6541 | 14.44 | 0.019 | 303 | 0.00 | b, A | |||||||
| NGC 3738 | 11.87 | 0.010 | 306 | 0.02 | b, D | |||||||
| NGC 3741 | 14.40 | 0.025 | 263 | 0.00 | b, A | |||||||
| UGC 6817 | 13.70 | 0.026 | 257 | 0.00 | a, A | |||||||
| NGC 4068 | 13.19 | 0.022 | 281 | 0.00 | a, C | |||||||
| NGC 4163 | 13.63 | 0.020 | 163 | 0.00 | a, H | |||||||
| UGC A276 | 15.86 | 0.020 | 288 | 0.00 | g, E | |||||||
| NGC 4214 | 10.24 | 0.022 | 295 | 0.01 | c, F | |||||||
| UGC 7298 | 15.95 | 0.023 | 256 | 0.00 | a, A | |||||||
| NGC 4244 | 10.88 | 0.021 | 260 | 0.68 | c, B | |||||||
| UGC 7559 | 14.12 | 0.014 | 230 | 0.00 | d, B | |||||||
| UGC 7577 | 12.95 | 0.020 | 251 | 0.00 | a, A | |||||||
| NGC 4449 | 10.06 | 0.019 | 250 | 0.07 | a, B | |||||||
| UGC 7605 | 14.76 | 0.014 | 317 | 0.00 | d, A | |||||||
| IC 3687 | 13.79 | 0.020 | 377 | 0.00 | a, B | |||||||
| KK 166 | 17.62 | 0.015 | 0.00 | f | ||||||||
| M 94 | 8.74 | 0.018 | 352 | 0.14 | f, C | |||||||
| IC 4182 | 12.02 | 0.014 | 357 | 0.00 | a, G | |||||||
| UGC 8215 | 16.03 | 0.011 | 303 | 0.00 | h, A | |||||||
| UGC 8308 | 15.45 | 0.010 | 230 | 0.00 | a, A | |||||||
| UGC 8320 | 12.97 | 0.015 | 270 | 0.00 | a, D | |||||||
| UGC 8331 | 14.46 | 0.009 | 348 | 0.00 | a, H | |||||||
| NGC 5204 | 11.73 | 0.013 | 339 | 0.11 | c, C | |||||||
| UGC 8508 | 14.12 | 0.015 | 181 | 0.00 | a, A | |||||||
| UGC 8638 | 14.44 | 0.013 | 275 | 0.00 | d, A | |||||||
| UGC 8651 | 14.22 | 0.006 | 284 | 0.00 | e, A | |||||||
| UGC 8760 | 14.47 | 0.016 | 254 | 0.00 | e, A | |||||||
| UGC 8833 | 15.30 | 0.012 | 280 | 0.00 | e, A | |||||||
| KK 230 | 17.50 | 0.014 | 127 | 0.00 | i, A | |||||||
| UGC 9128 | 14.38 | 0.023 | 180 | 0.00 | d, A | |||||||
| Notes: * Links for photometry: aMakarova, 1999 makarova1999:Makarov_n ; bTaylor et al.,2005 taylor2005:Makarov_n ; cVaucouleurs et al., 1991 rc3:Makarov_n ; dMakarova et al., 1998 makarova+1998:Makarov_n ; eMakarova et al., 2009 makarova+2009:Makarov_n ; fKarachentsev et al., 2004 cng:Makarov_n ; gJerjen et al., 2001 jerjen2001:Makarov_n ; hBremnes et al., 1999 bremnes1999:Makarov_n ; iKarachentsev et al., 2013 (in press). ** Links for the line-of-sight velocity measurements: ABegum et al., 2008 begum2008:Makarov_n ; BKovač et al., 2009 kovac2009:Makarov_n ; CSpringob et al., 2005 springob2005:Makarov_n ; DStil and Israel, 2002 stil2002:Makarov_n ; EHuchtmeier and Richter, 1986 huchtmeier1986:Makarov_n ; FHuchtmeier and Seiradakis, 1985 huchtmeier1985:Makarov_n ; GTifft and Cocke, 1988 tifft1988:Makarov_n ; HSimpson and Gottesman, 2000 simpson2000:Makarov_n . *** TRGB location, measured in the F814WTRGB filter. **** For virtually all cases we mean the value of (F814W–F606W)TRGB, with the exception of the NGC4214 galaxy, for which the color (F814W–F555W)TRGB was used. | ||||||||||||
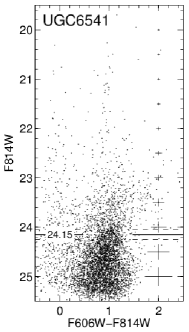
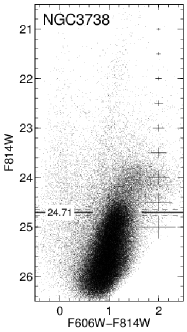
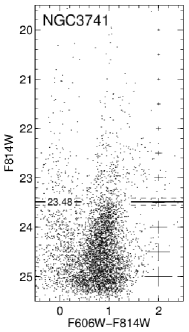
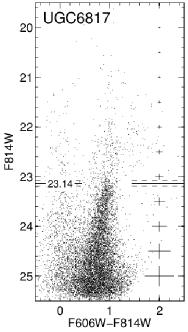
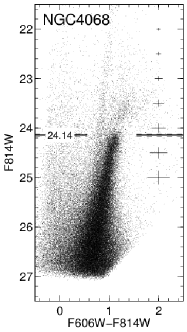
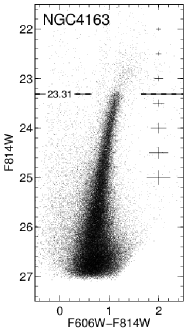
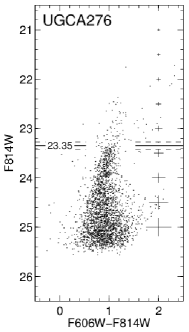
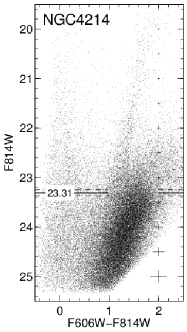
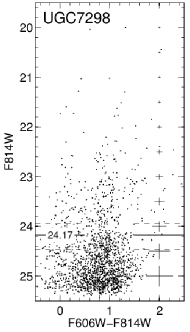
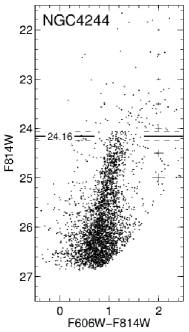
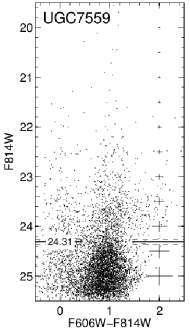
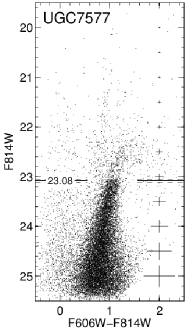
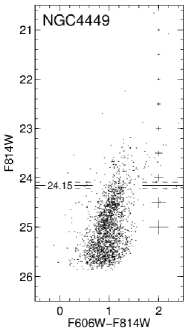
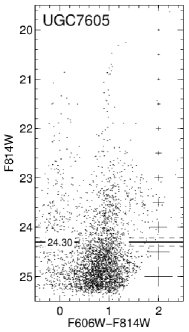
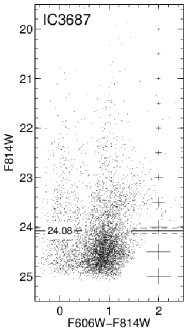
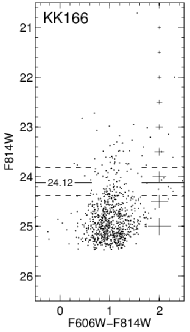
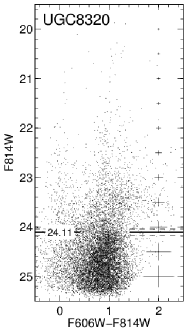
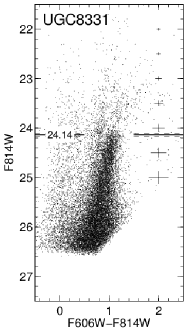
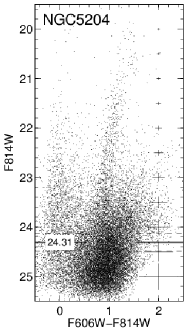
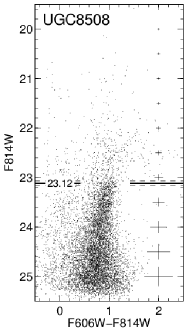
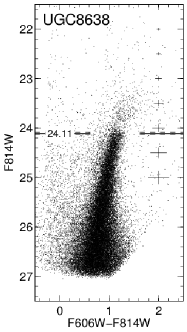
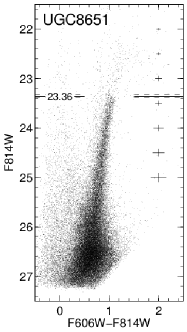
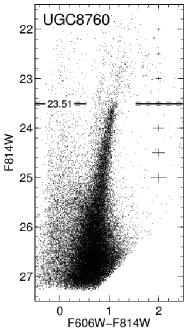
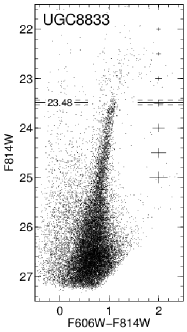
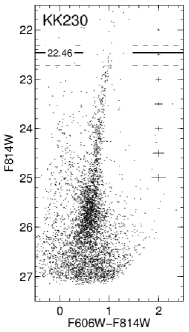
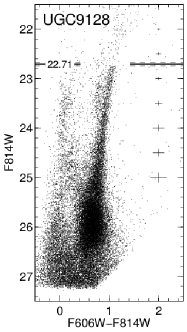
III COLOR–MAGNITUDE DIAGRAMS
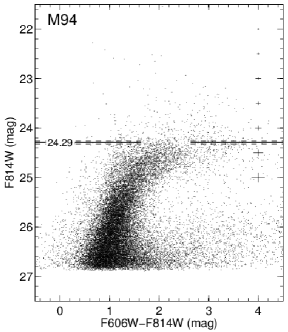
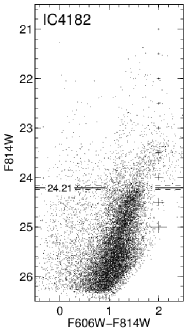
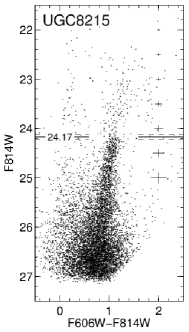
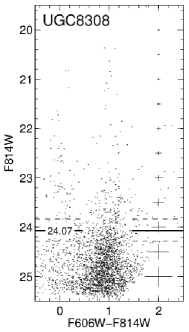
The color–magnitude diagrams (CMD) of stars from the studied galaxies are shown in Fig. 4. Irregular dwarf galaxies constitute the vast majority of objects in our sample. The upper part of the Main Sequence is clearly discernible in all the diagrams, it contains blue stars with the mean color index close to zero. The top right part of the CMD is occupied by red supergiants and the stars of the asymptotic giant branch (AGB), both these branches are populated differently for various galaxies. The largest population in each diagram is the RGB stars. We have selected from the Hubble archive only those exposures which are deep enough to safely identify the RGB in the galaxy, and therefore, determine its distance with a good accuracy by the TRGB method.
IV FINDING THE DISTANCES
To accurately determine the structure of the cloud of galaxies in the Canes Venatici constellation, we need to know the precise photometric distances to these galaxies, uniformly estimated. The distance estimates to many galaxies of the cloud were performed earlier, using the tip of the red giant branch method as one of the most accurate distance indicators. However, a uniform estimation of such distances is fulfilled for the first time. Moreover, an important factor for refining the distances is to improve the method itself, which was done by authors. In order to determine the TRGB values, we used our TRGBTOOL code, based on the maximum likelihood algorithm for the luminosity function of stars in a galaxy, and taking into account accurate photometric errors, determined from artificial star tests TRGB1:Makarov_n . The calibration of the TRGB method has been recently improved TRGB2:Makarov_n . In that study, the color index–absolute TRGB magnitude dependence, as well as the zero-points of ACS and WFPS2 photometric systems were determined. The position of the luminosity function cut-off and the corresponding 1 error are shown in the CMDs of the studied galaxies by horizontal lines (Fig. 4).
New photometric distances to the galaxies of the Canes Venatici I cloud are summarized in Table 2. It lists: (1) the name of the galaxy in the known catalogs; (2) total apparent magnitude in the -band; (3) heliocentric velocity ; (4) color excess in the direction of the galaxy according to SFD98:Makarov_n ; (5) TRGB position, determined using the TRGBTOOL; (6) the averaged color ()TRGB of stars in the TRGB region (for the NGC 4214 galaxy, we used the F555W filter instead of F606W); (7) is the measured distance modulus of the galaxy in mag; (8) is the corresponding photometric distance in Mpc; (9) the line-of-sight velocity relative to the centroid of the Local Group , according to apex1996:Makarov_n ; (10) is the internal absorption in the galaxy in the -filter, according to UNGC:Makarov_n ; (11) is the absolute stellar B-magnitude of the galaxy; (12) references to the photometry and line-of-sight velocities of galaxies. The total apparent magnitude of the galaxy, TRGB and the average color of RGB stars in the cut-off region was not corrected for galactic extinction. Note that these measurements are part of a much broader program of uniform distance measurements to the nearby, mostly dwarf galaxies via the TRGB method using TRGBTOOL jacobs:Makarov_n .111http://edd.ifa.hawaii.edu/
IV.1 Distance to M 94
M 94 is a giant spiral galaxy, which is located within the CVn I cloud and could be claimed as its gravitating center. Thus, it is very important to estimate the exact photometric distance to this object. M 94 was resolved into individual stars for the first time in the course of our SNAPshot observations with the HST/WFPC2 (Prop. 8601). The distance modulus, estimated from the tip of the red giant branch based on the results of photometry of the images is karachentsev+2003:Makarov_n . However, the exposures with WFPC2 (-s in the F606W filter and -s in the F814W filter) yield a sufficiently dense stellar field, while the tip of the red giant branch is located only above the photometric limit. The estimate of the photometric distance in giant galaxies encounters a number of technical difficulties due to the presence of internal absorption and high surface brightness. We have determined the distance to M 94, using deeper exposures, obtained with the HST/ACS (Prop. 10,523). Three fields of M 94, located far from the center of the galaxy, were observed within this project, and hence the effect of the above-mentioned difficulties is minimized.
The luminosity function of RGB stars in the M 94 galaxy appears to be much more complex than that for the normal dwarf galaxies. It has a long, extended plateau near the cut-off. This is probably related with the complex history of star formation and metal enrichment in M 94. This behavior of the luminosity function differs from a simple power law, which usually describes the red giant branch, therefore making it impossible to use the maximum likelihood technique for determining the TRGB in the M 94 galaxy. We have thus used the classical edge detection technique, described by Sakai et al. SMF1996:Makarov_n and the same up-to-date TRGB method calibrations TRGB2:Makarov_n as for the other galaxies.
Our measurements give the distance modulus of and the distance to the giant spiral M 94 Mpc. This value has a better accuracy and is in a good agreement both with the earlier estimate and with the estimates made by Radburn-Smith et al. radburn-smith:Makarov_n from the same images. The latest work gives a distance modulus amounting to .
IV.2 Distance to NGC 5204
Active star formation is underway in the center of the NGC 5204 galaxy. It is extremely difficult to determine the distance to the galaxy because of a dense stellar field, a large number of young stars and the proximity of the TRGB to the photometric limit (about ). To get rid of “contamination” of the diagram by a large number of young stars, and to avoid the excessive influence of the nearby stellar fields on the photometry results, we have selected only the stars, located far from the star forming regions. This approach has allowed us to increase the contrast of the red giant branch and determine the position of its cut-off. As in the case M 94, we used the edge detection method. The measured distance modulus to the NGC 5204 galaxy is , which is in excellent agreement with the estimate , obtained in karachentsev+2003:Makarov_n based on the same data.
V DISCUSSION AND CONCLUSIONS
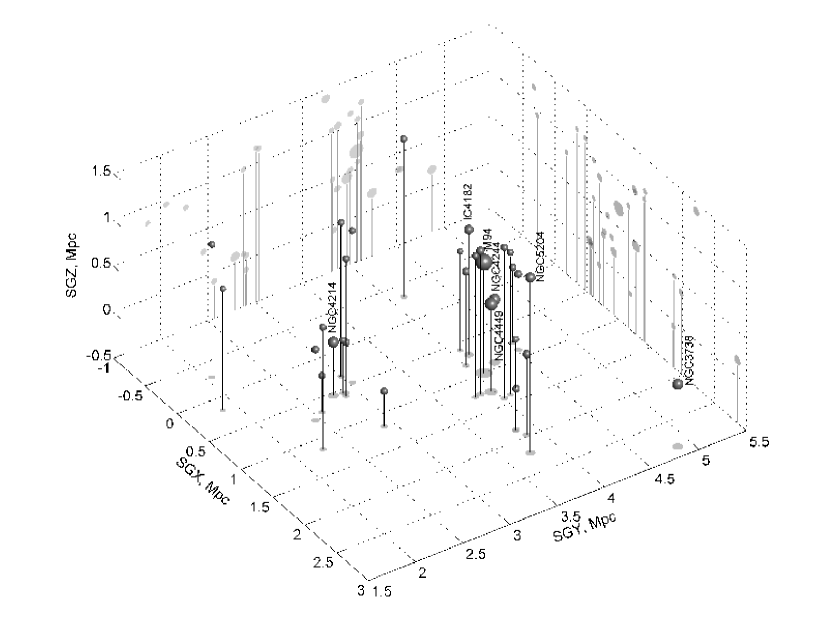
Figure 5 demonstrates the spatial distribution of galaxies, obtained from our distance measurements in supergalactic coordinates. The sphere size is proportional to the logarithm of the galaxy luminosity. The concentration of galaxies around M 94, the brightest member of the CVn I, is clearly visible here.
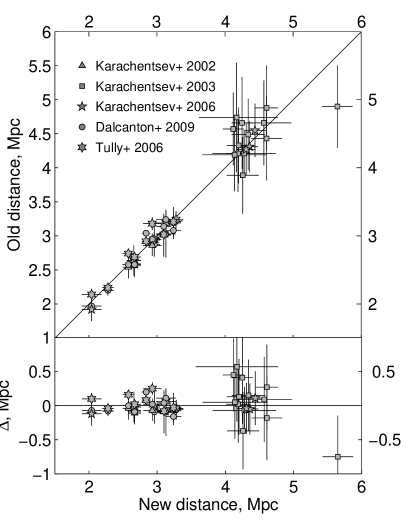
A comparison of our distance estimates with the measurements by other authors karachentsev+2002:Makarov_n ; karachentsev+2003:Makarov_n ; karachentsev+2006:Makarov_n ; tully+2006:Makarov_n ; dalcanton+2009:Makarov_n shows a very good agreement with a generally better accuracy (Fig. 6). The increased measurement accuracy is due both to the deeper observations of the same galaxies, carried out at a later time, and the use of a more refined technique of distance estimation.
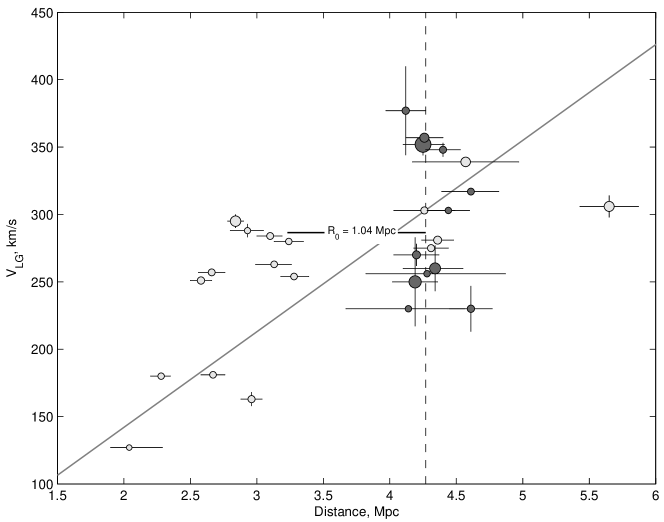
The Hubble diagram of the recession of galaxies in the direction of the Canes Venatici is shown in Fig. 7. Note that in the previous study of the structure of this cloud of galaxies, this region looks much more “fuzzy” (Fig. 6 in karachentsev+2003:Makarov_n ), which did not allow to make a conclusion on the virialized state of this group of galaxies. The higher quality of observations allows us to identify an area of chaotic motions around the center of the system. The group of galaxies around M 94 is characterized by a median velocity of km/s, median distance of Mpc, the line-of-sight-velocity dispersion of km/s, corrected for the measurement errors, the mean projected distance from the galactic center of the system of kpc, and the total luminosity of . The mass of the system, estimated by the virial theorem amounts to , which corresponds to the mass–luminosity ratio of . The projection mass estimate HTB1985:Makarov_n of this system is and the corresponding mass–luminosity ratio amounts to . Note, however, that the crossing time of the CVn I cloud of galaxies, Gyr makes up about half the age of the Universe Gyr. Therefore, the issue of the system’s proximity to the steady state requires further consideration, and one should use the virial theorem to estimate the mass of the system with caution.
As noted in karachentsev+2003:Makarov_n , almost all the galaxies, located closer than the central concentration CVn I have positive peculiar velocities and form the characteristic “wave,” caused by the infall of matter onto the massive clusters of galaxies (see, e.g., KKMT2009:Makarov_n ). Unfortunately, the current data on the distances of galaxies, located behind the studied CVn I cloud, does not allow to unambiguously claim that there is a similar infall of matter on the opposite side of the group, although some hints imply this. According to our data, only the NGC 3738 galaxy has a fairly deep CMD to measure the distance of 5.65 Mpc. Apparently, this galaxy “falls” onto the CVn I cloud from the opposite side and has a large negative peculiar velocity of km/s. If we suppose that the observed distribution of galaxies on the Hubble diagram at the distances of less than 3.5 Mpc is due to the gravitational effect of the group of galaxies around M 94, we can estimate the radius of the zero velocity sphere Mpc as the mean between the forward and reverse regressions of the velocity and distance of galaxies. It corresponds to the mass (formula from KKMT2009:Makarov_n ). This value is in a good agreement with the projection mass estimate. The analysis of peculiar velocities of field galaxies is independent of the virial theorem by the system mass measurement method. A more accurate mass estimate of the CVn I cloud should include a simulation of the distribution of galaxies by peculiar velocities and their spatial distribution.
Our mass–luminosity estimate, for the CVn I cloud of galaxies greatly exceeds the typical ratio for the nearby groups of galaxies, such as the Local Group () and M 81 group () karachentsev2005:Makarov_n . Note that compared with the well-known nearby groups, such as the Local Group (), M 81 ( ) and Centaurus A ( ), the CVn I cloud of galaxies ( ) contains about 4–5 times less luminous matter, and M 94 is at least fainter than any other central galaxy of these groups karachentsev2005:Makarov_n . However, the concentration of galaxies in the Canes Venatici may have a comparable total mass.
The catalog of groups of galaxies in the Local Supercluster MK2011:Makarov_n has demonstrated that the mean density of gravitating matter on the scale of 80 Mpc is about 2.5 times smaller than the cosmological constant . One possible explanation for this striking difference between the global and local estimates of density of the Universe can be the presence of a significant proportion of dark matter outside the virialized regions associated with luminous matter. Such “dark aggregates” can be quite numerous. For example, Tully et al. tully+2006:Makarov_n have identified the associations of nearby dwarf galaxies by the high-precision photometric distances obtained by the Hubble Space Telescope. Moreover, it was noted in this paper that on the scale of up to 3 Mpc, with the exception of the KKR 25 galaxy, all the known galaxies are either combined in groups, or associations. Such rarefied structures may possess the mass–luminosity ratios in the range from 100 to 1000 . It was shown in MU2012:Makarov_n that the groups consisting of dwarf galaxies only may be numerous, and they have higher mass–luminosity ratios than the typical galaxy groups in the Local Supercluster. It is possible that the cloud of galaxies in the Canes Venatici is in fact one of these concentrations of dark matter, where the ratio of dark to luminous matter significantly exceeds a similar proportion in the typical groups of galaxies.
Acknowledgements.
The authors thank prof. I. D. Karachentsev for constructive discussions. This work was supported by the RFBR grant no. 11-02-00639 and the grant of the Ministry of Education and Science of the Russian Federation no. 8523. The study was also supported by the program of the Physical Sciences Division RAS PSD-17 “Active Processes in Galactic and Extragalactic Objects.” We made use of the HyperLEDA database (http://leda.univ-lyon1.fr).References
- (1) I. D. Karachentsev, Astrophysics 2, 39 (1966).
- (2) G. de Vaucouleurs, Nearby Groups of Galaxies (University of Chicago Press, Chicago, 1975), p. 557.
- (3) L. N. Makarova, I. D. Karachentsev, and T. B. Georgiev, Astron. Lett. 23, 378 (1997).
- (4) N. A. Tikhonov and I. D. Karachentsev, A&AS 128, 325 (1998).
- (5) L. Makarova, I. Karachentsev, L. O. Takalo, et al., A&AS 128, 459 (1998).
- (6) I. D. Karachentsev and I. O. Drozdovsky, A&AS 131, 1 (1998).
- (7) I. D. Karachentsev, M. E. Sharina, A. E. Dolphin, et al., A&A 398, 467 (2003).
- (8) K. Kovač, T. A. Oosterloo, and J. M. van der Hulst, MNRAS 400, 743 (2009).
- (9) S. S. Kaisin and I. D. Karachentsev, A&A 479, 603 (2008).
- (10) D. Makarov, L. Makarova, L. Rizzi, et al., AJ 132, 2729 (2006).
- (11) L. Rizzi, R. B. Tully, D. Makarov, et al., Astrophys. J. 661, 815 (2007).
- (12) L. Makarova, A&AS 139, 491 (1999).
- (13) V. A. Taylor, R. A. Jansen, R. A. Windhorst, et al., Astrophys. J. 630, 784 (2005).
- (14) G. de Vaucouleurs, A. de Vaucouleurs, H. G. Corwin, et al., VizieR Online Data Catalog 7155, 0 (1995).
- (15) L. Makarova, I. Karachentsev, L. Rizzi, et al., MNRAS 397, 1672 (2009).
- (16) I. D. Karachentsev, V. E. Karachentseva, W. K. Huchtmeier, and D. I. Makarov, AJ 127, 2031 (2004).
- (17) H. Jerjen, R. Rekola, L. Takalo, et al., A&A 380, 90 (2001).
- (18) T. Bremnes, B. Binggeli, and P. Prugniel, A&AS 137, 337 (1999).
- (19) A. Begum, J. N. Chengalur, I. D. Karachentsev, et al., MNRAS 386, 1667 (2008).
- (20) K. Kovač, T. A. Oosterloo, and J. M. van der Hulst, MNRAS 400, 743 (2009).
- (21) C. M. Springob, M. P. Haynes, R. Giovanelli, and B. R. Kent, ApJS 160, 149 (2005).
- (22) J. M. Stil and F. P. Israel, A&A 389, 29 (2002).
- (23) W. K. Huchtmeier and O. G. Richter, A&AS 63, 323 (1986).
- (24) W. K. Huchtmeier and J. H. Seiradakis, A&A 143, 216 (1985).
- (25) W. G. Tifft and W. J. Cocke, ApJS 67, 1 (1988).
- (26) C. E. Simpson and S. T. Gottesman, AJ 120, 2975 (2000).
- (27) A. E. Dolphin, PASP 112, 1383 (2000).
- (28) A. E. Dolphin, MNRAS 332, 91 (2002).
- (29) D. J. Schlegel, D. P. Finkbeiner, and M. Davis, Astrophys. J. 500, 525 (1998).
- (30) I. D. Karachentsev and D. A. Makarov, AJ 111, 794 (1996).
- (31) I. D. Karachentsev, D. I. Makarov, and E. I. Kaisina, AJ , 2013 (in press).
- (32) B. A. Jacobs, L. Rizzi, R. B. Tully, et al., AJ 138, 332 (2009).
- (33) S. Sakai, B. F. Madore, and W. L. Freedman, Astrophys. J. 461, 713 (1996).
- (34) D. J. Radburn-Smith, R. S. de Jong, A. C. Seth, et al., ApJS 195, 18 (2011).
- (35) I. D. Karachentsev, M. E. Sharina, D. I. Makarov, et al., A&A 389, 812 (2002).
- (36) I. D. Karachentsev, A. Dolphin, R. B. Tully, et al., AJ 131, 1361 (2006).
- (37) R. B. Tully, L. Rizzi, A. E. Dolphin, et al., AJ 132, 729 (2006).
- (38) J. J. Dalcanton, B. F. Williams, A. C. Seth, et al., ApJS 183, 67 (2009).
- (39) J. Heisler, S. Tremaine, and J. N. Bahcall, Astrophys. J. 298, 8 (1985).
- (40) I. D. Karachentsev, O. G. Kashibadze, D. I. Makarov, and R. B. Tully, MNRAS 393, 1265 (2009).
- (41) I. D. Karachentsev, AJ 129, 178 (2005).
- (42) D. Makarov and I. Karachentsev, MNRAS 412, 2498 (2011).
- (43) D. I. Makarov and R. I. Uklein, Astrophysical Bulletin 67, 135 (2012).