Stellar population gradients and spatially resolved kinematics in luminous post-starburst galaxies
Abstract
We have used deep integral field spectroscopy obtained with the GMOS instrument on Gemini-North to determine the spatial distribution of the post-starburst stellar population in four luminous () E+A galaxies at . We find all four galaxies have centrally-concentrated gradients in the young stellar population contained within the central kpc. This is in agreement with the Balmer line gradients found in local low luminosity E+A galaxies. The results from higher redshift () samples of luminous E+A galaxies have been varied, but in general have found the post-starburst signature to be extended or a galaxy-wide phenomenon or have otherwise failed to detect gradients in the stellar populations. The ubiquity of the detection of a centrally concentrated young stellar population in local samples, and the presence of significant radial gradients in the stellar populations when the E+A galaxy core is well resolved raises the possibility that spatial resolution issues may be important in interpreting the higher redshift results. The two early type E+A galaxies in our sample that can be robustly kinematically classified, using the parameter, are fast–rotators. Combined with previous measurements, this brings the total number of E+A galaxies with measurements of to twenty-six, with only four being classified as slow–rotators. This fraction is similar to the fraction of the early–type population as a whole and argues against the need for major mergers in the production of E+A galaxies, since major mergers should result in an increased fraction of slow rotators.
keywords:
galaxies: evolution – galaxies: stellar content1 Introduction
E+A galaxies are in the process of a dramatic change in their star formation properties. They are characterized by an optical spectrum devoid of emission lines but exhibiting strong Balmer absorption lines. The strong Balmer absorption is associated with the presence of a significant population of A-type stars which must have formed within the last Gyr, yet the absence of emission lines implies that star formation is not ongoing. This spectral signature is interpreted as that of a post-starburst galaxy which has undergone a burst of star formation that has been truncated abruptly (e.g. Couch & Sharples 1987; Poggianti et al. 1999). These galaxies are undergoing a colour evolution between the blue cloud and the red sequence, and this evolution may be accompanied by a morphological transformation where a star-forming disk galaxy is transformed into a quiescent spheroidal system (e.g. Caldwell et al. 1996; Zabludoff et al. 1996).
There has been a variety of environmental mechanisms suggested which could cause these rapid changes in the star formation rate of a galaxy. These include both major and minor galaxy mergers (Mihos & Hernquist 1996; Bekki et al. 2005), gravitational interactions between galaxies of close to equal mass (Bekki et al. 2001), and in denser environments: galaxy harassment (Moore et al. 1996), interaction with the intra-cluster medium and tidal interactions with the global cluster field (Bekki et al. 2001). While the situation in galaxy clusters remains unclear (Pracy et al. 2010) and likely requires a cluster specific mechanism (Tran et al. 2004; Pracy et al. 2005; Poggianti et al. 2009), there is evidence that galaxy mergers are responsible for producing much of the local field E+A population. This evidence includes an increased rate of tidal features (Zabludoff et al. 1996; Yang et al. 2008; Pracy et al. 2009), the nature of the clustering and luminosity function (Blake et al. 2004), and the internal kinematics from spatially resolved spectroscopy which favors a scenario dominated by minor mergers (Pracy et al. 2009, 2012). Goto (2005) found an increased rate of near neighbors for E+A galaxies in the Sloan Digital Sky Survey (SDSS) implicating tidal interactions as a formation mechanism.
If gas-rich mergers are responsible for the E+A population then evidence of this should be imprinted in the spatial distribution of the stellar populations. During a merger, tidal forces transfer angular momentum from the gas to the stars (Barnes & Hernquist 1996), funneling the gas into the galactic centre and producing a central starburst (e.g. Hopkins et al. 2009). Furthermore, feedback processes cut off the star formation (Springel et al. 2005) leaving a young stellar population in a centrally concentrated cusp and an old stellar population distributed like a normal early type galaxy (Hopkins et al. 2009; Snyder et al. 2011). The young component should be compact, with scales of 1 kpc (Bekki et al. 2005; Hopkins et al. 2009). In the E+A galaxies this young component should be observable as a Balmer line absorption enhancement and gradient in the central region (Pracy et al. 2005; Snyder et al. 2011).
However, from an observational standpoint there remain conflicting results regarding the spatial distribution of the post-starburst population and the presence of stellar population gradients. Norton et al. (2001) followed up a sample of E+A galaxies selected from the Las Campanas Redshift Survey (LCRS, Zabludoff et al. 1996) with long-slit spectroscopy. They compared the radial distribution of the young and old stellar populations and concluded that the young stellar populations were centrally concentrated with respect to the old population. The seeing FWHM of the Norton et al. (2001) observations corresponded to 2–3 kpc and in approximately half of the cases they were able to spatially resolve the young stellar population. This lead them to conclude that in these cases the young stellar population is not confined to the galaxy core. Chilingarian et al. (2009) obtained Integral Field Unit (IFU) spectroscopy of a gas rich post-starburst galaxy and found the young population to be spread over the central kpc. Likewise Yagi & Goto (2006) observed three E+A galaxies selected from the SDSS with long slit spectroscopy and concluded that the young stellar population was as extended as the continuum light. Pracy et al. (2009) obtained Gemini Multi-Object Spectrograph (GMOS) IFU spectroscopy of a sample of ten E+A galaxies selected from the 2dFGRS (Blake et al. 2004) with a median redshift of , and were unable to detect any Balmer line gradients or central concentration in the young population. However, their limited spatial coverage coupled with spatial resolution constraints imposed by the delivered image quality meant they could not robustly rule out spatial gradients. Swinbank et al. (2012) who used the GMOS IFU observed a sample of eleven E+As selected from the SDSS and found that the A-stars extended over 2-15 kpc2 or around one third of the galaxy area defined by the continuum light. This was based on the area of the galaxy exhibiting an equivalent width of the H line Å (representing a very stringent constraint). They concluded that the characteristic E+A signature is a property of the galaxy as a whole and not due to a heterogeneous mixture of populations.
These attempts to measure the spatial distribution and radial gradients in the stellar populations have been hampered by physical scale resolution constraints. Since E+A galaxies are rare in the local universe, samples for detailed follow up are selected from large redshift surveys such as the SDSS and 2dFGRS (Blake et al. 2004; Goto 2007). These surveys have median redshifts of and as a result the majority of E+A galaxies followed up with spatially resolved spectroscopy are at a similar redshift. At this redshift 1 kpc projects to ″, meaning that the angular size of a typical ground–based seeing profile is significant in comparison to both the expected size of the gradients ( kpc) and the normal scale length of galaxies (a few kpc). The observed distribution of stellar populations is a complex combination of the delivered image quality (seeing), the true spatially resolved distribution of the stellar populations, and importantly (but sometimes overlooked) the spatial distribution of the continuum light (i.e. the galaxy surface brightness profile). Detailed modeling of the convolution of the expected gradients with the seeing disk for E+A galaxies by Pracy et al. (2010) demonstrated that this can lead to misleading and ambiguous results.
Pracy et al. (2012) recently circumvented this problem by slightly modifying the E+A selection criteria to select a lower redshift sample of galaxies than was available in the literature (). This low redshift selection meant that the galaxies have a large angular to physical scale which allowed the central 1 kpc region of the galaxies to be resolved; the region where stellar population gradients are expected. IFU spectroscopy of this sample enabled the first robust detections of Balmer line gradients in the centres of E+A galaxies. Six out of the sample of seven, and all the galaxies with regular morphologies, were observed to have compact and centrally concentrated Balmer absorption line gradients.
An unavoidable consequence of the local selection of the Pracy et al. (2012) sample is that the sample is composed entirely of intrinsically faint galaxies an order of magnitude or more below the characteristic galaxy luminosity (L∗) and fundamentally different to the populations studied at higher redshift. The physical effects of mergers, tidal interactions and shocking on star formation are notably different for dwarf galaxies than massive galaxies (e.g. Icke 1985; Brosch et al. 2004; Smith et al. 2010) and the Pracy et al. (2012) results should not be generalized to classical massive E+A galaxies. In addition, as a result of aperture effects, all but one of this sample would not have been classified as E+A galaxies if observed beyond z (Pracy et al. 2012).
What is required is a sample of galaxies at a low enough redshift where the physical scale resolution is still adequate to resolve stellar population gradients should they be present. There does exist a ‘sweet spot’ at which allows a large enough angular to physical scale to resolve these gradients given good ground–based seeing and enough cosmic volume to select a small sample of L∗ targets. In this paper we present a study of the spatially resolved stellar populations in a sample of four such E+A galaxies, based on IFU spectroscopy obtained with the Gemini Multi-Object Spectrograph.
2 Observations and data
2.1 Sample selection
We obtained Gemini-North GMOS IFU spectroscopy of four E+A galaxies in the 2006B semester (Program ID: GN-2006B-Q-48; PI: Turner). This small pilot sample was selected from a parent catalogue of E+A galaxies generated from the SDSS data release 4 database. The parent sample was restricted to objects with z0.04 and red magnitudes mags. The objects were selected from the SDSS to have strong H absorption and significant absorption when averaged over the H, H, and H lines as well as little or no H emission. Explicitly the selection constraints were:
-
EW(H) Å
-
EW(H) Å
-
average of EW(H), EW(H), EW(H) Å
-
-
16 mag
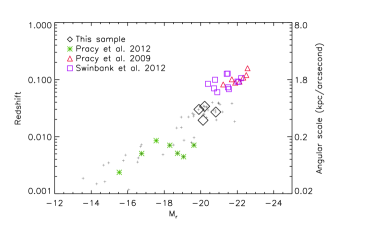
The sample defined by these criteria is shown as the grey crosses in Figure 1 – our target galaxies have absolute magnitudes around the bright-end of this sample. The redshifts and magnitudes of our targets translate to all being within 1.4 magnitudes of . This coincides with the low end of the luminosity distribution of the higher redshift IFU E+A samples of Pracy et al. (2009) and Swinbank et al. (2012), but with a factor of 4 better physical to angular scale. They are significantly more luminous than the most luminous galaxies in the local sample of Pracy et al. (2012); see Figure 1 for a comparison. The sample consists of two isolated early type galaxies (classified by visual inspection of the SDSS imaging), one early type cluster galaxy at a projected cluster-centric distance of Mpc, and one strongly interacting system.
2.2 Observations
The data are composed of IFU observations taken in 2-slit mode giving a arcsecond field-of-view with ″ sampling and were taken in sub-arcsecond seeing (see Table 1). The B600 grating was used resulting in spectra with a resolution of and covering a wavelength range from to 5200Å , which includes the H, H and H spectral lines. Each science target was observed either three or four times over two nights with each exposure being approximately 1 hour in length. The exposures are dithered both spatially and spectrally and for each exposure a corresponding flat field and arc lamp exposure is acquired immediately preceding or following each science exposure. In addition, twilight flat fields in each grating position were taken on the first night on which science observations for this project were made. A summary of the targets and observations is given in Table 1.
| object ID | scale | H | H | exposure | seeing | Morphology and | ||||
|---|---|---|---|---|---|---|---|---|---|---|
| (mag) | (mag) | (mag) | (kpc/arcsec) | (Å) | (Å) | (s) | (arcsec) | environment notes | ||
| SJ1613+5103 | 15.64 | 0.27 | 0.034 | -0.98 | 0.68 | 6.36 | -0.49 | 14160 | 0.83 | Strongly interacting pair |
| SJ2114+0032 | 14.54 | 0.33 | 0.027 | -0.39 | 0.54 | 7.09 | 0.87 | 14160 | 0.61 | Isolated Field |
| SJ1718+3007 | 15.70 | 0.62 | 0.030 | -1.32 | 0.60 | 5.51 | -0.39 | 10620 | 0.81 | Isolated Field |
| SJ0044-0853 | 14.50 | 0.58 | 0.019 | -1.09 | 0.39 | 4.17 | 2.49 | 14160 | 0.66 | 1.3 kpc from Abell 085 centre |
Summary of the sample properties and observations. From left to right: object ID; r-band magnitude; color; redshift; the difference between the absolute r-band magnitude and the characteristic magnitude of the r-band luminosity function from Montero-Dorta & Prada (2009); physical to angular scale; average equivalent width of the H, H, and H lines from the SDSS spectra; equivalent width of the H line from the SDSS spectra; total exposure time; the mean seeing estimated from the acquisition images; environmental classification of the target galaxy. Note: object IDs are shortened for convenience, full SDSS object IDs are (top to bottom): 587729227690475600, 587730847963545655, 587729408621609096, 587727227842461731.
2.3 Data reduction
The data were reduced using the standard iraf routines from the gemini package which are specifically designed for reduction of GMOS data. Briefly, the fibre flat fields were traced and extracted and these fibre positions were used for the extraction of the corresponding science and calibration frames. The twilight flat field was extracted and used together with the flat field to make a response curve for each fiber using the task gfresponse. The arc frame was then extracted and the task gswavelength used to establish a wavelength solution. The science frames were then bias–subtracted, extracted, flat fielded and wavelength calibrated. Sky subtraction was performed for the two slits independently. Data cubes were produced using the task gfcube with 0.1″spatial sampling. The shifts between exposures as a result of the dither pattern were measured and the separate data cubes for each target galaxy coadded using the task scombine. Following this the data cubes were rebinned to 0.2″spatial pixels. No flux calibration of the data was applied. We flattened out any continuum slopes by division of a fitted low order polynomial. This is of little consequence since the analysis is restricted to relative line index measurements which, to first order, have no dependence on the overall continuum slope. In addition, the wavelength range of the observations is narrow (of the order Å) and the galaxy continuum is expected to be relatively flat over that range.
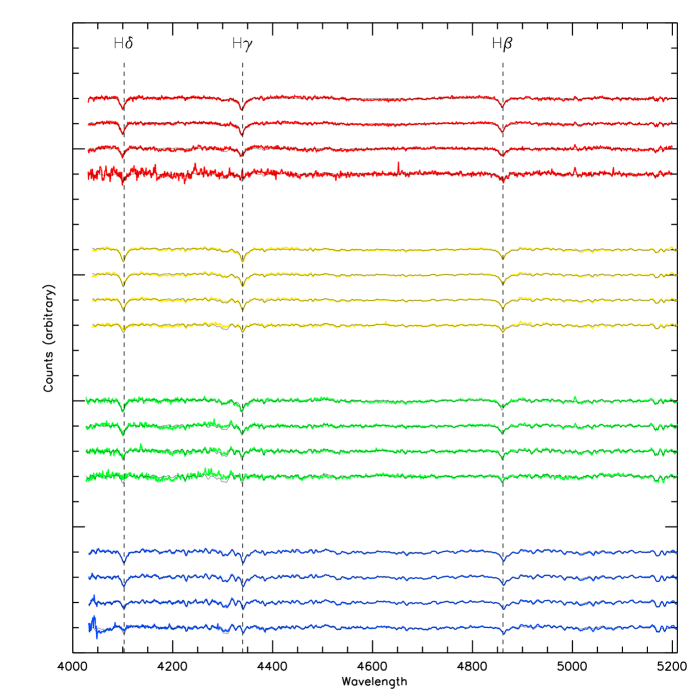
As a result of the steep surface brightness profile of our target galaxies, the signal-to-noise ratio varies significantly with position on the IFU, generally in the sense that the signal-to-noise decreases rapidly with galacto-centric radius. In order to detect radial gradients in the stellar populations the spatial resolution and sampling in the innermost regions is critical. We do no binning or smoothing within a central radius of 1.5″(note the seeing full width half maximum of the data in all cases is 0.6–0.8 arcseconds). At larger galacto-centric radius, improvements to the signal-to-noise ratio are required and we boxcar smooth the data to 0.6″(i.e. spaxels) to improve the signal-to-noise ratio in these regions. In addition to the rapidly decreasing surface brightness profile of the target galaxies, the spatial edges of the IFU data have not had the total exposure time as a result of the dither pattern and we clip the edges of the IFU field to a final size of 5.2″4″. Since we are primarily interested in radial trends in the stellar populations, we also construct annular binned spectra with inner and outer boundaries at radii of 0.0–0.4, 0.4–0.8, 0.8–1.6, 1.6–2.4 arcseconds. Note: since we use the same angular size for galaxies at different redshifts, the annular bins correspond to different physical apertures. This binning produces high quality spectra for radial analysis. The annular spectra for each galaxy are shown in Figure 2
2.4 Recession velocities and spectral fitting
To study the internal kinematics and for a wavelength reference for measuring line indices, we need to fit the recession velocity and velocity dispersion for each spaxel. We fitted the spectra with a set of rest-frame single-age single-metallicity stellar population templates (Vazdekis et al. 2010). The galaxy spectra were smoothed to match the resolution of the templates. The fitting was performed using the penalized pixel fitting algorithm of Cappellari & Emsellem (2004). A low order multiplicative polynomial is included in the fit to allow for variations in the continuum slope.
3 Results
3.1 Balmer line gradients
Our primary motivation is to measure the Balmer line strength distribution at high spatial resolution. To this end we measured the equivalent width of the H, H, and H lines for every spaxel in our IFU data cube. The equivalent widths were measured using the standard flux summing technique. The line strengths were measured using the Lick/Intermediate Dispersion Spectrograph system line definitions (Worthey & Ottaviani 1997; Trager et al. 1998), which included smoothing of the spectra to Lick resolution. We use the broader H and H index definitions throughout. The numerical values of the measured equivalent widths have a small dependence on the continuum shape. In order to make our equivalent width measurements numerically consistent with the Lick system for comparison to models we applied the following corrections: For each science spectrum we used the results of the stellar population fits described in Section 2.4 (which included a multiplicative polynomial to remove the dependence of the fit on continuum shape) to reconstruct a ‘flux calibrated’ model spectrum from the best fitting combination of stellar population templates. This spectrum should have approximately the true continuum shape. The overall shape of this spectrum and the science spectrum were fitted with a low order polynomial and the science spectrum was multiplied by the ratio of these to give it the expected ‘flux calibrated’ shape. We then measured the index values from the ‘pseudo-flux-calibrated’ spectrum. The correction between measurements made on flux calibrated spectra and the Lick system are known (Norris et al. 2006) and we applied this correction to the measured equivalent width values to obtain final index values numerically consistent with the Lick system. While these corrections are required for consistency, the dependence of the measured equivalent widths on the continuum shape is a second order effect, and the resulting corrections are small and do not qualitatively change the results.
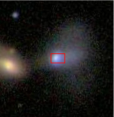
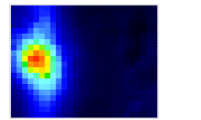
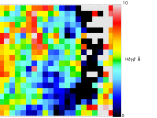
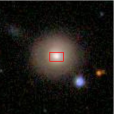
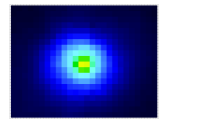
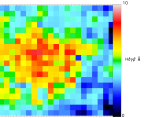
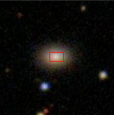
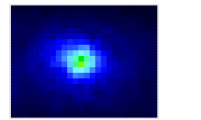
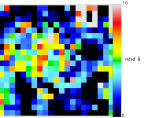
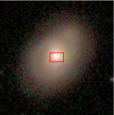
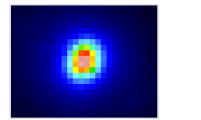
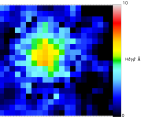
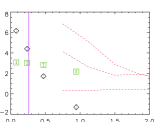
The results are shown in the third column of Figure 3 which shows the Balmer line strength over the IFU field-of-view. We have taken the average of the three Balmer lines (H, H, and H) for increased signal-to-noise but the results are qualitatively the same using any one individual line. The Balmer equivalent width strength maps can be compared with the galaxy continuum profile in column 2 of Figure 3 (which shows the IFU image constructed by collapsing the data cube in the wavelength direction) and also to the SDSS image of each galaxy in column 1 (which has the IFU field-of-view superimposed). In all four cases the Balmer line absorption strength is centrally concentrated, consistent with the lower luminosity E+A galaxies in the Pracy et al. (2012) sample. We also measured Balmer line equivalent width radial profiles from our annular binned spectra. The radial H profiles are shown in the final column of Figure 3 as black diamonds. All four galaxies have centrally concentrated H profiles within the central 1 kpc. For comparison we over-plot (as red dashed lines) the H profiles of a simulated merger from Pracy et al. (2005, see also ) at times of 0.2 Gyr (steepest profile), 0.75 Gyr (middle profile) and 1.5 Gyr (flat profile) after the peak of the starburst.
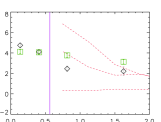
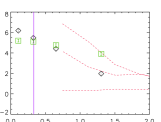
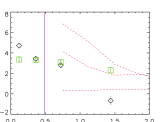
The primary motivation for observing a ‘low’ redshift sample of E+A galaxies was to circumvent the problems associated with beam smearing – which can be severe (e.g. Pracy et al. 2010). We can simulate how the radial profiles would appear if they were observed at higher redshift by artificially smoothing the data cubes to the physical scale resolution which would have been achieved by the observations for targets at that redshift. In this case the IFU fields do not extend over the entire galaxy so there are unavoidable edge effects in applying this artificial smoothing, nevertheless, it demonstrates the difficulty of such observations at higher redshift. In Figure 3 we over-plot as green squares the radial profiles calculated from our data artificially smoothed to (i.e. similar to that of the Pracy et al. (2009) and Swinbank et al. (2012) samples) and with the same seeing as the original observations. The radial gradients in H are no longer observed and the profiles are essentially flat. These degraded profiles could be interpreted as galaxy-wide E+A signatures. The higher redshift studies (using the same instrument) have the advantage of covering a larger physical area, while our observations are restricted to the galaxy centre (see column 1 of Figure 3).
Long slit spatially resolved observations of SJ1613+5103 (top row in Figure 3) have been performed using the FOCAS spectrograph on the Subaru telescope (Yagi et al. 2006; Goto et al. 2008). The slit position dissects both nuclei of the interacting pair and has a position angle close to that of the long axis of our IFU observations. They report that the E+A signature is extended from the centre to at least 5 kpc out into the ‘tidal plume’ and there is no evidence for a H gradient. This conflicts with the results displayed in Figure 3 where there is a clear H and Balmer line gradient; albeit the shallowest one in our sample. There is also disagreement in the absolute strength of the H equivalent width – although this can depend on the precise index and continuum bands used as well as the size and placement of the aperture. Yagi et al. (2006) measure the central H equivalent width to be 6–7 Å while Goto et al. (2008), using the same definitions, find H equivalent widths of 7-10Å. In this work we find the central H equivalent width, using the H index definition, to be only 5Å (see right hand column of Figure 3). Although this should not be directly compared since, as mentioned above, we have placed our values on the Lick system. We note that in general our measurements of equivalent widths in the central aperture are in good agreement with the published SDSS values (on the same system). The radial profile for the H line measured by Goto et al. (2008) is uniformly strong (with a slight negative gradient) but their profiles for H and H have positive gradients and weak central absorption strengths (2–3Å). This is inconsistent with the results presented here as well as with the SDSS catalog values which have H and H equivalent widths of 6Å. Both Goto et al. (2008) and Yagi et al. (2006) find a gradient in the D4000 break consistent with a younger stellar population in the galaxy centre. They conclude this trend in D4000 combined with the lack of a H gradient cannot be fully explained by existing theoretical models (Yagi et al. 2006). This galaxy is the highest redshift object in our sample and the data is of moderate signal-to-noise and resolving these inconsistencies with certainty will likely require higher quality observations.
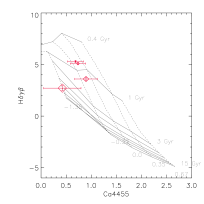
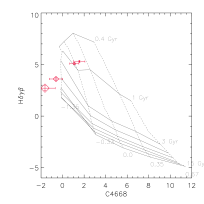
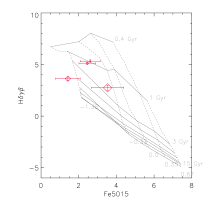
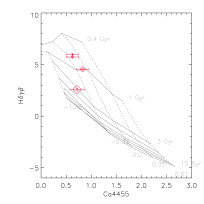
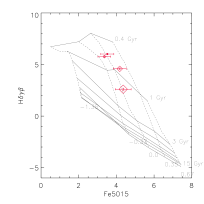
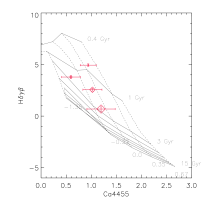
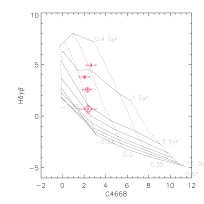
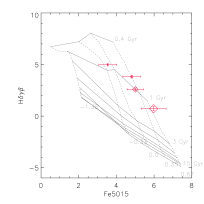
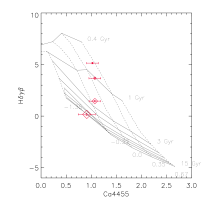
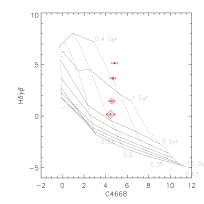
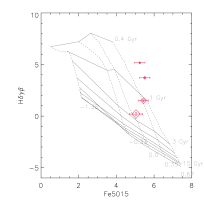
That the Balmer line gradients in Figure 3 correspond to age gradients is demonstrated in Figure 4 where we have plotted a series of age-metallicity diagnostic diagrams. We used the combined H, H, and H line equivalent width for the age sensitive index plotted against several of the standard metallicity indices within our wavelength coverage. The index values measured from the annular binned spectra are over-plotted as red diamonds where the symbol size is used to represent the galacto-centric radius of the annular bin – in the sense that larger symbol sizes represent larger radii. Over-plotted are age-metallicity grids derived from the stellar population models of Thomas et al. (2003, 2004) using solar abundance ratios. For all four galaxies there is a clear trend of increasing age with increasing radius, from 1 Gyr in the galaxy centres to a few Gyr in the outermost annuli. There is more scatter and some systematic differences between indices in metallicity and no strong radial trends. There is a hint of a negative metallicity gradient in SJ0044-0853 (fourth row) with higher metallicity values in the galaxy centre.

3.2 Kinematics
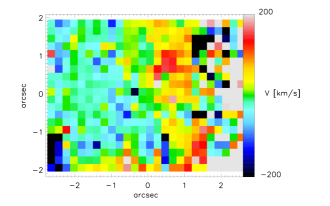
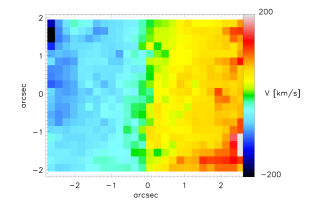
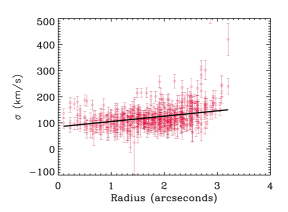
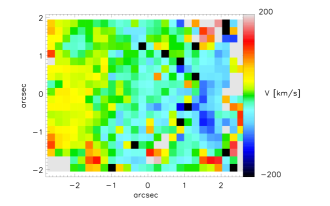
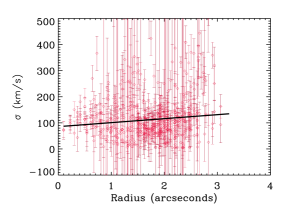
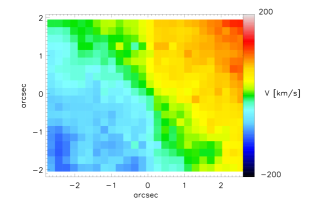
The stellar population fits described in Section 2.4 produce a measurement of the streaming velocity and velocity dispersion for every spaxel. The two dimensional velocity maps are shown in the left panels of Figure 5. There is rotation in each case although the maps for SJ1613+5103 (first row) and SJ1718+3007 (third row) are somewhat chaotic. SJ1613+5103 is one member of an interacting pair and disturbance of the kinematic field is not unexpected. In the case of SJ1718+3007 the kinematic centre appears offset from the photometric centre (compare with column 2 in Figure 3). While this may represent evidence of a past merger event which could also explain the post-starburst spectroscopic signature; we note that these two galaxies are the faintest targets (see Table 1) and have significantly lower signal-to-noise ratio than the two brighter galaxies which have smooth rotation fields.
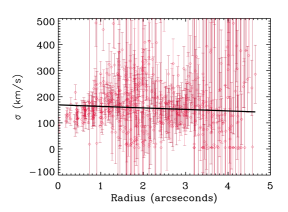
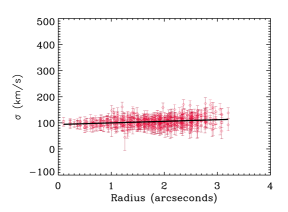
The velocity dispersion measurements are shown in the right panels of Figure 5 plotted as a function of distance from the galaxy centre. These values have large uncertainties when measured from low signal-to-noise spectra as demonstrated by the scatter and large errors for the velocity dispersion measurements for SJ1613+5103 and SJ1718+3007. Despite the large scatter in the velocity dispersion measured from an individual spaxel in low signal-to-noise cases, the velocity dispersion as a function of radius can be well represented by a linear fit. A robust linear fit to the velocity dispersion versus radius is over-plotted as a black line in Figure 5.
The parameter (Emsellem et al. 2007; Emsellem et al. 2011) is commonly used to quantify the kinematic state of early type galaxies when two dimensional integral field spectroscopy is available. The parameter involves luminosity-weighted averages over the 2D kinematic field provided by IFU data and acts as a proxy to the observed projected stellar angular momentum per unit mass. is defined as:
where , , and are the flux, radial distance, streaming velocity and velocity dispersion of the ith spaxel, respectively. The sum runs over all spaxels.
Emsellem et al. (2007) demonstrated that using this parameter the elliptical galaxy population can be separated into two distinct kinematic classes: the fast and slow rotators. Emsellem et al. (2011), utilizing the complete ATLAS-3D (Cappellari et al. 2011) sample, found per cent of early type galaxies are classified as fast rotators. Likewise, the E+A galaxy population is dominated by fast rotators (Pracy et al. 2009; Swinbank et al. 2012; Pracy et al. 2012). The dearth of slow rotators in the E+A population has been used to argue against the need for major galaxy mergers in their production (Pracy et al. 2009, 2012), since the probability of a rotating remnant increases as the mass ratio of the progenitors involved in the merger increases (Bournaud et al. 2008). The values for our sample are shown in Figure 6 as green diamonds, noting we have excluded SJ1613+5103, since it is a later-type interacting system whereas the parameter is used as a diagnostic for early type galaxies. We use the velocity dispersion values estimated from the linear fit as to exclude spurious values of the velocity dispersion in some low signal-to-noise spaxels. All three galaxies reside in the fast rotator region of the –ellipticity plane. The errors on are estimated by simulating a large number of velocity and velocity dispersion maps by adding a random velocity drawn from a normal distribution with a width determined by the error for the velocity or velocity dispersion of that spaxel and recalculating .
The parameter depends on the square of the velocity of each spaxel and as a result is always a positive quantity. Even in the absence of rotation, noise in the velocity measurements will result in a non-zero positive value of and therefore there is a minimum value below which the true value of cannot be measured. This minimum measurable value can be estimated by performing the simulations described above after having set the velocity field to zero everywhere. The estimated minimum value of from the simulations can be compared to the values measured from the real data. In the case of SJ2114+0032 and SJ0044-0853, the measured values of are 3.5 and 4.5 times larger than the minimum values and therefore the classification of these galaxies as fast rotators is robust. In the case of SJ1718+3007 (object with the low signal-to-noise velocity field in the third row of Figure 5) the minimum value and the measured value are essentially the same (within 1), implying that the quality of the data are insufficient to classify this galaxy’s kinematic state. The same is true for the late type interacting system SJ1613+5103.
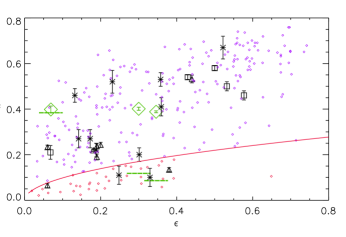
In Figure 6 we also show previous measurements of from the literature. The values of the Pracy et al. (2009) sample are plotted as black triangles, the Swinbank et al. (2012) sample as black stars and the Pracy et al. (2012) sample as black squares. The ATLAS-3D fast rotators (small blue diamonds) and slow rotators (small red diamonds) are also shown for comparison (Emsellem et al. 2011). The thick red curve is the ellipticity dependent separation of fast rotators (above the line) and slow rotators (below the line) from Emsellem et al. (2011). Of the twenty six E+A galaxies with measured values of (we have excluded SJ1718+3007), four are classified as slow rotators using the definition of Emsellem et al. (2011). One of the Pracy et al. (2012) fast rotator classifications is marginal and based on the error bars (they do not quote minimum measurable values) one of the Swinbank et al. (2012) classifications is also marginal. The Pracy et al. (2009) classifications are robust based on similar simulations to those presented here. This equates to a fast rotator fraction of 83–85 per cent. This is similar to the fraction in the overall early type galaxy population as measured from the ATLAS-3D sample by Emsellem et al. (2011) of per cent. This comparison is only illustrative since the fraction is sensitive to the stellar mass (or luminosity) distribution of sample – in the sense that there is a higher fraction of slow rotators amongst more massive ellipticals. The distribution of absolute K–band magnitudes of the ATLAS-3D sample and the E+A samples are different. The distribution for the E+A galaxies peaks brighter but extends fainter. In fact, three of the five early type E+A galaxies in the sample of Pracy et al. (2012) have absolute K–band magnitudes fainter than the ATLAS-3D selection limit of .
4 Summary and conclusions
In this paper we have presented IFU spectroscopy of four E+A galaxies that have a luminosity close to and overlap the bottom end of the luminosity distribution of previous studies (Pracy et al. 2009; Swinbank et al. 2012) but which are located at low enough redshift () and observed in good enough conditions (seeing always ″) to resolve the central kiloparsec – a condition not met by the previous higher redshift samples. Consistent with the properties of the local low luminosity E+A galaxies (Pracy et al. 2012), we find all four have centrally concentrated Balmer line gradients on scales of kpc. This includes the cluster member galaxy SJ0044-0853. The gradients correspond to ages of Gyr in the centre to a few Gyr at radii of kpc. These gradients are consistent with production via galaxy mergers and the Balmer line profiles are similar to those obtained from merger models (Pracy et al. 2005; Bekki et al. 2005) seen at times of Gyr from the peak of the starburst (see Figure 3).
The ubiquity of the detection of a centrally concentrated young stellar population, and the presence of stellar population gradients when the E+A galaxy cores are well resolved, raises the possibility that spatial resolution issues may be important in interpreting the higher redshift results, which have generally indicated that the post–starburst signature is a more wide spread or global phenomenon. We have illustrated this by artificially smoothing our data cubes to simulate them being observed at and re-measured the radial H profiles. When this is done the observed radial gradients are flattened out to the extent that they are consistent with no radial gradient at all. However we can not truly simulate the higher redshift observations since the physical area of the galaxy covered by our observations is smaller than what would be observed (with the same instrument) at higher redshift. These results are consistent with the models of Pracy et al. (2010) who demonstrated that the combination of the expected Balmer line gradients in E+A galaxies and the steep surface brightness profiles of early type galaxies can potentially lead to steep Balmer line gradients being observed as uniformly high Balmer absorption across the entire galaxy, if the physical scale resolution is insufficient.
A summary of the findings from this study are as follows:
-
All four E+A galaxies have negative Balmer line gradients in the central kpc. This is consistent with expectations of formation as the result of galaxy interactions or mergers.
-
The Balmer line gradients correspond to ages of Gyr in the centre and a few Gyrs at galacto-centric radii of 1 kpc.
-
The three E+A galaxies that are of early morphological type all have values of placing them in the fast rotator category, although in one case this classification is not secure as a result of the low signal-to-noise in the kinematic maps.
-
The total number of E+A galaxies with measurements is twenty six and four of these have a slow rotator classification using the ellipticity dependent definition of Emsellem et al. (2011). This is close to the fraction in the early type galaxy population as a whole.
5 Acknowledgments
Based on observations obtained at the Gemini Observatory, which is operated by the Association of Universities for Research in Astronomy, Inc., under a cooperative agreement with the NSF on behalf of the Gemini partnership: the National Science Foundation (United States), the Science and Technology Facilities Council (United Kingdom), the National Research Council (Canada), CONICYT (Chile), the Australian Research Council (Australia), Ministério da Ciência, Tecnologia e Inovação (Brazil) and Ministerio de Ciencia, Tecnología e Innovación Productiva (Argentina). MBP, SC, ES and WJC acknowledge the financial support of the Australian Research Council throughout the course of this work. We would like to thank the referee for insightful comments which greatly improved this paper.
References
- Barnes & Hernquist (1996) Barnes J. E., Hernquist L., 1996, ApJ, 471, 115
- Bekki et al. (2005) Bekki K., Couch W. J., Shioya Y., Vazdekis A., 2005, MNRAS, 359, 949
- Bekki et al. (2001) Bekki K., Shioya Y., Couch W. J., 2001, ApJ, 547, L17
- Blake et al. (2004) Blake C., Pracy M. B., Couch W. J., Bekki K., Lewis I., and 26 other authors 2004, MNRAS, 355, 713
- Bournaud et al. (2008) Bournaud F., Bois M., Emsellem E., Duc P. A., 2008, Astron. Nachr., in press
- Brosch et al. (2004) Brosch N., Almoznino E., Heller A. B., 2004, MNRAS, 349, 357
- Caldwell et al. (1996) Caldwell N., Rose J. A., Franx M., Leonardi A. J., 1996, AJ, 111, 78
- Cappellari & Emsellem (2004) Cappellari M., Emsellem E., 2004, PASP, 116, 138
- Cappellari et al. (2011) Cappellari M., Emsellem E., Krajnović D., McDermid R. M., Scott N., Verdoes Kleijn G. A., Young L. M., Alatalo K., Bacon R., 16 other authors 2011, MNRAS, 413, 813
- Chilingarian et al. (2009) Chilingarian I. V., De Rijcke S., Buyle P., 2009, ApJ, 697, L111
- Couch & Sharples (1987) Couch W. J., Sharples R. M., 1987, MNRAS, 229, 423
- Emsellem et al. (2011) Emsellem E., Cappellari M., Krajnović D., Alatalo K., Blitz L., Bois M., Bournaud F., Bureau M., Davies R. L., Davis T. A., de Zeeuw P. T., Khochfar S., Kuntschner H., Lablanche P.-Y., 20 other authors 2011, MNRAS, 414, 888
- Emsellem et al. (2007) Emsellem E., Cappellari M., Krajnović D., van de Ven G., Bacon R., Bureau M., Davies R. L., de Zeeuw P. T., Falcón-Barroso J., Kuntschner H., McDermid R., Peletier R. F., Sarzi M., 2007, MNRAS, 379, 401
- Goto (2005) Goto T., 2005, MNRAS, pp 53–+
- Goto (2007) Goto T., 2007, MNRAS, 381, 187
- Goto et al. (2008) Goto T., Yagi M., Yamauchi C., 2008, MNRAS, 391, 700
- Hopkins et al. (2009) Hopkins P. F., Cox T. J., Dutta S. N., Hernquist L., Kormendy J., Lauer T. R., 2009, ApJS, 181, 135
- Icke (1985) Icke V., 1985, A&A, 144, 115
- Mihos & Hernquist (1996) Mihos J. C., Hernquist L., 1996, ApJ, 464, 641
- Montero-Dorta & Prada (2009) Montero-Dorta A. D., Prada F., 2009, MNRAS, 399, 1106
- Moore et al. (1996) Moore B., Katz N., Lake G., Dressler A., Oemler A., 1996, Nat, 379, 613
- Norris et al. (2006) Norris M. A., Sharples R. M., Kuntschner H., 2006, MNRAS, 367, 815
- Norton et al. (2001) Norton S. A., Gebhardt K., Zabludoff A. I., Zaritsky D., 2001, ApJ, 557, 150
- Poggianti et al. (2009) Poggianti B. M., Aragón-Salamanca A., Zaritsky D., De Lucia G., Milvang-Jensen B., Desai V., Jablonka P., Halliday C., 10 other authors 2009, ApJ, 693, 112
- Poggianti et al. (1999) Poggianti B. M., Smail I., Dressler A., Couch W. J., Barger A. J., Butcher H., Ellis R. S., Oemler A. J., 1999, ApJ, 518, 576
- Pracy et al. (2005) Pracy M. B., Couch W. J., Blake C., Bekki K., Harrison C., Colless M., Kuntschner H., de Propris R., 2005, MNRAS, 359, 1421
- Pracy et al. (2010) Pracy M. B., Couch W. J., Kuntschner H., 2010, Publ. Astron. Soc. Austral., 27, 360
- Pracy et al. (2009) Pracy M. B., Kuntschner H., Couch W. J., Blake C., Bekki K., Briggs F., 2009, MNRAS, 396, 1349
- Pracy et al. (2012) Pracy M. B., Owers M. S., Couch W. J., Kuntschner H., Bekki K., Briggs F., Lah P., Zwaan M., 2012, MNRAS, 420, 2232
- Smith et al. (2010) Smith R., Davies J. I., Nelson A. H., 2010, MNRAS, 405, 1723
- Snyder et al. (2011) Snyder G. F., Cox T. J., Hayward C. C., Hernquist L., Jonsson P., 2011, ApJ, 741, 77
- Springel et al. (2005) Springel V., Di Matteo T., Hernquist L., 2005, MNRAS, 361, 776
- Swinbank et al. (2012) Swinbank A. M., Balogh M. L., Bower R. G., Zabludoff A. I., Lucey J. R., McGee S. L., Miller C. J., Nichol R. C., 2012, MNRAS, 420, 672
- Thomas et al. (2003) Thomas D., Maraston C., Bender R., 2003, MNRAS, 339, 897
- Thomas et al. (2004) Thomas D., Maraston C., Korn A., 2004, MNRAS, 351, L19
- Trager et al. (1998) Trager S. C., Worthey G., Faber S. M., Burstein D., Gonzalez J. J., 1998, ApJS, 116, 1
- Tran et al. (2004) Tran K., Franx M., Illingworth G. D., van Dokkum P., Kelson D. D., Magee D., 2004, ApJ, 609, 683
- Vazdekis et al. (2010) Vazdekis A., Sánchez-Blázquez P., Falcón-Barroso J., Cenarro A. J., Beasley M. A., Cardiel N., Gorgas J., Peletier R. F., 2010, MNRAS, 404, 1639
- Worthey & Ottaviani (1997) Worthey G., Ottaviani D. L., 1997, ApJS, 111, 377
- Yagi & Goto (2006) Yagi M., Goto T., 2006, AJ, 131, 2050
- Yagi et al. (2006) Yagi M., Goto T., Hattori T., 2006, ApJ, 642, 152
- Yang et al. (2008) Yang Y., Zabludoff A. I., Zaritsky D., Mihos J. C., 2008, ApJ, 688, 945
- Zabludoff et al. (1996) Zabludoff A. I., Zaritsky D., Lin H., Tucker D., Hashimoto Y., Shectman S. A., Oemler A., Kirshner R. P., 1996, ApJ, 466, 104