The plasmoid instability during asymmetric inflow magnetic reconnection
Abstract
Theoretical studies of the plasmoid instability generally assume that the reconnecting magnetic fields are symmetric. We relax this assumption by performing two-dimensional resistive magnetohydrodynamic simulations of the plasmoid instability during asymmetric inflow magnetic reconnection. Magnetic asymmetry modifies the onset, scaling, and dynamics of this instability. Magnetic islands develop preferentially into the weak magnetic field upstream region. Outflow jets from individual X-points impact plasmoids obliquely rather than directly as in the symmetric case. Consequently, deposition of momentum by the outflow jets into the plasmoids is less efficient, the plasmoids develop net vorticity, and shear flow slows down secondary merging between islands. Secondary merging events have asymmetry along both the inflow and outflow directions. Downstream plasma is more turbulent in cases with magnetic asymmetry because islands are able to roll around each other after exiting the current sheet. As in the symmetric case, plasmoid formation facilitates faster reconnection for at least small and moderate magnetic asymmetries. However, when the upstream magnetic field strengths differ by a factor of four, the reconnection rate plateaus at a lower value than expected from scaling the symmetric results. We perform a parameter study to investigate the onset of the plasmoid instability as a function of magnetic asymmetry and domain size. There exist domain sizes for which symmetric simulations are stable but asymmetric simulations are unstable, suggesting that moderate magnetic asymmetry is somewhat destabilizing. We discuss the implications for plasmoid and flux rope formation in solar eruptions, laboratory reconnection experiments, and space plasmas. The differences between symmetric and asymmetric simulations provide some hints regarding the nature of the three-dimensional plasmoid instability.
I INTRODUCTION
The Sweet-Parker model of magnetic reconnectionSweet (1958); *parker:1957; *parker:1963 predicts the formation of very high aspect ratio current sheets in solar and astrophysical plasmas. However, these high Lundquist number current sheets are unstable to the formation of plasmoids.Loureiro, Schekochihin, and Cowley (2007); Baalrud et al. (2011); Baalrud, Bhattacharjee, and Huang (2012); Ni et al. (2010); Bhattacharjee et al. (2009); Samtaney et al. (2009); Huang and Bhattacharjee (2010); Huang, Bhattacharjee, and Sullivan (2011); Ni et al. (2012a, b); Shepherd and Cassak (2010); Bárta et al. (2011); Shen, Lin, and Murphy (2011); Mei et al. (2012) This plasmoid instability leads to significant departures from the classical view of laminar, Sweet-Parker-like reconnection.
Like the tearing mode,Furth, Killeen, and Rosenbluth (1963) the linear properties of the plasmoid instability have been investigated analytically by performing an asymptotic matching analysis over an appropriate choice of equilibrium.Loureiro, Schekochihin, and Cowley (2007); Baalrud et al. (2011); Baalrud, Bhattacharjee, and Huang (2012); Ni et al. (2010); Bhattacharjee et al. (2009) The linear growth rate scales as while the number of plasmoids scales as . Here, is the upstream Alfvén speed, is the half-length of the current sheet, is the resistivity, and is the Lundquist number. Numerical tests have confirmed these growth rates and determined the eigenmode structure. Samtaney et al. (2009); Huang and Bhattacharjee (2010) That the growth rate scales as the Lundquist number to a positive exponent is significant: Sweet-Parker-like reconnection layers become more unstable with increasing Lundquist number. The positive exponent occurs in part because the thickness of Sweet-Parker current sheets scales as . In contrast, the growth rate of the tearing instability scales as for the constant- regime and for the nonconstant- regime in slab geometry.Coppi et al. (1976) In Hall MHD, the linear growth rate is enhanced when the ion inertial length exceeds the resistive skin depth.Baalrud et al. (2011) In three dimensions, oblique modes of the plasmoid instability may develop when a guide field is present because the locations of rational surfaces are not always the surface where the reconnecting component of the magnetic field reverses.Baalrud, Bhattacharjee, and Huang (2012)
Plasmoid formation has been shown to onset when the Lundquist number of a current sheet exceeds a critical value, . Biskamp (1986); Bhattacharjee et al. (2009); Huang and Bhattacharjee (2010); Ni et al. (2012a); Shen, Lin, and Murphy (2011); Baty (2012); Loureiro et al. (2012) The most commonly quoted value for the critical Lundquist number is , but there is considerable variation in the values found for . Bhattacharjee et al.Bhattacharjee et al. (2009) and Huang et al.Huang and Bhattacharjee (2010) find that is around or , while Shen and coauthorsShen, Lin, and Murphy (2011) determine that for a different configuration. Ni et al.Ni et al. (2012a) find that the onset criterion depends on the upstream plasma , denoted . They find that is between and for , but this increases to between and for . They use isothermal initial conditions for most of their simulations, but find that many of the differences are reduced when uniform density initial conditions are used instead. The range in values for indicates that the onset of the plasmoid instability is not just a function of the Lundquist number, but also depends on the configuration of the problem and the basic plasma parameters. The value (or range in values) for is important because statistical models of plasmoids Uzdensky, Loureiro, and Schekochihin (2010); Huang and Bhattacharjee (2012); Loureiro et al. (2012); Fermo, Drake, and Swisdak (2010) often assume that individual plasmoids are separated by marginally stable current sheets.
The nonlinear evolution of the plasmoid instability has been investigated by several groups.Bhattacharjee et al. (2009); Samtaney et al. (2009); Huang and Bhattacharjee (2010); Huang, Bhattacharjee, and Sullivan (2011); Ni et al. (2012a, b); Shepherd and Cassak (2010); Bárta et al. (2011); Shen, Lin, and Murphy (2011); Mei et al. (2012) Surprisingly, two-dimensional, symmetric resistive MHD simulations have shown that the dimensionless reconnection rate levels off at for . Bhattacharjee et al. (2009); Huang and Bhattacharjee (2010) Reconnection is therefore fast (i.e., independent of the Lundquist number). Reconnection rates in solar flares typically range from to ,Dere (1996); *jqiu:2002; *isobe:2005; *jjing:2005; *Nagashima:2006; *Narukage:2006 and it has been argued that the role of the plasmoid instability is to trigger collisionless reconnection to allow reconnection rates closer to . Shepherd and Cassak (2010); Huang, Bhattacharjee, and Sullivan (2011)
Most simulations of the plasmoid instability assume symmetric inflow. This approach reduces computing time because high resolution is required only near the symmetry axis and only half of the domain needs to be evolved in time. This simplifies the analysis because magnetic and velocity nulls located along the symmetry axis are easy to find. However, the reconnection process will in general have some asymmetry. Asymmetric inflow reconnection occurs when the upstream magnetic field strengths and/or densities differ. La Belle-Hamer, Otto, and Lee (1995); Ugai (2000); Cassak and Shay (2007, 2008, 2009); Malakit et al. (2010); Borovsky and Hesse (2007); Birn, Borovsky, and Hesse (2008); *birn:2010; Pritchett (2008); Pritchett and Mozer (2009); Tanaka et al. (2008); Tanaka, Fujimoto, and Shinohara (2010); Aunai et al. (2013); Swisdak et al. (2003) Such conditions occur at Earth’s dayside magnetopause Phan and Paschmann (1996); *ku:1997; *paschmann:2013; Hasegawa et al. (2010) and magnetotail,Øieroset, Phan, and Fujimoto (2004) during turbulence,Servidio et al. (2009); *servidio:2010 in laboratory plasma experiments,Yamada et al. (1997); Murphy and Sovinec (2008); Beidler and Cassak (2011); Rogers and Zakharov (1995) and in the solar atmosphere.Linton (2006); Nakamura, Shibata, and Isobe (2012); Su and van Ballegooijen (2013); Murphy et al. (2012) Reconnection can also have asymmetric outflow,Murphy (2010); Murphy, Sovinec, and Cassak (2010); Murphy et al. (2012); Oka et al. (2008); *reeves:2010A; *Galsgaard:2002 as well as three-dimensional asymmetries. Katz et al. (2010); *Egedal:2011; *AlHachami:2010; *Pontin:2011:review; *lukin:2011; *Dorfman:2013; *wyper:2013
In this paper, we perform and analyze two-dimensional resistive MHD simulations of the plasmoid instability during asymmetric inflow magnetic reconnection. In Section II, we describe the numerical method and problem setup. In Section III, we present the simulation results and compare the nonlinear evolution of this instability during symmetric and asymmetric reconnection. In Section IV, we discuss how the onset criterion for this instability varies with asymmetry. Section V contains a discussion of the observational consequences of these simulations for the solar atmosphere, laboratory plasmas, and the magnetosphere. Section VI contains our discussion and conclusions.
II NUMERICAL METHOD AND PROBLEM SETUP
The NIMROD codeSovinec et al. (2004); Sovinec, King, and the NIMROD Team (2010) solves the equations of extended MHD using a finite element representation for two dimensions and a finite Fourier series expansion for the third dimension. In dimensionless form, the equations solved for the two-dimensional simulations reported in this paper are
| (1) | |||
| (2) | |||
| (3) | |||
| (4) | |||
| (5) |
where the variables are given by: , magnetic field; , bulk plasma velocity; , current density; , plasma density; , plasma pressure; , temperature; , kinematic viscosity; , an artificial density diffusivity; and , the ratio of specific heats. The heat source term includes Ohmic and viscous heating,
| (6) |
The heat flux vector is given by
| (7) |
where is a unit vector in the direction of the magnetic field. The parallel and perpendicular thermal diffusivities are given by and , respectively. The diffusivities are uniform and given by , , , , and . The normalizations are identical to those presented in Refs. Murphy, 2010; Murphy et al., 2012. Divergence cleaning is used to prevent the accumulation of divergence error.Sovinec et al. (2004)
The initial conditions consist of a perturbed asymmetric Harris sheet with uniform density and no guide field.Birn, Borovsky, and Hesse (2008); *birn:2010; Murphy et al. (2012) We define as the outflow direction, as the out-of-plane direction, and as the inflow direction. The initial equilibrium is given by
| (8) | |||||
| (9) | |||||
| (10) |
Here, controls the asymmetry of the magnetic field, is the initial thickness of the current sheet, and . Throughout this paper, the subscripts ‘L’ and ‘R’ correspond to the asymptotic initial amplitudes of fields for and , respectively, while the subscript ‘’ corresponds to . The ratio of the asymptotic upstream magnetic fields is given by
| (11) |
where we use the conventions that and such that . Because is a function of time, we compare simulations using instead. We take and for all simulations. Because is kept constant and is decreased for asymmetric cases, it is important to note that there is consequently less magnetic flux and energy available during asymmetric simulations. To maintain total pressure balance, plasma pressure is higher on the weak magnetic field side such that and when .
Each simulation is seeded with initial magnetic perturbations of the form
| (12) |
where
| (13) |
Multiple perturbations are used so that the initial conditions are not symmetric about . The simulations presented in Section III have stronger secondary initial perturbations than the simulations in Section IV.
The domain consists of by rectangular finite elements along the outflow and inflow directions, respectively. Sixth order finite elements are used for all simulations. The size of the computational domain is given by and , where varies between simulations and for all simulations. We model four different initial asymmetries: (with only considered in Section IV). For our largest simulations with , we use for , for , and for . We use no-slip, conducting wall boundaries for each upstream region. The simulations are periodic along the outflow direction; consequently, downstream pressure effects are likely to be more important than in simulations with open outflow boundary conditions.
During simulations with , significant mesh packing is required over a relatively small portion of the computational domain. During simulations with , most X-points slowly drift into the strong field upstream region.Cassak and Shay (2007); Murphy et al. (2012) Consequently, high resolution along the inflow direction is required over a larger portion of the domain. Relatively high resolution is required along the outflow direction for all plasmoid unstable simulations so that secondary reconnection associated with island merging can be sufficiently resolved. Insufficient resolution often yields spurious nulls as a result of numerical dispersion error (see also Ref. Wan et al., 2013). The resolution requirements along the outflow direction are most stringent for cases with . Higher resolution is required in the weak field upstream region than in the strong field upstream region. When initializing these simulations, we chose to increase resolution in the current sheet region to ensure convergence rather than increasing ; consequently, the late-time evolution of asymmetric simulations is impacted somewhat by the conducting wall boundary on the weak magnetic field side.
During the initial simulations performed for this study, we used relatively large amplitude symmetric initial perturbations with a characteristic length scale comparable to the size of the computational domain. Simulations starting from these initial conditions showed plasma sloshing back and forth along the inflow direction, suggesting that there was a large-scale pressure imbalance in our initial conditions. As an analogy, consider two regions of antiparallel magnetic field that are initially in total pressure equilibrium but have different magnetic field amplitudes, and with . Then suppose that the magnetic field strength in each region is decreased by . The weak magnetic field region will then have a total pressure that is greater than the strong magnetic field side, resulting in a large-scale force imbalance. We greatly reduced the sloshing behavior by using localized, small amplitude initial perturbations.
For symmetric simulations, it is straightforward to find magnetic and velocity nulls located on the symmetry axis, . To determine the null positions, we find neighboring grid points between which the signs of or change and apply Brent’s method.Brent (1973) Brent’s method combines the robustness of bisection and root bracketing for ill-behaved functions while using inverse quadratic interpolation which converges quickly for well-behaved functions. The finite element basis functions are used to interpolate between grid points. Magnetic nulls are classified as X-type if and O-type if .
For asymmetric simulations and to find nulls not located along the symmetry axis during symmetric simulations, we combine several techniques to find magnetic and velocity nulls. First, we search for grid cells with changes in sign for both components of the vector field while excluding cells along the conducting wall boundaries. Second, we use bilinear interpolationHaynes and Parnell (2007) to provide an initial approximation for the null position. We exclude cases where the inferred location is outside the grid cell boundary. Rarely, this step finds multiple nulls within the same grid cell. While bilinear or trilinear interpolation is highly appropriate for simulations with fields defined only at discrete locations, higher order accuracy can be obtained for NIMROD simulations by interpolating the finite element basis functions. Our third step is to perform a few iterations of the method of steepest descent on the magnitude of the vector field. This method is robust but converges slowly. Fourth, we use Broyden’s methodBroyden (1965) to converge on the null position. If Broyden’s method does not converge, we alternate between the third and fourth steps until convergence is achieved. To classify magnetic nulls, we define a matrix with elements . The null is X-type if and O-type if .Parnell et al. (1996)
Finally, we define several quantities to facilitate our analysis and comparisons between different simulations. When investigating the scaling of asymmetric inflow reconnection, Refs. Cassak and Shay, 2007; Swisdak and Drake, 2007 derived that the outflow velocity scales as a hybrid Alfvén speed that is a function of the magnetic field strengths and densities in both upstream regions,
| (14) |
This simplifies to when and . This corresponds to for , for , for , and for . Throughout this paper, we use the convention
| (15) |
to account for the current sheet not extending the entire distance along the outflow direction. Using these quantities, we define the hybrid Lundquist number to beMurphy et al. (2012)
| (16) |
The reconnection rate for collisional asymmetric reconnection without plasmoids is predicted to be Cassak and Shay (2007)
| (17) |
Using our conventions that , , and , we find that
| (18) |
This expression is an exact result for our conventions and our use of dimensionless parameters, but should not be considered a general result.
To describe the dynamics of X-points and O-points, we define as the position of a magnetic null. The plasma flow velocity at the null is . The time derivative of the null’s position is . In resistive MHD, differences between and must be due to resistive diffusion of the magnetic field. In general, when asymmetry is present and . For O-points, we have generally found that . For X-points, the difference can be a non-negligible fraction of the nearby Alfvén speed. Murphy (2010); Murphy et al. (2012) During X-line retreat in resistive MHD, Ref. Murphy, 2010 has shown that the physical mechanism behind this difference is resistive diffusion of the inflow component of the magnetic field along the inflow direction.
III SIMULATION RESULTS
In this section, we compare simulations of the plasmoid instability during symmetric inflow reconnection and asymmetric inflow reconnection.
III.1 Nonlinear Dynamics
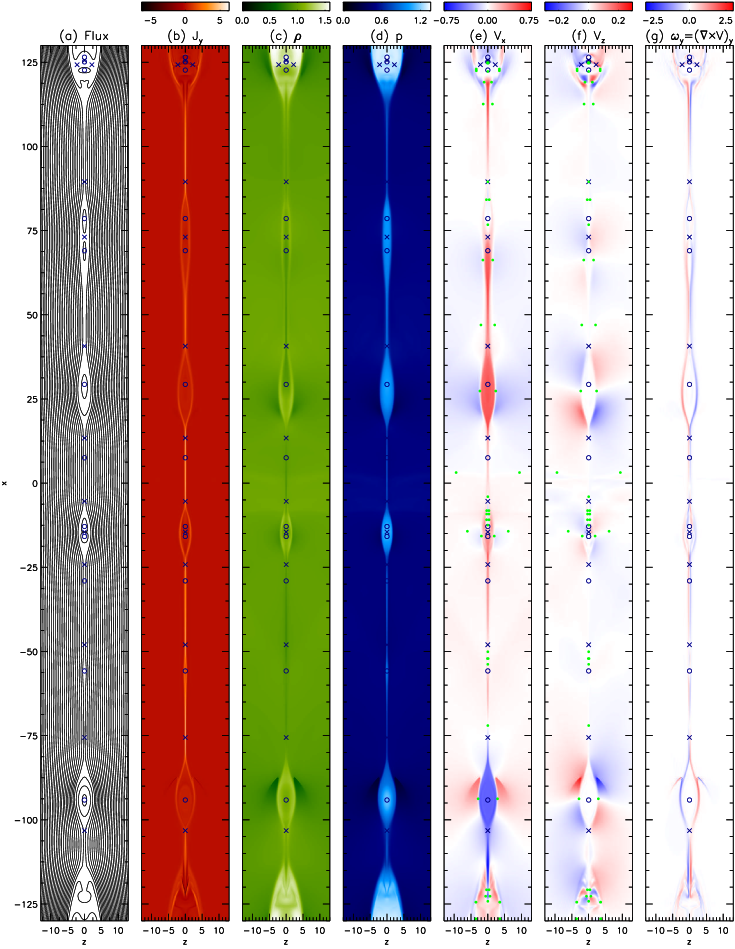
During the plasmoid instability with symmetric inflow (Fig. 1), the X-points and O-points within the current sheet region are located along because of symmetry. Some X-points and O-points develop away from in the downstream region away from the current sheet. Within the current sheet, the outflow jets impact each island directly so that momentum from the jets is transported efficiently into the islands. The islands do not develop net vorticity [Fig. 1(g)]. The quadrupole structure in around large islands corresponds to upstream plasma being temporarily pushed out of the way as the island moves along with the reconnection outflow; this also corresponds to reverse flow in in the upstream region as plasma flows back to fill the area behind the moving island. The flow patterns in the outflow region show some degree of order because of the assumption of symmetry, and thus are not best described as being turbulent [Figs. 1(e) and 1(f); cf. Ref. Mei et al., 2012]. There exist several flow stagnation points (in the simulation reference frame) along as well as symmetrically in both upstream regions. Often, flow stagnation points along the symmetry axis are located between an X-point and a more central maximum in plasma pressure. This occurs because flow stagnation points preferentially occur where pressure gradient and tension forces cancel.Murphy, Sovinec, and Cassak (2010); Murphy (2010) Individual X-points are often located in proximity to a neighboring magnetic island so that the small-scale reconnection has asymmetric outflow. The plasma flow velocity at each individual X-point differs somewhat from the velocity of each X-point [] such that there is net plasma flow across each X-point.Murphy (2010)
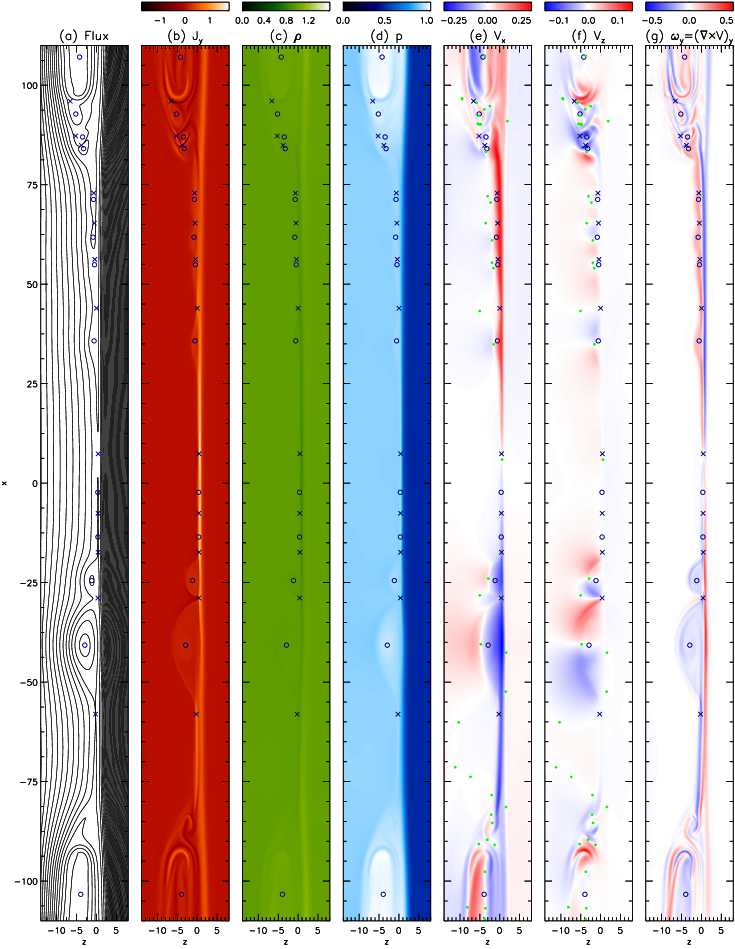
There exist many qualitative differences between the symmetric and asymmetric plasmoid instability (Fig. 2). In contrast to the symmetric case, the positions along the inflow direction of the X-points and O-points in the current sheet are not constrained to . The X-points generally drift slowly into the strong field upstream region. Cassak and Shay (2007); Murphy et al. (2012) In general, the X-points closer to are displaced more into the strong field upstream region than X-points in the periphery. When islands merge with each other or the large island downstream of the reconnection region, X-points sometimes end up being displaced into the weak field upstream region. Because of field line rigidity, very little happens in the strong field upstream region.
The most apparent feature of the plasmoid instability during asymmetric inflow reconnection is that the plasmoids develop preferentially into the weak field upstream region [Fig. 2(a)]. The effect has been noted in prior simulations of asymmetric inflow reconnection without secondary island formation.Ugai (2000); Cassak and Shay (2007); Pritchett (2008); Murphy et al. (2012) Reconnection outflow jets therefore impact islands obliquely rather than directly. This has two main consequences for the structure and dynamics of individual plasmoids. First, the islands develop net vorticity as seen in Fig. 2(g). This effect has been observed in prior simulations of line-tied asymmetric reconnection.Murphy et al. (2012) Second, momentum transport from the reconnection outflow jets into the islands is less efficient. The reconnection outflow is able to partially bypass the islands. Consequently, the islands that form during asymmetric inflow reconnection have slower velocities relative to . For the largest cases with , islands propagate at velocities of for and at velocities of for . Islands that develop in asymmetric simulations therefore remain in the current sheet for significantly longer.
Secondary merging events occur during both symmetric and asymmetric simulations when two islands reconnect with each other to form a single island. The flux contained in the resulting island equals the greater of the two initial fluxes.Fermo, Drake, and Swisdak (2010) An example of secondary merging during a symmetric simulation is the X-point at between two neighboring magnetic islands in Figure 1 (see also the X-point at for an earlier stage of secondary merging). During symmetric simulations, the outflow from secondary reconnection events is symmetric, but the inflow is generally asymmetric because merging islands typically have different sizes. The secondary outflow jets are impeded symmetrically by the upstream magnetic field. Prior scaling studies show that symmetric obstructions reduce the reconnection rate much more effectively than when only one outflow jet is obstructed. Murphy, Sovinec, and Cassak (2010) However, because there is no freedom for plasmoids to roll around each other, secondary reconnection is able to be more effective.
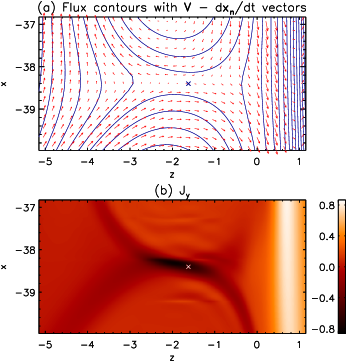
During simulations with , the reconnection process has asymmetry along both the inflow and outflow directions. An instance of secondary merging late in the simulation with and is shown in Fig. 3. The characteristic magnetic field strength is in the island, which corresponds to a local upstream Alfvén speed of given that . At this time, , , and ; this indicates that the net plasma flow across the X-point along the direction is of the local upstream Alfvén speed. The tilting of the current sheet occurs because the island below is larger than the island above.
The most important feature of this secondary reconnection is the flow pattern shown in Fig. 3(a) in the reference frame of the moving X-point. The characteristic inflow/outflow pattern typically associated with two-dimensional resistive reconnection is absent. In contrast, the flow pattern in the current sheet region is dominated by shear flow associated with the vorticity in the islands. The magnitude of the shear flow is comparable to the local upstream Alfvén speed (rather than the hybrid Alfvén speed), which has been shown to suppress and slow down the reconnection process. Chen and Morrison (1990); *QChen:1997; *LaHaye:2010; *JHLi:2010; *cassak:2011A; *cassak:2011B The merging process began around [when the X-point between these two islands first had ] and was not quite complete by the end of the simulation at . This velocity shear does not occur during secondary merging in symmetric simulations because those islands lack net vorticity.
III.2 Reconnection Rate
A key result from two-dimensional resistive MHD simulations of the symmetric plasmoid instability is that the reconnection rate becomes insensitive to the Lundquist number for . We now investigate how the reconnection rate is impacted by magnetic asymmetry during the plasmoid instability.
We define the reconnection rate, , to be the maximum out-of-plane electric field among all X-points within the current sheet, . This directly represents the amount of flux being reconnected at the most active X-point. An alternative method used for symmetric simulations is to compare the inflow velocity to the outflow velocity; however, this results in some ambiguity for asymmetric inflow simulations because X-points drift at different velocities along the inflow direction, and the inflow velocities differ in each upstream region.
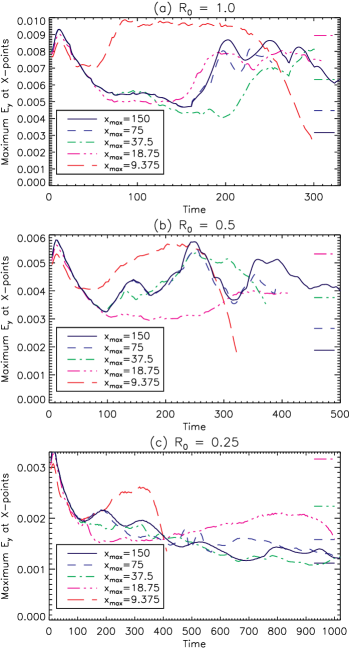
Fig. 4 shows the reconnection rate over time for simulations with different magnetic asymmetries, , and different domain sizes, . Plasmoids develop for all simulations with , but do not develop or are not important for simulations with . At , is large because the initial current sheet is thin, so we concentrate our analysis on after reconnection develops.
We use two strategies to compare the reconnection rates between different simulations. The first strategy is to compare small and large simulations directly, without considering predicted values for the reconnection rate. Nominally, the effects not included in theoretical models such as viscosity, thermal conduction, and downstream pressure will have similar consequences in each simulation. The second strategy is to compare with the predicted value given by Eq. 18. This method allows us to determine the extent to which additional factors are responsible for slowing down the reconnection rate.
In symmetric simulations [Fig. 4(a)], the peak reconnection rate is only weakly sensitive to changes in the domain size (and therefore Lundquist number). The peak reconnection rate for is comparable to the peak reconnection rate for . For cases without plasmoids, Eq. 18 overpredicts the reconnection rate. This indicates that effects not included in the derivation of this equation slow down reconnection. Overall, this result corroborates the reconnection rate enhancement due to the plasmoid instability found in previous works. Bhattacharjee et al. (2009); Huang and Bhattacharjee (2010); Shen, Lin, and Murphy (2011); Loureiro et al. (2012) The reconnection rate levels off at .
For [Fig. 4(b)], the results are qualitatively similar to . The peak reconnection rates are comparable among most simulations. The exception is which has a slower reconnection rate than the rest of the simulations. The plasmoid instability continues to show enhancement of the reconnection rate for this asymmetry. The reconnection rate levels off between about and , which is consistent with what one would expect from the symmetric results and the scaling for our simulation setup that .
There are some qualitative differences for [Fig. 4(c)]. The peak reconnection rates for the cases without plasmoids are higher than the cases with plasmoids. However, the reconnection rates for the three cases with plasmoids are comparable, indicating that the reconnection rate is leveling off as the domain size is increased. Therefore, we conclude that there remains enhancement of the reconnection rate due to the plasmoid instability. However, when we compare to the predicted values from Eq. 18, the reconnection rates from the simulation are generally much lower. For the largest two domain sizes, the prediction becomes comparable to the simulation results. The reconnection rate levels off at between about and , compared to the value of expected from scaling the symmetric case.
Overall, we conclude that the reconnection rate is still enhanced due to the plasmoid instability at least for asymmetries of . However, for , the reconnection rate levels off at a lower value than would be inferred from the symmetric results. For low to moderate asymmetries, the enhancement in the reconnection rate is comparable to what would be expected from scaling the symmetric case.
IV ONSET OF INSTABILITY
In this section, we perform a grid of nonlinear simulations with different domain sizes and magnetic asymmetries to investigate the onset criterion of the plasmoid instability during symmetric and asymmetric inflow magnetic reconnection. We vary the initial magnetic asymmetry, , and the size of the computational domain along the outflow direction, . We place a single perturbation at the origin, and a much smaller perturbation off to one side to allow outflow asymmetry. Simulations are classified as unstable if new X-points appear in the current sheet region before . If no new X-points form, then the simulations are classified as stable. For a given asymmetry, the smallest unstable simulation typically yields only short-lived islands that exit the current sheet and merge with the main outflow island soon after formation. The results of this parameter study are shown in Fig. 5.
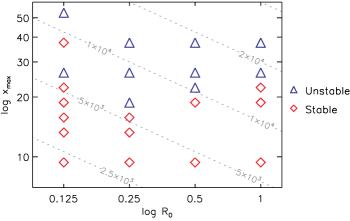
For symmetric cases, we find the critical Lundquist number to be . This is somewhat smaller than the Huang et al.Huang and Bhattacharjee (2010) value of , comparable to Loureiro et al.Loureiro et al. (2012) value of , and larger than the values reported by Ni et al.Ni et al. (2012a) and Shen et al.Shen, Lin, and Murphy (2011) The differences between these values occur in part because the onset criterion depends on the configuration and plasma parameters as well as the Lundquist number.
For asymmetric cases, we initially hypothesized that plasmoids form when the hybrid Lundquist number exceeds a critical value, , which is a constant and not a function of asymmetry. This hypothesis predicts system sizes for which the symmetric case is unstable and asymmetric cases are stable, and that the demarcation between stable and unstable configurations are aligned with a contour of constant . However, Fig. 5 indicates that this hypothesis is incorrect.
Figure 5 shows that plasmoids form for smaller domain sizes when there is a moderate magnetic asymmetry, , than when there is symmetry, . For , , , and , the smallest unstable domain sizes are , , , and , respectively. In contrast to our hypothesis, moderate magnetic asymmetry is somewhat destabilizing for the plasmoid instability.
Anomalously, the simulation with and does not show plasmoid formation out to despite new X-lines forming in a smaller simulation with . New X-lines do appear for . When the simulations with were repeated with different initial perturbations, none of them showed evidence for plasmoid formation for . These results suggest that strong magnetic asymmetry () is stabilizing.
We now consider possibilities for why moderate magnetic asymmetry cases show plasmoid formation for shorter domain sizes than symmetric cases. Our first hypothesis was that there was simply inadequate time for plasmoids in the symmetric case to form. To test this, we ran the largest stable symmetric simulation (with and ) twice as long. No new X-points developed in the extended run of this simulation, so this hypothesis is not supported. Our second hypothesis was that the difference in the flow properties led to the difference in the onset domain size. This could be caused by either the outflow being slower such that there is more time for instabilities to develop, or that there will be less shear flow stabilization for cases with slower outflow. We test this hypothesis by repeating the largest stable and smallest unstable simulations for different asymmetries with and instead of (where is the magnetic Prandtl number). In contrast to the prediction of this hypothesis, higher viscosity leads to larger domain sizes becoming stable. This hypothesis is not supported; however, an important caveat is that changing the viscosity affects the structure of the diffusion region as well as slowing down the outflow. The results do not rule out an alternative hypothesis that the development of the instability is correlated with intermittency in the flow.
The results from this parameter study do not explain why simulations with moderate asymmetry are unstable for smaller domain sizes than symmetric cases, or why strongly asymmetric simulations are more stable. Some insight may be gained by performing a linear stability analysis for the plasmoid instability during asymmetric inflow reconnection, including an asymptotic matching analysis and linear simulations,Dubois and Samain (1979); *einaudi:1984; *ding:1992; Furth, Killeen, and Rosenbluth (1963); Loureiro, Schekochihin, and Cowley (2007); Ni et al. (2010) to see how the growth rate and eigenmode structure are modified by magnetic asymmetry.
V OBSERVATIONAL CONSEQUENCES
In this section, we make observational predictions for the behavior of plasmoids in solar, laboratory, and space plasmas during asymmetric inflow reconnection. Differences between simulation and observation will provide key insights into the roles of important effects not included in the simulations, such as collisionless effects and three-dimensional effects.
V.1 Solar Atmosphere
The standard model of solar eruptions predicts the formation of an elongated current sheet in the wake behind the rising flux rope. Lin and Forbes (2000) While unambiguous identification of these structures is difficult without magnetic field information, several features classified as current sheets have been observed in the solar corona. Ko et al. (2003); *takasao:2012; Ciaravella et al. (2002); *webb:2003; *jlin:2005; *ciaravella:2008; *schettino:2010; *savage:2010; *reeves:2011; *landi:2012; *savage:2012B; *ciaravella:2013 These current sheets necessarily have asymmetric outflow and may have asymmetric inflow. Murphy et al. (2012); Su and van Ballegooijen (2013) Large blobs are frequently observed during these events Ko et al. (2003); *takasao:2012 which have been interpreted to be the result of a tearing or plasmoid instability.Riley et al. (2007); *jLin:2007 ‘Monster plasmoids’ such as those predicted by Ref. Uzdensky, Loureiro, and Schekochihin, 2010 are the most likely features to be observed.
In principle, an offset of blobs toward the weak field upstream region could be seen with instruments such as the Atmospheric Imaging Assembly (AIA) on the Solar Dynamics Observatory, the X-Ray Telescope on Hinode, and the Large Angle and Spectrometric Coronagraph (LASCO) on the Solar and Heliospheric Observatory. However, if the current sheet is observed at a small angle with respect to the line of sight, then blobs that are physically offset might not show an apparent offset due to projection effects. Constraints on the overall geometry are therefore vital. High-resolution, high-cadence observations by AIA have been used to investigate vorticity in current sheet features at low heights, McKenzie, David E. and it may be possible to find evidence for vorticity in current sheet blobs. However, the time cadence of LASCO observations is too slow to observe vorticity on the scales of individual blobs.
Asymmetric reconnection also occurs during solar jets, Nakamura, Shibata, and Isobe (2012) which happen when newly emerged flux reconnects with pre-existing, overlying flux. Yokoyama and Shibata (1996); *shibata:2007 The pre-existing flux is usually weaker, so our simulations predict plasmoid development preferentially into that region as well as the associated vortical motions. However, the spatial and temporal resolution requirements to observe small-scale structure and vortical motions during jet reconnection are likely beyond the capabilities of current instrumentation.
V.2 Laboratory Experiments
The current generation of dedicated laboratory experiments on magnetic reconnection are stable or marginally stable against the formation of multiple plasmoids or flux ropes. Ji and Daughton (2011) There is hope that the next generation of reconnection experiments will have to allow the plasmoid instability to be investigated in the laboratory. If the geometry is toroidal or cylindrical, then the reconnection process will necessarily have asymmetric inflow unless the radius is very large. In the Magnetic Reconnection Experiment (MRX), reconnection is driven by ramping up or down currents carried within toroidal flux cores. During the ‘pull’ mode of operation (see Fig. 5 of Ref. Yamada et al., 1997), the low radius side of the current sheet has stronger magnetic field than the high radius upstream region, and the current sheet gradually drifts toward lower radii.Yamada (2011); Lukin and Jardin (2003); Murphy and Sovinec (2008)
It is therefore likely that the effects discussed in this paper will play some role in the dynamics of the plasmoid instability in future experiments. The asymmetry is not expected to be large, so the effects are not likely to be as pronounced as in the simulations. For future experiments with configurations similar to MRX but with , our simulations predict the development of flux ropes preferentially into the high radius upstream region and and the development of net vorticity. The current sheet is expected to drift toward lower radii where the magnetic field is stronger. Secondary reconnection is expected to be less efficient than predicted by two-dimensional, symmetric simulations because of the freedom of flux ropes to roll around each other, especially in the downstream region. However, these predictions are likely to be modified due to cylindrical geometry effects not included in our paper. Simulations of the plasmoid instability in an experimental geometry will allow direct comparisons to be made (see also Refs. Murphy and Sovinec, 2008; Lukin and Jardin, 2003; Dorfman et al., 2008; Lukin et al., 2001).
V.3 Space Plasmas
Plasmoids and flux ropes are frequently observed in situ during reconnection events in planetary magnetospheres and the solar wind. Reconnection events at the dayside magnetopause and its flanks have asymmetric inflow. Phan and Paschmann (1996); *ku:1997; *paschmann:2013; Hasegawa (2012) In contrast to our two-dimensional resistive MHD simulations with an antiparallel magnetic field configuration, reconnection in near-Earth space plasmas is in the collisionless regime. Øieroset et al. (2001); Øieroset, Phan, and Fujimoto (2004); Mozer et al. (2008) There is often a guide field, and shear flow effects are often important for dayside reconnection. La Belle-Hamer, Otto, and Lee (1995) There is also density asymmetry along with magnetic asymmetry.
For these reasons, we anticipate that there will be significant qualitative differences between our simulations and in situ observations of asymmetric reconnection at the dayside magnetopause. Nevertheless, some of the macroscopic features of our simulations may remain applicable during collisionless asymmetric inflow reconnection. Island development into the weak field upstream region is in principal observable; pragmatically, this will be difficult to diagnose because of the limited number of spacecraft taking measurements. More promising are measurements of vorticity in secondary flux ropes formed by reconnection (see Ref. Hasegawa, 2012 and references therein), but care will be needed to distinguish these features from Kelvin-Helmholtz vortices. To allow more direct comparisons to in situ observations, it will be important to extend recently performed two-fluid, Cassak and Shay (2008, 2009) hybrid, Aunai et al. (2013) and fully kineticSwisdak et al. (2003); Pritchett (2008); Pritchett and Mozer (2009); Malakit et al. (2010); Tanaka, Fujimoto, and Shinohara (2010); Aunai et al. (2013) simulations of asymmetric inflow reconnection to investigate the dynamics of secondary islands and flux ropes.
VI DISCUSSION
In this paper, we perform resistive MHD simulations of the plasmoid instability during magnetic reconnection with asymmetric upstream magnetic fields. This is in contrast to most studies of the plasmoid instability which assume that the reconnection process is symmetric. Relaxing the assumption of symmetric inflow leads to qualitatively different results.
During symmetric simulations, the X-points and O-points within the current sheet region are located along the symmetry axis so that momentum from the outflow jets is efficiently transported into the islands. Secondary islands within the current sheet do not develop net vorticity and are advected quickly out of the current sheet. Secondary reconnection events associated with island merging have symmetric outflow but asymmetric inflow. In the downstream region, some X-points and O-points are located away from the symmetry axis. Because of the assumption of symmetry, the flow pattern in the downstream region is structured and therefore not best described as being turbulent.
During asymmetric simulations, the locations of the X-points and O-points are offset from each other along the inflow direction. There is generally slow drifting of the current sheet into the strong field upstream region. X-points near the center of the sheet are displaced further into the strong field upstream region than X-points near the current sheet exits. Not much happens in the strong field upstream region because of field line rigidity. Islands develop preferentially into the weak field upstream region. Consequently, outflow jets impact the islands obliquely rather than directly so that net vorticity develops and momentum transport into the islands is less efficient. During secondary reconnection, shear flow associated with vorticity in the merging islands slows down reconnection. The downstream regions develop a complicated flow structure indicative of turbulence, with islands able to roll around each other as well as merge.
We compare the reconnection rate enhancement between symmetric and asymmetric cases. During high Lundquist number symmetric simulations, the reconnection rate is enhanced above the value predicted from the Sweet-Parker model. This is consistent with previous work.Bhattacharjee et al. (2009); Huang and Bhattacharjee (2010); Shen, Lin, and Murphy (2011); Loureiro et al. (2012) During simulations with a magnetic asymmetry of , the reconnection rate enhancement is comparable to what is expected from scaling the symmetric simulations. For stronger asymmetry (), the reconnection rate is still enhanced by the presence of plasmoids in the current sheet, but to less of a degree than for . Scaling from the symmetric simulations to cases overpredicts the reconnection rate.
We perform an onset study of the plasmoid instability for both symmetric and asymmetric inflow reconnection. For the symmetric case, we find that the critical Lundquist number for the onset of the instability is . This is consistent with the canonical result that onset occurs when the Lundquist number is of order . Interestingly, we find that there exist domain sizes for which the symmetric case is stable but moderate asymmetry cases (e.g., ) are unstable. This suggests that moderate asymmetry has a destabilizing influence on the formation of plasmoids. However, our results indicate that strong asymmetry (e.g., ) has a stabilizing influence.
We predict observational consequences for the asymmetric plasmoid instability in the solar atmosphere, laboratory experiments, and space plasmas. The most likely characteristics to be observed are the development of islands preferentially into the weak field upstream region and vorticity in the plasmoids. In the solar atmosphere, high spatial and temporal resolution will be required and projection effects will make interpretation difficult. Future laboratory experiments may naturally have asymmetric inflow due to cylindrical geometry effects, although the asymmetry may be relatively modest. In situ observations of flux ropes formed during asymmetric inflow reconnection at Earth’s dayside magnetopause provide an opportunity to test predictions based on vorticity of secondary islands; however, collisionless effects not included in our simulations are expected to be important. For all of these situations, discrepancies between simulations and observations will provide insight into the roles of three-dimensional and collisionless effects.
Our simulations of the plasmoid instability during asymmetric inflow reconnection hint at the nature of this instability in three dimensions. In particular, outflow jets from individual, small-scale reconnection sites are more likely to impact flux ropes obliquely rather than directly. This may cause momentum transport from the jets into the flux ropes to be less efficient and vorticity in the flux ropes to develop. Vorticity in flux ropes may lead to shear flow stabilization when flux ropes merge. Consequently, secondary merging of flux ropes formed by the plasmoid instability should not necessarily be assumed to be efficient (see also Ref. Intrator et al., 2009; *sun:2010). As in the downstream region of our asymmetric simulations, flux ropes will likely have additional freedom to roll around each other while merging or instead of merging. However, further study of the three-dimensional plasmoid instability will be required before solid conclusions can be drawn.
There remain several open questions and promising areas of future work regarding the plasmoid instability during both symmetric and asymmetric inflow magnetic reconnection. Thus far, no analytical theory exists that describes the linear properties of the plasmoid instability during asymmetric inflow reconnection; however, the effects of asymmetry on the tearing mode have been investigated.Dubois and Samain (1979); *einaudi:1984; *ding:1992 The role of collisionless effects and the transition to collisionless reconnection have been investigated for the symmetric plasmoid instability Shepherd and Cassak (2010); Huang, Bhattacharjee, and Sullivan (2011) but not for the asymmetric case. The role of three-dimensional effects during the plasmoid instability requires further study. Additional investigation of the role of a guide field will provide more insight into real situations, especially for three-dimensional and fully kinetic simulations. Statistical models of magnetic islands in current sheets Uzdensky, Loureiro, and Schekochihin (2010); Fermo, Drake, and Swisdak (2010); Loureiro et al. (2012); Huang and Bhattacharjee (2012) will need to be extended in order to incorporate asymmetry and three-dimensional effects.
Acknowledgements.
The authors thank A. Bhattacharjee, P. A. Cassak, T. G. Forbes, L. Guo, Y.-M. Huang, K. E. Korreck, N. F. Loureiro, M. Oka, J. C. Raymond, K. K. Reeves, S. L. Savage, L. S. Shepherd, C. R. Sovinec, and H. D. Winter for useful discussions. The authors thank members of the NIMROD team for ongoing code development that helped make this work possible. In particular, we thank J. King for suggesting memory management strategies that allowed larger simulations to be performed. Resources supporting this work were provided by the NASA High-End Computing (HEC) Program through the NASA Advanced Supercomputing (NAS) Division at Ames Research Center. This research has benefited greatly from the use of NASA’s Astrophysics Data Service. This research was supported by NASA grants NNX09AB17G, NNX11AB61G, and NNX12AB25G; NASA contract NNM07AB07C; and NSF SHINE grant AGS-1156076 to the Smithsonian Astrophysical Observatory. A.K.Y. acknowledges support from the NSF-REU solar physics program at the Center for Astrophysics, grant number ATM-0851866.References
- Sweet (1958) P. A. Sweet, in Electromagnetic Phenomena in Cosmical Physics, IAU Symposium, Vol. 6, edited by B. Lehnert (1958) p. 123.
- Parker (1957) E. N. Parker, J. Geophys. Res. 62, 509 (1957).
- Parker (1963) E. N. Parker, Astrophys. J. Supp. 8, 177 (1963).
- Loureiro, Schekochihin, and Cowley (2007) N. F. Loureiro, A. A. Schekochihin, and S. C. Cowley, Phys. Plasmas 14, 100703 (2007).
- Baalrud et al. (2011) S. D. Baalrud, A. Bhattacharjee, Y.-M. Huang, and K. Germaschewski, Phys. Plasmas 18, 092108 (2011).
- Baalrud, Bhattacharjee, and Huang (2012) S. D. Baalrud, A. Bhattacharjee, and Y.-M. Huang, Phys. Plasmas 19, 022101 (2012).
- Ni et al. (2010) L. Ni, K. Germaschewski, Y.-M. Huang, B. P. Sullivan, H. Yang, and A. Bhattacharjee, Phys. Plasmas 17, 052109 (2010).
- Bhattacharjee et al. (2009) A. Bhattacharjee, Y.-M. Huang, H. Yang, and B. Rogers, Phys. Plasmas 16, 112102 (2009).
- Samtaney et al. (2009) R. Samtaney, N. F. Loureiro, D. A. Uzdensky, A. A. Schekochihin, and S. C. Cowley, Phys. Rev. Lett. 103, 105004 (2009).
- Huang and Bhattacharjee (2010) Y.-M. Huang and A. Bhattacharjee, Phys. Plasmas 17, 062104 (2010).
- Huang, Bhattacharjee, and Sullivan (2011) Y.-M. Huang, A. Bhattacharjee, and B. P. Sullivan, Phys. Plasmas 18, 072109 (2011).
- Ni et al. (2012a) L. Ni, U. Ziegler, Y.-M. Huang, J. Lin, and Z. Mei, Phys. Plasmas 19, 072902 (2012a).
- Ni et al. (2012b) L. Ni, I. I. Roussev, J. Lin, and U. Ziegler, Astrophys. J. 758, 20 (2012b).
- Shepherd and Cassak (2010) L. S. Shepherd and P. A. Cassak, Phys. Rev. Lett. 105, 015004 (2010).
- Bárta et al. (2011) M. Bárta, J. Büchner, M. Karlický, and J. Skála, Astrophys. J. 737, 24 (2011).
- Shen, Lin, and Murphy (2011) C. Shen, J. Lin, and N. A. Murphy, Astrophys. J. 737, 14 (2011).
- Mei et al. (2012) Z. Mei, C. Shen, N. Wu, J. Lin, N. A. Murphy, and I. I. Roussev, Mon. Not. R. Astron. Soc. 425, 2824 (2012).
- Furth, Killeen, and Rosenbluth (1963) H. P. Furth, J. Killeen, and M. N. Rosenbluth, Phys. Fluids 6, 459 (1963).
- Coppi et al. (1976) B. Coppi, R. Galvão, R. Pellat, M. Rosenbluth, and P. Rutherford, Sov. J. Plasma Phys. 2, 533 (1976).
- Biskamp (1986) D. Biskamp, Phys. Fluids 29, 1520 (1986).
- Baty (2012) H. Baty, Phys. Plasmas 19, 092110 (2012).
- Loureiro et al. (2012) N. F. Loureiro, R. Samtaney, A. A. Schekochihin, and D. A. Uzdensky, Phys. Plasmas 19, 042303 (2012).
- Uzdensky, Loureiro, and Schekochihin (2010) D. A. Uzdensky, N. F. Loureiro, and A. A. Schekochihin, Phys. Rev. Lett. 105, 235002 (2010).
- Huang and Bhattacharjee (2012) Y.-M. Huang and A. Bhattacharjee, Phys. Rev. Lett. 109, 265002 (2012).
- Fermo, Drake, and Swisdak (2010) R. L. Fermo, J. F. Drake, and M. Swisdak, Phys. Plasmas 17, 010702 (2010).
- Dere (1996) K. P. Dere, Astrophys. J. 472, 864 (1996).
- Qiu et al. (2002) J. Qiu, J. Lee, D. E. Gary, and H. Wang, Astrophys. J. 565, 1335 (2002).
- Isobe, Takasaki, and Shibata (2005) H. Isobe, H. Takasaki, and K. Shibata, Astrophys. J. 632, 1184 (2005).
- Jing et al. (2005) J. Jing, J. Qiu, J. Lin, M. Qu, Y. Xu, and H. Wang, Astrophys. J. 620, 1085 (2005).
- Nagashima and Yokoyama (2006) K. Nagashima and T. Yokoyama, Astrophys. J. 647, 654 (2006).
- Narukage and Shibata (2006) N. Narukage and K. Shibata, Astrophys. J. 637, 1122 (2006).
- La Belle-Hamer, Otto, and Lee (1995) A. L. La Belle-Hamer, A. Otto, and L. C. Lee, J. Geophys. Res. 100, 11875 (1995).
- Ugai (2000) M. Ugai, Phys. Plasmas 7, 867 (2000).
- Cassak and Shay (2007) P. A. Cassak and M. A. Shay, Phys. Plasmas 14, 102114 (2007).
- Cassak and Shay (2008) P. A. Cassak and M. A. Shay, Geophys. Res. Lett. 35, 19102 (2008).
- Cassak and Shay (2009) P. A. Cassak and M. A. Shay, Phys. Plasmas 16, 055704 (2009).
- Malakit et al. (2010) K. Malakit, M. A. Shay, P. A. Cassak, and C. Bard, J. Geophys. Res. 115, A10223 (2010).
- Borovsky and Hesse (2007) J. E. Borovsky and M. Hesse, Phys. Plasmas 14, 102309 (2007).
- Birn, Borovsky, and Hesse (2008) J. Birn, J. E. Borovsky, and M. Hesse, Phys. Plasmas 15, 032101 (2008).
- Birn et al. (2010) J. Birn, J. E. Borovsky, M. Hesse, and K. Schindler, Phys. Plasmas 17, 052108 (2010).
- Pritchett (2008) P. L. Pritchett, J. Geophys. Res. 113, 6210 (2008).
- Pritchett and Mozer (2009) P. L. Pritchett and F. S. Mozer, J. Geophys. Res. 114, 11210 (2009).
- Tanaka et al. (2008) K. G. Tanaka, A. Retinò, Y. Asano, M. Fujimoto, I. Shinohara, A. Vaivads, M. Khotyaintsev, Y. André, M. B. Bavassano-Cattaneo, S. C. Buchert, and C. J. Owen, Ann. Geophys. 26, 2471 (2008).
- Tanaka, Fujimoto, and Shinohara (2010) K. G. Tanaka, M. Fujimoto, and I. Shinohara, Int. J. Geophys. 2010, 202583 (2010).
- Aunai et al. (2013) N. Aunai, M. Hesse, S. Zenitani, M. Kuznetsova, C. Black, R. Evans, and R. Smets, Phys. Plasmas 20, 022902 (2013).
- Swisdak et al. (2003) M. Swisdak, B. N. Rogers, J. F. Drake, and M. A. Shay, J. Geophys. Res. 108, 1218 (2003).
- Phan and Paschmann (1996) T. D. Phan and G. Paschmann, J. Geophys. Res. 101, 7801 (1996).
- Ku and Sibeck (1997) H. C. Ku and D. G. Sibeck, J. Geophys. Res. 102, 2243 (1997).
- Paschmann, Øieroset, and Phan (2013) G. Paschmann, M. Øieroset, and T. Phan, Space Sci. Rev. , 1 (2013).
- Hasegawa et al. (2010) H. Hasegawa, J. Wang, M. W. Dunlop, Z. Y. Pu, Q.-H. Zhang, B. Lavraud, M. G. G. T. Taylor, O. D. Constantinescu, J. Berchem, V. Angelopoulos, J. P. McFadden, H. U. Frey, E. V. Panov, M. Volwerk, and Y. V. Bogdanova, Geophys. Res. Lett. 37, 16101 (2010).
- Øieroset, Phan, and Fujimoto (2004) M. Øieroset, T. D. Phan, and M. Fujimoto, Geophys. Res. Lett. 31, 12801 (2004).
- Servidio et al. (2009) S. Servidio, W. H. Matthaeus, M. A. Shay, P. A. Cassak, and P. Dmitruk, Phys. Rev. Lett. 102, 115003 (2009).
- Servidio et al. (2010) S. Servidio, W. H. Matthaeus, M. A. Shay, P. Dmitruk, P. A. Cassak, and M. Wan, Phys. Plasmas 17, 032315 (2010).
- Yamada et al. (1997) M. Yamada, H. Ji, S. Hsu, T. Carter, R. Kulsrud, N. Bretz, F. Jobes, Y. Ono, and F. Perkins, Phys. Plasmas 4, 1936 (1997).
- Murphy and Sovinec (2008) N. A. Murphy and C. R. Sovinec, Phys. Plasmas 15, 042313 (2008).
- Beidler and Cassak (2011) M. T. Beidler and P. A. Cassak, Phys. Rev. Lett. 107, 255002 (2011).
- Rogers and Zakharov (1995) B. Rogers and L. Zakharov, Phys. Plasmas 2, 3420 (1995).
- Linton (2006) M. G. Linton, J. Geophys. Res. 111, 12 (2006).
- Nakamura, Shibata, and Isobe (2012) N. Nakamura, K. Shibata, and H. Isobe, Astrophys. J. 761, 87 (2012).
- Su and van Ballegooijen (2013) Y. Su and A. van Ballegooijen, Astrophys. J. 764, 91 (2013).
- Murphy et al. (2012) N. A. Murphy, M. P. Miralles, C. L. Pope, J. C. Raymond, H. D. Winter, K. K. Reeves, D. B. Seaton, A. A. van Ballegooijen, and J. Lin, Astrophys. J. 751, 56 (2012).
- Murphy (2010) N. A. Murphy, Phys. Plasmas 17, 112310 (2010).
- Murphy, Sovinec, and Cassak (2010) N. A. Murphy, C. R. Sovinec, and P. A. Cassak, J. Geophys. Res. 115, 9206 (2010).
- Oka et al. (2008) M. Oka, M. Fujimoto, T. K. M. Nakamura, I. Shinohara, and K.-I. Nishikawa, Phys. Rev. Lett. 101, 205004 (2008).
- Reeves et al. (2010) K. K. Reeves, J. A. Linker, Z. Mikić, and T. G. Forbes, Astrophys. J. 721, 1547 (2010).
- Galsgaard and Roussev (2002) K. Galsgaard and I. Roussev, Astron. Astrophys. 383, 685 (2002).
- Katz et al. (2010) N. Katz, J. Egedal, W. Fox, A. Le, J. Bonde, and A. Vrublevskis, Phys. Rev. Lett. 104, 255004 (2010).
- Egedal et al. (2011) J. Egedal, N. Katz, J. Bonde, W. Fox, A. Le, M. Porkolab, and A. Vrublevskis, Phys. Plasmas 18, 111203 (2011).
- Al-Hachami and Pontin (2010) A. K. Al-Hachami and D. I. Pontin, Astron. Astrophys. 512, A84 (2010).
- Pontin (2011) D. I. Pontin, Adv. Space Res. 47, 1508 (2011).
- Lukin and Linton (2011) V. S. Lukin and M. G. Linton, NPGeo 18, 871 (2011).
- Dorfman et al. (2013) S. Dorfman, H. Ji, M. Yamada, J. Yoo, E. Lawrence, C. Myers, and T. D. Tharp, Geophys. Res. Lett. 40, 233 (2013).
- Wyper and Jain (2013) P. F. Wyper and R. Jain, Phys. Plasmas 20, 052901 (2013).
- Sovinec et al. (2004) C. R. Sovinec, A. H. Glasser, T. A. Gianakon, D. C. Barnes, R. A. Nebel, S. E. Kruger, D. D. Schnack, S. J. Plimpton, A. Tarditi, and M. S. Chu, J. Comput. Phys. 195, 355 (2004).
- Sovinec, King, and the NIMROD Team (2010) C. R. Sovinec, J. R. King, and the NIMROD Team, J. Comput. Phys. 229, 5803 (2010).
- Wan et al. (2013) M. Wan, W. H. Matthaeus, S. Servidio, and S. Oughton, Phys. Plasmas 20, 042307 (2013).
- Brent (1973) R. P. Brent, Algorithms for Minimization Without Derivatives (Englewood Cliffs, NJ: Prentice Hall, 1973) Chap. 3-4.
- Haynes and Parnell (2007) A. L. Haynes and C. E. Parnell, Phys. Plasmas 14, 082107 (2007).
- Broyden (1965) C. G. Broyden, Mathematics of Computation 19, 577 (1965).
- Parnell et al. (1996) C. E. Parnell, J. M. Smith, T. Neukirch, and E. R. Priest, Phys. Plasmas 3, 759 (1996).
- Swisdak and Drake (2007) M. Swisdak and J. F. Drake, Geophys. Res. Lett. 34, L11106 (2007).
- Chen and Morrison (1990) X. L. Chen and P. J. Morrison, Phys. Fluids B 2, 495 (1990).
- Chen, Otto, and Lee (1997) Q. Chen, A. Otto, and L. C. Lee, J. Geophys. Res. 102, 151 (1997).
- La Haye et al. (2010) R. J. La Haye, D. P. Brennan, R. J. Buttery, and S. P. Gerhardt, Phys. Plasmas 17, 056110 (2010).
- Li and Ma (2010) J. H. Li and Z. W. Ma, J. Geophys. Res. 115, A09216 (2010).
- Cassak (2011) P. A. Cassak, Phys. Plasmas 18, 072106 (2011).
- Cassak and Otto (2011) P. A. Cassak and A. Otto, Phys. Plasmas 18, 074501 (2011).
- Dubois and Samain (1979) M. Dubois and A. Samain, Plasma Physics 21, 101 (1979).
- Einaudi and Rubini (1984) G. Einaudi and F. Rubini, Nuovo Cimento B Serie 81, 102 (1984).
- Ding, Lee, and Kennel (1992) D. Q. Ding, L. C. Lee, and C. F. Kennel, J. Geophys. Res. 97, 8257 (1992).
- Lin and Forbes (2000) J. Lin and T. G. Forbes, J. Geophys. Res. 105, 2375 (2000).
- Ko et al. (2003) Y.-K. Ko, J. C. Raymond, J. Lin, G. Lawrence, J. Li, and A. Fludra, Astrophys. J. 594, 1068 (2003).
- Takasao et al. (2012) S. Takasao, A. Asai, H. Isobe, and K. Shibata, Astrophys. J. 745, L6 (2012).
- Ciaravella et al. (2002) A. Ciaravella, J. C. Raymond, J. Li, P. Reiser, L. D. Gardner, Y.-K. Ko, and S. Fineschi, Astrophys. J. 575, 1116 (2002).
- Webb et al. (2003) D. F. Webb, J. Burkepile, T. G. Forbes, and P. Riley, J. Geophys. Res. 108, 1440 (2003).
- Lin et al. (2005) J. Lin, Y.-K. Ko, L. Sui, J. C. Raymond, G. A. Stenborg, Y. Jiang, S. Zhao, and S. Mancuso, Astrophys. J. 622, 1251 (2005).
- Ciaravella and Raymond (2008) A. Ciaravella and J. C. Raymond, Astrophys. J. 686, 1372 (2008).
- Schettino, Poletto, and Romoli (2010) G. Schettino, G. Poletto, and M. Romoli, Astrophys. J. 708, 1135 (2010).
- Savage et al. (2010) S. L. Savage, D. E. McKenzie, K. K. Reeves, T. G. Forbes, and D. W. Longcope, Astrophys. J. 722, 329 (2010).
- Reeves and Golub (2011) K. K. Reeves and L. Golub, Astrophys. J. 727, L52 (2011).
- Landi et al. (2012) E. Landi, J. C. Raymond, M. P. Miralles, and H. Hara, Astrophys. J. 751, 21 (2012).
- Savage et al. (2012) S. L. Savage, G. Holman, K. K. Reeves, D. B. Seaton, D. E. McKenzie, and Y. Su, Astrophys. J. 754, 13 (2012).
- Ciaravella et al. (2013) A. Ciaravella, D. F. Webb, S. Giordano, and J. C. Raymond, Astrophys. J. 766, 65 (2013).
- Riley et al. (2007) P. Riley, R. Lionello, Z. Mikić, J. Linker, E. Clark, J. Lin, and Y.-K. Ko, Astrophys. J. 655, 591 (2007).
- Lin et al. (2007) J. Lin, J. Li, T. G. Forbes, Y.-K. Ko, J. C. Raymond, and A. Vourlidas, Astrophys. J. 658, L123 (2007).
- (106) McKenzie, David E., Astrophys. J. 766, 39.
- Yokoyama and Shibata (1996) T. Yokoyama and K. Shibata, PASJ 48, 353 (1996).
- Shibata et al. (2007) K. Shibata, T. Nakamura, T. Matsumoto, K. Otsuji, T. J. Okamoto, N. Nishizuka, T. Kawate, H. Watanabe, S. Nagata, S. UeNo, R. Kitai, S. Nozawa, S. Tsuneta, Y. Suematsu, K. Ichimoto, T. Shimizu, Y. Katsukawa, T. D. Tarbell, T. E. Berger, B. W. Lites, R. A. Shine, and A. M. Title, Science 318, 1591 (2007).
- Ji and Daughton (2011) H. Ji and W. Daughton, Phys. Plasmas 18, 111207 (2011).
- Yamada (2011) M. Yamada, Space Sci. Rev. 160, 25 (2011).
- Lukin and Jardin (2003) V. S. Lukin and S. C. Jardin, Phys. Plasmas 10, 3131 (2003).
- Dorfman et al. (2008) S. Dorfman, W. Daughton, V. Roytershteyn, H. Ji, Y. Ren, and M. Yamada, Phys. Plasmas 15, 102107 (2008).
- Lukin et al. (2001) V. S. Lukin, G. Qin, W. H. Matthaeus, and M. R. Brown, Phys. Plasmas 8, 1600 (2001).
- Hasegawa (2012) H. Hasegawa, Monographs on Environment, Earth and Planets 1, 71 (2012).
- Øieroset et al. (2001) M. Øieroset, T. D. Phan, M. Fujimoto, R. P. Lin, and R. P. Lepping, Nature 412, 414 (2001).
- Mozer et al. (2008) F. S. Mozer, V. Angelopoulos, J. Bonnell, K. H. Glassmeier, and J. P. McFadden, Geophys. Res. Lett. 35, 17 (2008).
- Intrator et al. (2009) T. P. Intrator, X. Sun, G. Lapenta, L. Dorf, and I. Furno, Nature Physics 5, 521 (2009).
- Sun et al. (2010) X. Sun, T. P. Intrator, L. Dorf, J. Sears, I. Furno, and G. Lapenta, Phys. Rev. Lett. 105, 255001 (2010).