Finding a 61.0-day orbital period for the HMXB 4U 1036–56 with the Swift-BAT monitoring.
Abstract
Since November 2004, the Burst Alert Telescope on board Swift is producing a monitoring of the entire sky in the 15–150 keV band, recording the timing and spectral behavior of the detected sources. Here we study the properties of the HMXB 4U 1036–56 using both the BAT survey data and those from a Swift-XRT observation. A folding analysis performed on the BAT light curve of the first 100 months of survey unveils a periodic modulation with a period of days, tied to the presence in the BAT light curve of several intensity enhancements lasting of P0. We explain this modulation as the orbital period of the binary system. The position of 4U 1036–56 on the Corbet diagram, the derived semi-major orbit axis (), and the bulk of the source emission observed in a limited portion of the orbit are consistent with a Be companion star. The broad band 0.2–150 keV spectrum is well modeled with a flat absorbed power law with a cut-off at keV. Finally, we explore the possible association of 4U 1036-56 with the -ray source AGL J1037-5808, finding that the BAT light curve does not show any correlation with the -ray outburst observed in November 2012.
keywords:
X-rays: binaries – X-rays: individual: 4U 1036–56. Facility: Swift1 Introduction
The identification of the orbital period of a binary system is an essential step for deriving the geometry of the system and, as a consequence, for investigating the physical mechanism responsible for the spectral and temporal properties of the source. However, the discovery of such modulations may become a challenging task for very long periodicities, requiring long and continuous monitoring. For sources with strong absorption this monitoring is efficient only in the hard X-ray regime where the circumstellar material is transparent to the emission, while it blocks most of the emission in the soft X-ray band. The long-term temporal monitoring carried on by the Burst Alert Telescope (BAT, Barthelmy et al., 2005) on board of the Swift observatory (Gehrels et al., 2004) has been fulfilling this task (e.g. Corbet & Krimm, 2009; Corbet et al., 2010a, b; Cusumano et al., 2010; La Parola et al., 2010; D’Aì et al., 2011).
In this Letter we analyze the dataset collected by Swift on 4U 1036–56.
This source was first detected by UHURU (Forman et al., 1978) and its transient
behavior was first observed by Ariel V in 1974 (Warwick et al., 1981), that recorded
an outburst episode with a flux increase of a factor of 2.4 higher than the
average UHURU flux. Since then, 4U 1036–56 was observed by several X-ray
telescopes, at different luminosity levels ranging between and
erg s-1 (see La Palombara et al., 2009 and references
therein). RXTE data revealed a pulsed emission with a period of s
(Reig & Roche, 1999). Based on a pointed ROSAT PSPC observation Motch et al. (1997)
identified the optical counterpart to be the B0 III-Ve star LS 1698, at a
distance of 5 kpc. BAT detected a hard X-ray outburst from 4U 1036-56
with a peak flux of mCrab on February 2012 (Krimm et al., 2012). This
activated a Swift-XRT target-of-opportunity observation. The XRT spectrum was
modeled with an absorbed flat power law with photon index .
Li et al. (2012) report timing and spectral analysis of 4U 1036–56 with INTEGRAL
(Winkler et al., 2003) and Swift data. They report an outburst detected in
February 2007 with a significance and standard deviations
in ISGRI and JEM-X, respectively. Their broad band spectrum can be described by
an absorbed power-law (with photon index ) modified by a cut-off at
keV. Using the Swift-XRT observation, they confirm the pulsed
modulation reported by Reig & Roche (1999). They also discuss the possibility
that 4U 1036–56 is associated to the MeV source AGL J1037-5708 (as suggested
by Bulgarelli et al., 2010 upon the detection of the AGILE source).
Using theoretical considerations based on the leptonic model for -ray
emission, they do not rule out this possibility.
This Letter is organized as follows. Section 2 describes the BAT and XRT data
reduction. Section 3 reports on the timing analysis. Sect. 4 describes the broad
band spectral analysis. In Sect. 5 we briefly discuss
our results.


2 Data reduction
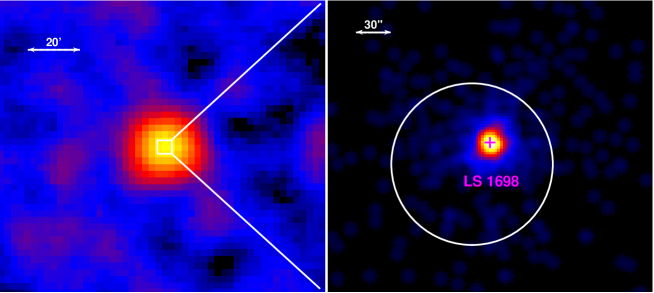
The survey data collected with BAT between November 2004 and March 2013 were retrieved from the HEASARC public archive111http://heasarc.gsfc.nasa.gov/docs/archive.html and processed using a software dedicated to the analysis of the data from coded mask telescopes (Segreto et al., 2010). The source is detected with a significance of 26.8 standard deviations in the 15-60 keV energy band, where its signal is optimized: Fig. 1 (left panel) shows the significance map of the sky region around 4U 1036–56 in this energy band. The significance in the 15-150 keV band is 23.9 standard deviations. The 15-60 keV light curve was extracted in 49493 bins with a variable time length ranging between 50 s and 6317 s and a constant pointing direction within each bin. The central time of each bin was corrected to the Solar System barycentre (SSB) using the task EARTH2SUN and the JPL DE-200 ephemeris (Standish, 1982). The background subtracted spectrum was extracted in eight energy channels and analyzed using the BAT redistribution matrix available in the Swift calibration database222http://swift.gsfc.nasa.gov/docs/heasarc/caldb/swift/.
4U 1036–56 was observed once (ObsID 00032288001) with Swift-XRT on 2012 February 17 for 3 ksec in photon counting observing mode (Hill et al., 2004). The data were processed using the ftools package with standard procedures (xrtpipeline v.0.12.4), filtering and screening criteria, with standard grade filtering 0-12.
A first inspection of the light curve shows high variability, with a maximum count rate of 1.2 c/s, indicating the need for a pile-up correction333see e.g. http://www.swift.ac.uk/analysis/xrt/pileup.php. Selecting only the time intervals where the source intensity exceeds 0.5 c/s, we have compared the source Point Spread function (PSF) with the expected PSF shape (Moretti et al., 2005), finding that a circular region with 4 pixels radius (centered at the source position) must be excluded to avoid pile-up. Therefore, the source spectrum and light curve were extracted from an annular region of 4 and 30 pixels internal and esternal radii respectively, centered on the source centroid as determined with the task xrtcentroid (RAJ2000=10h 37m 35.25s, DecJ2000= -56∘ 47’ 56.3”, with 3.6” uncertainty at 90% confidence level). The background for the lightcurve and spectral analysis was extracted from an annular region with inner and outer radii of 40 and 70 pixels, respectively. This annular region is far enough to avoid the contamination from the PSF wings of 4U 1036–56 and does not contain any field source. The source event arrival times were converted to the Solar System barycenter using the task barycorr; the lightcurve was corrected for PSF and vignetting using the task xrtlccorr. The XRT ancillary response file generated with xrtmkarf accounts for PSF and vignetting correction; we used the spectral redistribution matrix v013 available in the Swift calibration database. The spectral analysis was performed using xspec v.12.5, after grouping the spectrum with a minimum of 20 counts per channel to allow the use of statistics.
We note that the X–ray coordinates of 4U 103656 determined with XRT are formally inconsistent with those (RAJ2000 = 10h 37m 35.5s, DecJ2000 = -56∘ 48’ 11”) of the optical counterpart LS 1698 (Stephenson & Sanduleak, 1971) which are available e.g. from the CDS444http://cdsportal.u-strasbg.fr Portal, the star being about 20′′ from the X–ray centroid, thus well outside the XRT error circle. However, an inspection of this sky region in the DSS-II-Red Sky Survey555http://archive.eso.org/dss/dss shows that no object is present at the CDS coordinates of LS 1698. Moreover, a bright optical object is instead present in the DSS within the XRT error circle, and this is the same object proposed by Motch et al. (1997, see their Fig. 14) as the optical counterpart of 4U 103656. Regrettably, Motch et al. (1997) did not report precise coordinates for LS 1698; we thus complete this information here by extracting it from the 2MASS archive, which has a precision of 01 on both RA and Dec (Skrutskie et al., 2006). According to this archive, the coordinates (J2000) of LS 1698 are RAJ2000 = 10h 37m 35.32s, DecJ2000 = -56 ∘ 47’ 55.8’, at 07 from the XRT error circle centroid, thus well within it. Figure 1 (right panel) shows the XRT image of 4U 1036–56, with the 95% BAT error circle of 1.16’ superimposed, and the position of the optical counterpart.
3 Timing analysis
We performed a timing analysis searching for long term periodic modulations
in the 15–60 keV BAT light curve of 4U 1036–56. We applied
a folding algorithm to the baricentered arrival times searching
in the 0.5–1000 days time range with a step of P,
where P is the trial period, is the number of profile phase bins
and 262 Ms is the data time span.
The average rate in each phase bin was evaluated by weighting the rates
by the inverse square of the corresponding statistical errors (see also
Cusumano et al., 2010).
This is appropriate when dealing with a large span of rate errors
and/or with background dominated data such as those from coded mask telescopes.
Figure 2 (a) shows the periodogram with several features emerging.
A very prominent one, with a value of , is at
P d, where the period and its error are the
centroid of the peak and the standard deviation obtained from a Gaussian fit to
the feature at P0; other significant features at higher periods
correspond to multiples of P0 (2P0 to 10P0).
The long term variability of the source causes the distribution of in
Figure 2 (a) to deviate strongly both in average and in fluctuation amplitude
from the behavior expected for a white noise (average ) where the signal
is dominated by statistical variations.
As a consequence the statistics cannot be applied and the significance for the
presence of a feature has to be evaluated with different methodologies.
For this purpose we applied the procedure described below in a few steps:
(1) - The significance of any feature needs to be evaluated with
respect to the average level of the periodogram. Thus we fit the periodogram
with a second order polynomial that describes
the trend of the values in the periodogram. The best fit function was
then subtracted from the to obtain a flattened periodogram (hereafter,
z). The value of z corresponding to P0 is .
(2) - Figure 2 (b) shows the histogram of the z values in the
period range between 20 and 100 days (where the periodogram is
characterized by a noise level quite consistent with the noise level at
P0), excluding the values in the interval
around P0. Its positive tail (beyond z=10) can be modeled
with an exponential function, and its integral
between 279 and infinity (normalized to the total area below the
distribution) represents the probability of chance occurrence of a z
equal to
or larger than 279. The area below the histogram was evaluated summing
the
contribution of each single bin from its left boundary up to =10 and
integrating the best-fit exponential function beyond =10.
The probability of chance occurrence for
is and corresponds to Gaussian
standard deviations for the significance of the feature at P0.
The light curve profile (Fig. 2, c) folded at P0 with
Tepoch= 54841.199 MJD, is characterized by a roughly squared
shaped peak over a low intensity plateau.
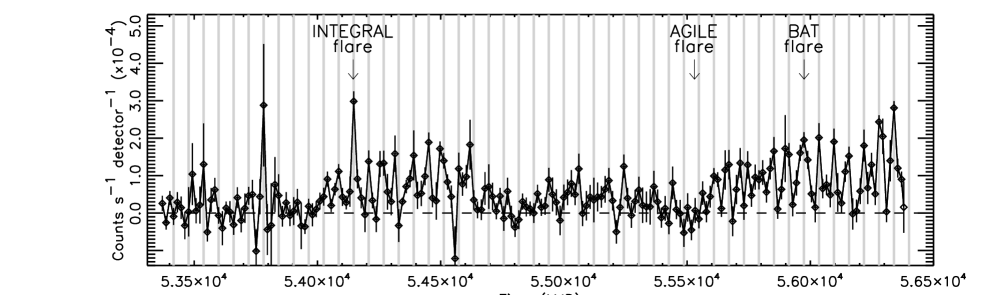
Figure 3 shows the 15–60 keV BAT light curve of 4U 1036–56
sampled with a bin time of P d. The vertical shaded area are in
phase with the peak in Figure 2c (phase interval 0.375–0.6875).
The light curve shows the presence of many flux enhancement, most of which
are coincident with the shaded bars.
The Swift-XRT observation was performed as a follow up of the BAT flare
(Krimm et al., 2012) and it is at orbital phase 0.58 in
Fig. 2(c). It is composed of two snapshots lasting 2200 s and
800 s respectively, with an average pile-up corrected count rate of 0.6
count s-1. A light curve binned
at intervals of 50 s (Fig. 4) shows a variability within a factor of
10, with a modulation (3 cycles) roughly consistent with the periodicity reported
by Reig & Roche (1999).

4 Spectral analysis
Since the XRT observation was performed during a flare, which in turn corresponds to the phase interval where several other intensity enhancements have been observed (see Figure 3), the broad band spectral analysis was performed coupling the soft X-ray spectrum and the Swift-BAT hard X-ray spectrum selected at this phase interval (0.375–0.6875).
The broad band 0.2–150 keV spectral analysis was performed introducing a multiplicative constant () in the model to take into account both for the intercalibration systematics in the XRT and BAT responses and for the non simultaneity of the data. We tried to fit the spectra with an absorbed power law model phabs*(powerlaw) that resulted unsatisfactory to describe the data (=91.2, 41 degrees of freedom [d.o.f.]). The fit residuals clearly indicated a significant steepening in the BAT energy range. The spectrum indeed results well fitted adopting the model phabs*(cutoffpl) with a photon index and a cutoff energy , with a , for 40 dof. The F-test for one additional parameter yields a probability of chance improvement of with respect to the absorbed powerlaw model. We observe that the cutoff energy is close to the gap between the XRT and the BAT energy bands; therefore its position could be affected by residual intercalibration systematics between the two instruments. Figure 5 (bottom panel) shows no significant residual pattern between data and model. Table 1 reports the best fit parameters (quoted errors are given at 90% confidence level for a single parameter). The multiplicative constant () is marginally consistent with the ratio between the average count rate in the BAT spectrum and the count rate observed by BAT at the time of the XRT observation.

5 Discussion
We investigated the timing and spectral properties of the HMXB 4U 1036–56 exploiting the Swift data recorded by the BAT and the XRT telescopes. The timing analysis on the 100-month BAT survey light curve unveiled a periodic modulation with a period of P days. Such long periodicities are typically associated with the orbit of binary systems. The profile of the light curve folded at P0 shows a roughly rectangular shape over a plateau of low intensity emission.
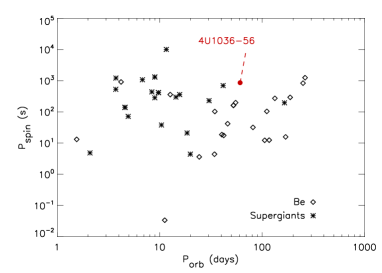
The source can be located on the Corbet diagram (Corbet, 1986), as both its spin and orbital periods (Pspin, Porb) are known. Figure 6 reports the pairs of Pspin and Porb for the HMXBs listed in Liu et al. (2006), and for the HMXBs discovered more recently by INTEGRAL666http://irfu.cea.fr/Sap/IGR-Sources/. 4U 1036–56 lays at the boundary of the Be transients region, in agreement with the classification of its companion star.
| Parameter | Best fit value | Units |
|---|---|---|
| N | cm-2 | |
| keV | ||
| ph at 1 keV | ||
| 32.5 (40 dof) |
Knowing the orbital period, we can use the third Kepler’s law to derive the semi-major axis of the binary system. Assuming that is the mass of the neutron star and is the mass range for the spectral type of the companion star (Lang, 1992), we have:
| (1) |
Considering that the radius of the companion star is (Lang, 1992), the semi-major axis length corresponds to . This wide orbital separation is common among HMXB with Be star as companion.
We analyzed the broad-band (0.2–150 keV) spectrum of 4U 1036–56 using the XRT pointed observation data in the soft X-ray band and the BAT survey data selected in the 0.375–0.6875 phase interval. The spectrum is well modeled with a flat () absorbed powerlaw with a cutoff at keV. The column density is , which is a factor of larger than the maximum Galactic value in the direction of the source ( Dickey & Lockman, 1990). This suggests an additional intrinsic absorption in the environment of the binary system.
Li et al. (2012) discuss the possibility that 4U 1036–56 is associated to the unidentified source AGL J1037-5708, that was detected in November 2012 during an outburst above 100 MeV (Bulgarelli et al., 2010). The association was initially suggested because of the spatial coincidence of the two sources. Figure 3 shows the epoch of the INTEGRAL (Li et al., 2012) and BAT (Krimm et al., 2012) flares, together with the epoch of the AGL J1037-5708 flare (Bulgarelli et al., 2010). A simultaneous flare in the MeV and in the hard X-ray energy ranges would be a strong evidence that the two sources are indeed associated. However, while the presence of many peaks can be observed in the BAT light curve, the epoch of the MeV burst does not correspond to any significant intensity enhancement. Moreover we observe that while the BAT and the INTEGRAL flare happen at a phase consistent with the maximum of the folded profile (Figure 2c), the MeV flare is at a phase of minimum intensity. On the other hand, it is not ensured that a MeV flare would automatically corresponds to a hard X-ray flare.
Acknowledgments
This work has been supported by ASI grant I/011/07/0.
References
- Barthelmy et al. (2005) Barthelmy, S. D., et al. 2005, Space Science Reviews, 120, 143
- Bulgarelli et al. (2010) Bulgarelli, A., Gianotti, F., Trifoglio, M., et al. 2010, The Astronomer’s Telegram, 3059, 1
- Corbet & Krimm (2009) Corbet, R. H. D., & Krimm, H. A. 2009, The Astronomer’s Telegram, 2008, 1
- Corbet et al. (2010a) Corbet, R. H. D., Krimm, H. A., & Skinner, G. K. 2010, The Astronomer’s Telegram, 2559, 1
- Corbet et al. (2010b) Corbet, R. H. D., Krimm, H. A., Barthelmy, S. D., et al. 2010, The Astronomer’s Telegram, 2570, 1
- Corbet (1986) Corbet, R. H. D. 1986, MNRAS, 220, 1047
- Cusumano et al. (2010) Cusumano, G., La Parola, V., Romano, P., et al. 2010, MNRAS, 406, L16
- D’Aì et al. (2011) D’Aì, A., La Parola, V., Cusumano, G., et al. 2011, A&A, 529, A30
- Dickey & Lockman (1990) Dickey, J. M., & Lockman, F. J. 1990, ARA&A, 28, 215
- Forman et al. (1978) Forman, W., Jones, C., Cominsky, L., et al. 1978, ApJS, 38, 357
- Gehrels et al. (2004) Gehrels, N., et al. 2004, ApJ, 611, 1005
- Hill et al. (2004) Hill, J. E., Burrows, D. N., Nousek, J. A., et al. 2004, SPIE, 5165, 217
- Krimm et al. (2012) Krimm, H. A., Kennea, J. A., Holland, S. T., et al. 2012, The Astronomer’s Telegram, 3936, 1
- Lang (1992) Lang, K. R. 1992, Astrophysical Data I. Planets and Stars, X, 937 pp. 33 figs.. Springer-Verlag Berlin Heidelberg New York
- La Palombara et al. (2009) La Palombara, N., Sidoli, L., Esposito, P., Tiengo, A., & Mereghetti, S. 2009, A&A, 505, 947
- La Parola et al. (2010) La Parola, V., Cusumano, G., Romano, P., et al. 2010, MNRAS, 405, L66
- Li et al. (2012) Li, J., Torres, D. F., Zhang, S., et al. 2012, ApJ, 761, 49
- Liu et al. (2006) Liu, Q. Z., van Paradijs, J., & van den Heuvel, E. P. J. 2006, A&A, 455, 1165
- Moretti et al. (2005) Moretti, A., Campana, S., Mineo, T., et al. 2005, SPIE, 5898, 360
- Motch et al. (1997) Motch, C., Haberl, F., Dennerl, K., Pakull, M., & Janot-Pacheco, E. 1997, A&A, 323, 853
- Reig & Roche (1999) Reig, P., & Roche, P. 1999, MNRAS, 306, 100
- Segreto et al. (2010) Segreto, A., Cusumano, G., Ferrigno, C., La Parola, V., Mangano, V., Mineo, T., & Romano, P. 2010, A&A, 510, A47
- Skrutskie et al. (2006) Skrutskie, M. F., Cutri, R. M., Stiening, R., et al. 2006, The Astronomical Journal, 131, 1163
- Standish (1982) Standish, E. M., Jr. 1982, A&A, 114, 297
- Stephenson & Sanduleak (1971) Stephenson, C. B., & Sanduleak, N. 1971, Publications of the Warner & Swasey Observatory, 1, 1
- Warwick et al. (1981) Warwick, R. S., Marshall, N., Fraser, G. W., et al. 1981, MNRAS, 197, 865
- Winkler et al. (2003) Winkler, C., Courvoisier, T. J.-L., Di Cocco, G., et al. 2003, A&A, 411, L1