Long-term monitoring of PKS 0558–504 with Swift: the disc-corona link
Abstract
PKS 0558-504 is a highly variable, X-ray bright, radio-loud, Narrow-Line Seyfert 1 galaxy with super-Eddington accretion rate and extended jets that do not dominate the emission beyond the radio band. Therefore, this source represents an ideal laboratory to shed some light on the central engine in highly accreting systems and specifically on the link between accretion disc and corona. Here we present the results from a 1.5 year monitoring with SWIFT XRT and UVOT. The simultaneous coverage at several wavelengths confirms that PKS 0558-504 is highly variable in any band from optical, to UV and X-rays, with the latter showing the largest amplitude changes but with the UV emission dominating the radiative output. A cross-correlation analysis reveals a tight link between the emission in the optical and UV bands and provides suggestive evidence in favor of a scenario where the variability originates in the outer part of the accretion flow and propagates inwards before triggering the activity of the X-ray emitting corona. Finally, a positive correlation between the soft X-ray flux and the hard photon index suggests that in PKS 0558-504 the seed photons are provided to the corona by the soft excess component.
keywords:
Galaxies: active – Galaxies: jets – Galaxies: nuclei – X-rays: galaxies1 Introduction
More than three decades of multi-wavelength observations of active galactic nuclei (AGN) have revealed that these objects are powerful emitters of variable radiation from the radio band to -ray energies and that most of the radiation is emitted in the optical-UV band and in the X-rays. In the current leading scenario, AGN are powered by accretion onto a central supermassive black hole, the optical-UV emission is thermal radiation produced (directly and/or via reprocessing) from the accretion flow, and the X-rays are produced through Comptonisation process in a putative corona. While this general picture is widely accepted, the details concerning the interaction between disc and corona as well as the geometry and physical state of the latter (for example, thermal static vs. “cool” dynamic medium) and the origin of the variability in different bands (e.g., intrinsic disc emission variation vs. reprocessing of the X-ray emission) are still poorly understood.
One of the best way to address these outstanding open questions is to investigate the long-term variability in several different energy bands that track the activity of the main components of the central engine, namely the disc and the corona. In recent years, several multi-wavelength variability studies have confirmed the validity of this approach and revealed in some cases the existence of coordinated variability patterns and in others the lack of coordinated changes (e.g., Maoz et al., 2000; Shemmer et al., 2001; Uttley et al., 2003; Arévalo et al., 2008; Breedt et al., 2009; Arévalo et al., 2009; Breedt et al., 2010). This apparent discrepancy of long-term behaviour in different AGN can be partly ascribed to the lack of simultaneous coverage and to the difficulty of adequately capturing the disc activity using ground-based optical telescopes that are often hampered by weather conditions. However, it could also be due to intrinsic differences in some fundamental properties of the central engine, such as the BH mass, , and the accretion rate in Eddington units, (e.g., Uttley et al., 2003).
In order to shed further light on the link between disc and corona, it is crucial to simultaneously study in different energy bands the activity of variable black hole systems whose and are well constrained. The advent of SWIFT with its flexibility coupled with the simultaneous coverage of several bands in the optical/UV and in the X-rays offers the ideal tool for this kind of studies.
Over the last few years, we have carried out a multi-wavelength campaign of the X-ray bright radio-loud Narrow-line Seyfert 1 (NLS1) PKS 0558–504 with RXTE, the ATCA, XMM-Newton, and with SWIFT. The long-term RXTE monitoring indicates that PKS 0558–504 is highly variable on timescales ranging from minutes to years with frequent flares and continuous “achromatic” large-amplitude variations that are similar to the behaviour shown by Galactic black holes in highly-accreting intermediate spectral states (Gliozzi et al., 2007). The radio observations reveal the presence of aligned extended structures suggesting the presence of bipolar jets with a relatively large viewing angle (Gliozzi et al., 2010). A deep XMM-Newton observation (5 consecutive orbits) indicates that PKS 0558–504 lacks any significant intrinsic absorption and strong reflection features; the source has X-ray spectral and temporal variability typical of radio-quiet Seyfert galaxies, and has a highly variable soft excess well described by a low-temperature Comptonisation model (Papadakis et al., 2010a, b). A 10-day monitoring campaign in September 2008 with SWIFT combined with simultaneous XMM-Newton and archival radio data constrains the black hole mass to confirming that PKS 0558–504 is accreting at or above the Eddington limit. The SWIFT observations also reveal that the spectral energy distribution (SED) is dominated by the optical-UV emission, and that the jet appears to be relevant only in the radio band (Gliozzi et al., 2010).
Based on these findings, we can conclude that PKS 0558–504 is a “clean” system accreting at super-Eddington rate, ideal to study the central engine and specifically the disc-corona interaction in the high-accretion regime. For this purpose, we investigate the multi-wavelength behaviour of PKS 0558–504 as seen by SWIFT XRT and UVOT over a time interval of one and a half years. The outline of the paper is as follows. First, in Section 2, we describe the observations and data reduction. In Section 3 we study the long-term flux variability in the X-ray band and in six UVOT filters, whereas in Section 4 we perform an inter-band correlation analysis. In Section 5, we carry out a spectral analysis of the broadband SED and investigate the link between disc, corona and soft excess. Finally, in Section 6 we summarize the main results and discuss their implications. Hereafter, we adopt a cosmology with , and (Bennet et al., 2003). With the assumed cosmological parameters, the luminosity distance of PKS 0558–504 is 642 Mpc ().
2 Observations and Data Reduction
PKS 0558–504 was observed by SWIFT (Gehrels, 2004) between 9 September 2008 and 30 March 2010 with one pointing per week (with typical exposure per visit of 2ks), with the exception of the first ten days when the source was observed on daily basis (Gliozzi et al., 2010). The details of the SWIFT monitoring campaign (dates, exposures, X-ray count rates, and UVOT magnitudes) are summarized in Tables 1 and 2, where only the first three entries are shown for illustrative purposes. The complete tables are available in electronic format.
The SWIFT XRT (Burrows et al., 2005) observations were performed in windowed timing mode to avoid possible pile-up effects (Hill et al. 2004). The event file of the observation was created by using the Swift analysis tool xrtpipeline version 0.11.4. Source photons were extracted from a box with length radius of 40 pixels centered on the source; the background was selected from a similar source-free region. Only single to quadruple events in the energy range of 0.3–10 keV were selected for further analysis. Source and background spectra were extracted from the event file by using XSELECT version 2.3. Spectra were rebinned within grppha 3.0.0 to have at least 20 photons per bin. The auxiliary response files were created by the Swift tool xrtmkarf. We used the response matrix version 012 with a grade selection 0-12.
In addition to the X-ray data, we also obtained photometry with the UV/Optical Telescope (UVOT; Roming et al. 2005) in the V, B, U, UVW1, UVM2, and UVW2 filters. Source photons were extracted from a circular region with r = 5″, and the background from an annulus around the source with an inner radius of 7″ and an outer radius of 20″. The UVOT tool uvotsource was used to determine the magnitudes and fluxes (Poole et al., 2008; Breeveld et al., 2010). The fluxes were corrected for Galactic reddening (=0.044; Schlegel et al. 1998) with the standard reddening correction curves by Cardelli et al. (1989) as described by equation 2 in Roming et al. (2009).
| Segment | Start time (UT) | End Time (UT) | MJD | Observing time given in s | ||||||
|---|---|---|---|---|---|---|---|---|---|---|
| 011 | 2008-09-18 17:18 | 2008-09-18 20:42 | 54727.79 | 2056 | 163 | 163 | 163 | 326 | 490 | 652 |
| 012 | 2008-09-25 00:08 | 2008-09-25 18:14 | 54734.38 | 1884 | 147 | 147 | 147 | 294 | 404 | 590 |
| 013 | 2008-10-02 00:52 | 2008-10-02 13:51 | 54741.31 | 1516 | 127 | 126 | 127 | 253 | 296 | 507 |
| Segment | XRT rate | XRT HR | V | B | U | UVW1 | UVM2 | UVW2 |
|---|---|---|---|---|---|---|---|---|
| 011 | 1.370.03 | –0.030.02 | 14.830.02 | 15.030.01 | 13.840.01 | 13.550.01 | 13.250.01 | 13.290.01 |
| 012 | 1.200.03 | –0.050.02 | 14.900.03 | 15.070.01 | 13.850.01 | 13.580.01 | 13.310.01 | 13.380.01 |
| 013 | 1.870.03 | –0.080.02 | 14.860.03 | 15.040.02 | 13.860.01 | 13.550.01 | 13.220.01 | 13.330.01 |
The magnitudes were corrected for reddening with =0.044. The errors given in this table are statistical errors.
Note: The complete tables are available in the on-line version.
3 Variability analysis of PKS 0558–504
3.1 X-ray variability
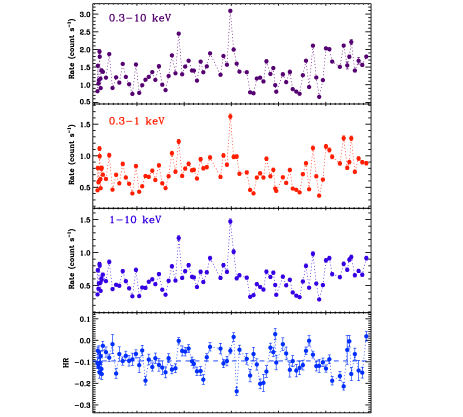
Figure 1 shows the total (0.3–10 keV), soft (0.3–1 keV), and hard (1–10 keV) XRT light curves of PKS 0558–504 as well as the hardness ratio light curve. Soft and hard time series appear to vary significantly and roughly in concert. According to a test, the count rate variation are highly significant with and for the soft and hard band respectively. Based on the same test, the variability of the light curve appears to be statistically significant with , suggesting the presence of spectral variability. An analysis of the fractional variability (where is the variance, the mean square value of the uncertainty associated with each individual count rate, and the unweighted mean count rate ) confirms the presence of strong variability at a similar level in the soft and hard X-ray bands with %, %.
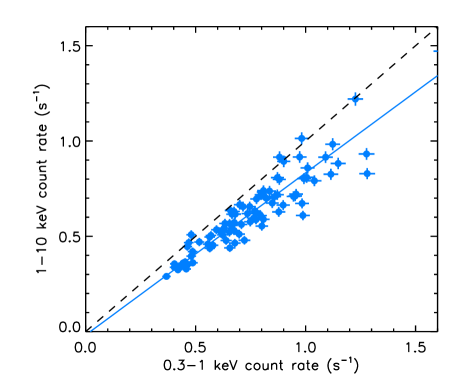
Plotting the X-ray soft count rate versus the hard count rate is a simple and model-independent way to test for spectral variability (e.g., Churazov et al., 2001). A visual inspection of Fig. 2, which shows the plot of the soft (0.3–1 keV) and hard (1–10 keV) energy band count rates, suggests the presence of a strong positive correlation. The dashed line represents the perfect one-to-one correlation (), whereas the continuous line, , indicates the best linear fit obtained using the routine fitexy (Press et al., 1997), which accounts for the errors not only on the y-axis but along the x-axis as well, and will be adopted in the rest of the paper for any linear correlation analysis. The best-fit intercept value consistent with zero rules out the presence of a non variable X-ray component. The best-fit slope less than unity is consistent with a “softer when brighter” spectral variability trend. The non-negligible scatter (especially at higher count rates) indicates that, on top of the flux-related spectral variability pattern, there also exist additional flux variations of moderate amplitude.
3.2 UVOT variability
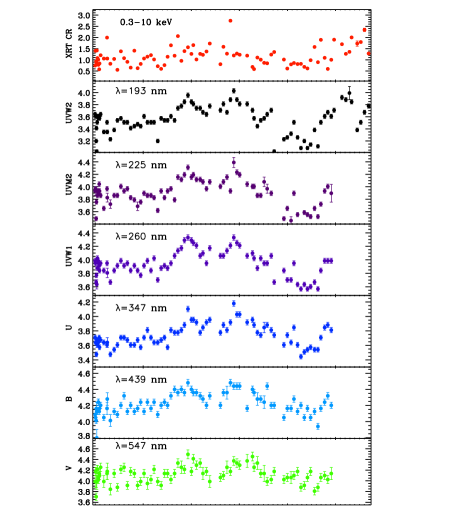
The light curves obtained from the six UVOT filters (and, for completeness, from the XRT) are shown in Fig. 3. The plotted optical and UV time series are the flux densities in units of mJy and have been corrected for Galactic absorption. All UVOT light curves appear to vary substantially (with larger amplitudes at higher energies) on timescales of months with two pronounced peaks roughly occurring 200 and 300 days after the beginning of the SWIFT campaign. According to a test, all UVOT light curves show significant variability with ranging from 3671/76 for the UVW2 filter to 288/76 for the V filter. The presence of significant variability at all wavelengths is confirmed by a fractional variability analysis that yields: %, % %, % %, %.
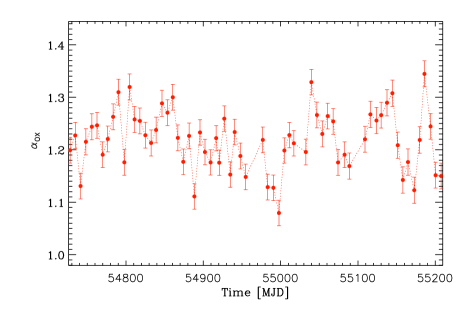
Model-independent information on the broadband spectral variability can be inferred by studying the temporal evolution of the broadband spectral index , where and are the monochromatic luminosities corrected for Galactic absorption (Tananbaum et al., 1979). We derived from the simultaneous X-ray and UVW1 filter fluxes, and plotted the light curve in Figure 4, which confirms the presence of long-term variability of the SED: %.
In summary, the long-term SWIFT campaign of PKS 0558–504 confirms the presence of significant large-amplitude variability in all bands probed by the UVOT and XRT, with the X-ray band being by far the most variable (%) followed by the UV band (%) and finally the optical band (%).
4 Inter-band Correlation analysis
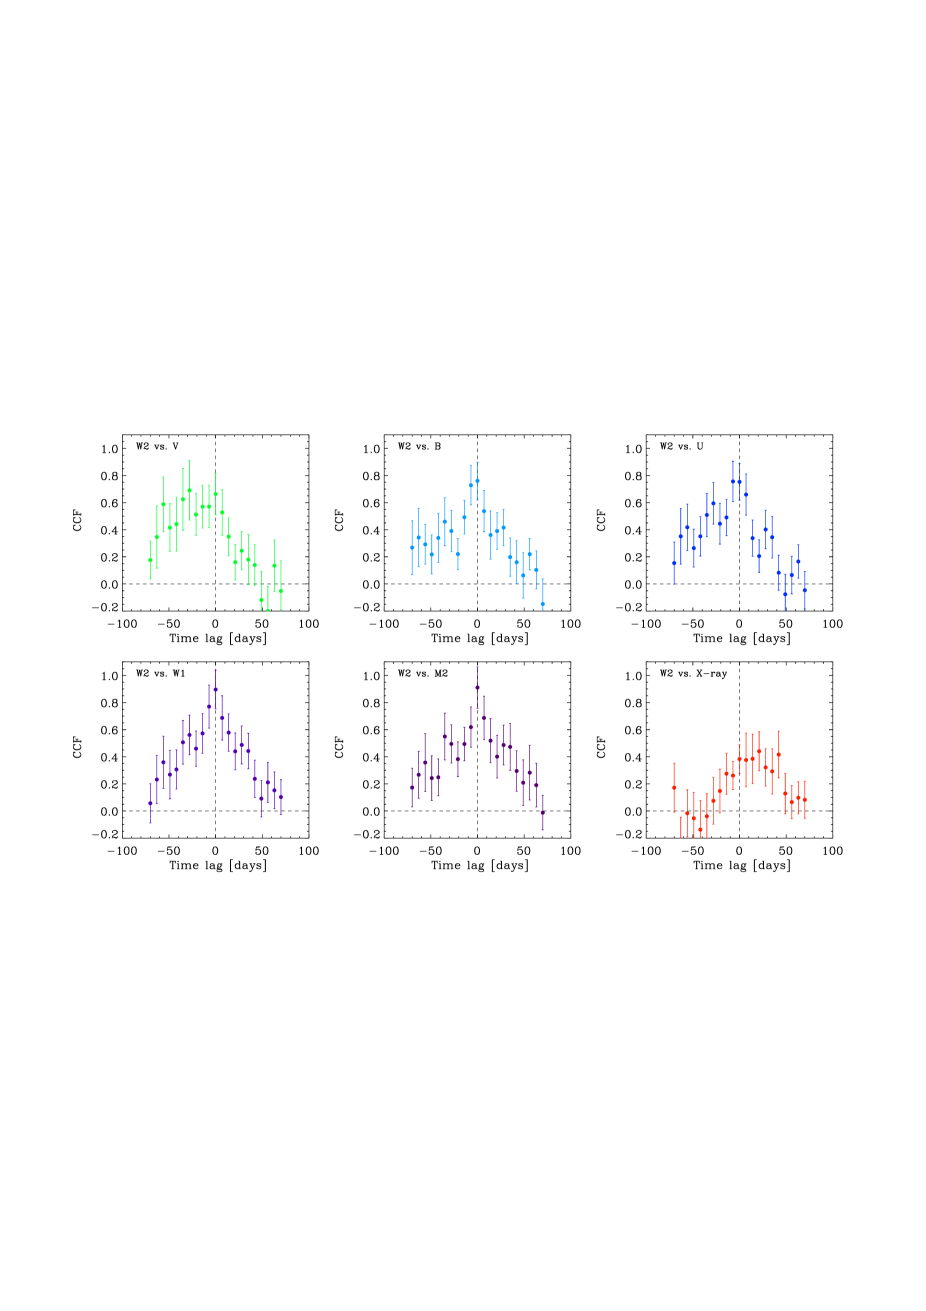
Important physical insights into the nature of the central engine of PKS 0558–504 may be obtained from the time delay between the changes occurring in the different energy bands probed by the XRT and UVOT. To this end, we calculated the cross correlation function (CCF) between the UVW2 flux (which is the most variable UVOT band and likely tracks the behaviour of the inner disc) and the other UVOT filters as well as the count rate in the 0.3–10 keV energy band.
We used the discrete correlation function (DCF) method of Edelson & Krolik (1988) to compute the correlation function at lags , where days. To estimate the DCF at each lag, , we used data points with a time separation of days. Positive lags mean that the reference light curve (i.e., UVW2) leads, negative lags indicate that the reference light curve follows. The resulting CCFs are shown in Figure 5. The CCF amplitude rises from in the case of the UV/X-ray CCF, to and in the case of the UV/optical band and UV/UV CCFs, respectively. Interestingly, the CCFs are skewed towards negative lags when UVW2 is correlated with the optical bands. The CCF is roughly symmetric when UVW2 is correlated with the other UV bands, and becomes strongly skewed towards positive lags when correlated with the X-ray light curve. This is an indication that the optical band variations lead those in the UV band, which in turn lead the variations in the X-ray band. Furthermore, the correlation is weaker between the UV and the X-ray/optical band light curves, which is not surprising, given the fact that the optical band light curves are much “smoother” than the UV band light curves, while the opposite is true for the X-ray band light curve (see Fig. 3).
In Table 3, in addition to the maximum values of the CCF, we report the time delays (“Lags”) between the various bands along with their respective 68% errors that were estimated using the Monte Carlo simulation approach proposed by Peterson et al. (1998). For each light curve pair, that we cross-correlated, we produced 5000 simulated light curves following their “random subset selection” prescription. We computed the DCF of each “synthetic” light curve pair, in the same way as we did with the observed light curves. We recorded the time lag, , with the maximum CCF value, CCFmax, and then we used all the neighboring time lag values with CCF values larger or equal than 0.75 CCFmax to estimate their mean, which we accept as the “centroid time lag”, for each simulated light curve pair. We used the 5000 values to build up its distribution function, and we estimated its median (which is what we list as “Lag” in Table 3) and the 68% confidence limits. Although there is not a statistically significant detection of a delay between any of the light curve pairs considered (all the “lags” listed in Table 3 are consistent with zero within their 90% confidence limits), the lags appear to be in agreement with the visual inspection of Fig. 5 that we discussed above. The delays are negative and decrease with decreasing energy “separation” between the the UVW2 and the other optical and UV band light curves, while the delay becomes positive in the case of the UVW2 and the X-ray band light curve. This putative trend appears to be at odds with the X-ray reprocessing scenario (where the X-ray flux changes lead the UV and optical variations) and is instead consistent with a scenario where variations are produced in the outer part of the accretion flow and propagate inwards, affecting first the optical, then the UV and lastly the X-ray light curves.
| Energy bands | Lag (d) | ccfmax |
|---|---|---|
| (1) | (2) | (3) |
| UVW2 X-ray | ||
| UVW2 UVM2 | ||
| UVW2 UVW1 | ||
| UVW2 U | ||
| UVW2 B | ||
| UVW2 V |
Columns Table 3: 1= Correlated energy bands. 2= Lags measured in days with the 68% errors. 3= Maximum of CCF with the 68% errors.
5 Broadband Spectral Analysis
In this section, we investigate the evolution of the broadband SED of PKS 0558–504 over 1.5 years. For this purpose, we follow the procedure adopted in our previous work on the short-term evolution of the SED of PKS 0558–504 and utilize a spectral model that comprises a disc and two Comptonisation components, discPN+WABS(BMC+BMC), which yielded adequate fits of the SEDs obtained from contemporaneous observations of SWIFT and XMM-Newton in September 2007 (Gliozzi et al., 2010). The absorption model WABS, with fixed at the Galactic value, is only applied to the Comptonisation models because the optical and UV data, which are fitted with discPN, have already been corrected for Galactic absorption.
The discPN model (Gierliński et al., 1999) is a generalization of the disc black body which includes corrections for the temperature distribution near the black hole. This model has three parameters: the maximum disk temperature , the inner radius , and the normalization , which depends on the black hole mass, the distance, the inclination angle , and the colour factor . The BMC model (Titarchuk et al., 1997) is a simple and robust Comptonisation model that can describe both thermal and bulk Comptonisation processes; it is characterized by four parameters: the temperature of the thermal seed photons , the energy spectral index (where ), a parameter related to the Comptonisation fraction (i.e., the ratio between the number of Compton scattered photons and the number of seed photons) by the relation , and the normalization , where is the luminosity in units of and is the distance in units of 10 kpc.
First, we fitted the UVOT data and the hard X-rays ( keV) with the discPN model and one BMC model only (hereafter ), keeping fixed at and leaving the other parameters (, , , , , and ) free to vary. We also kept the temperature of seed photons of the Comptonisation model fixed to the maximum temperature of the accretion disc, since we assume that the seed photons are produced by the disc. Then, we considered the 0.3–1 keV soft X-ray data and added another BMC component (hereafter ), keeping the parameters fixed at their best fit values (except for which is free to vary). We found that was significantly different from zero in the vast majority of the cases. This result indicates that a “soft excess” (i.e., a significant flux in excess to the extrapolation of the BMC2 component to energies 1 keV) is present in nearly all the XRT observations. This is a well known result for PKS 0558–504, as this soft excess has been detected in all previous observations with all the major X-ray satellites in the last two decades (e.g., Leighly, 1999; O’Brien et al., 2001; Brinkmann et al., 2004).
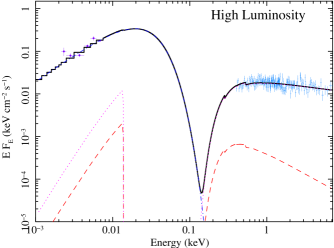
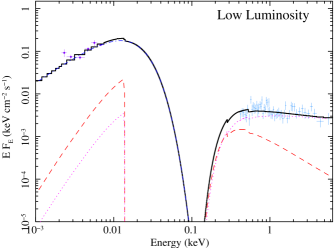
All SEDs are reasonably well fitted with this model: for all broadband spectra the reduced values range between 0.75 and 1.54 with a mean value of 1.10 and a standard deviation of 0.16 for an average number of degrees of freedom of 95. Two examples of SEDs fitted with the model described above, that represent the highest (MJD=54997.82) and lowest (MJD=55144.51) luminosity occurrences of PKS 0558–504 during the SWIFT campaign, are shown in Figure 6. Both SEDs are well fitted by this model (=1.18 and 1.28 for high- and low-, respectively), they are clearly dominated by the disc emission and have similar shapes: the spectral parameters are consistent within their uncertainties, with eV, , , , . Similar values are found for all SEDs. More specifically, the temperature of the disc appears to be fairly stable, whereas the disc normalization changes considerably (see below for more details). For BMC2 (the Comptonisation model parametrizing the hard part of the X-ray spectrum) ranges between 1.6 and 2.4, and between 0.5 and 2. For BMC1, all the parameters are poorly constrained with consistently steep () and that shows systematically high values and hence was fixed at 2.
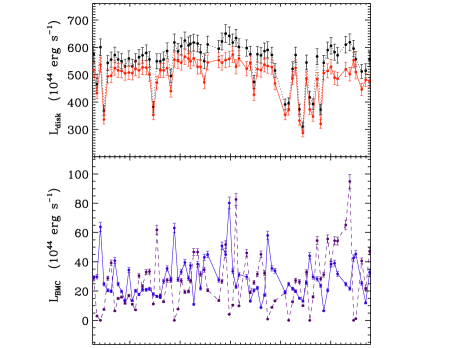
Figure 7 shows the evolution of the luminosity values (in units of ) associated with the different spectral components. The top panel represents the temporal evolution of the disc luminosity (continuous line), which has a mean value of , and of the total luminosity (dotted line, ) that is obtained by integrating the best fit model between 0.001 and 10 keV. The close similarity between the two patterns and the consistency between the respective values of fractional variability () confirms that total luminosity changes are dominated by . The bottom panel shows the temporal evolution of the luminosities associated with the two BMC components (obtained by their integration over the 0.1–10 keV energy range; , ). Both light curves are characterized by continuous large-amplitude changes, which do not appear to correlate. and are well determined, but the decomposition between and may not be very accurate, since the latter extends to energy below 1 keV. As a consequence, it is the 0.3–1 keV flux and not the flux that better reflects the soft excess contribution.
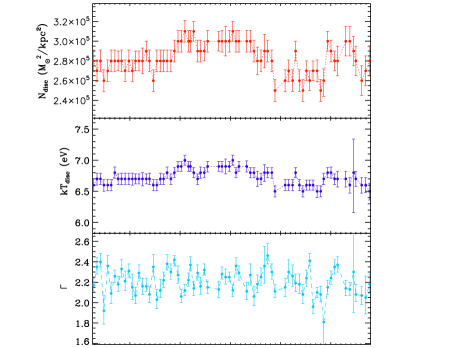
Due to the short exposures (and hence low S/N in the spectra) inherent in the monitoring approach, the best fit parameter values of the disc and Comptonization components are not well constrained. As a result, despite the fact that the disc, BMC1 and BMC2 luminosities are clearly variable, we cannot determine which model parameter is the main driver of these variations, as all model parameters are consistent with the hypothesis of being constant (due to the large errors associated with them). For this reason, we repeated the model fitting procedure of the broadband SEDs twice. In the first case, we kept fixed to the mean of the best-fit values from the previous fit (which is equal to 6.8 eV), and let all the model parameters free to vary following the fitting procedure described above. In the second case, we kept fixed to the mean of the best-fit values from the previous fit (which is equal to ). The results of this spectral fitting procedure are shown in Fig. 8, where, for comparison, we also plot the hard X-ray photon index in the bottom panel. According to a test, , , and appear to be variable, however, a fractional variability analysis (, respectively) favors as the main driver of the disc luminosity.
To shed some light on the link between disc and corona and specifically on the origin of the seed photons that are subsequently Comptonised by the corona, we have studied the correlation between the hard photon index (which parameterizes the coronal activity) and three different fluxes: the disc flux, the soft-excess flux, and the hard X-ray flux. The results of this analysis, performed keeping fixed to the mean value obtained from all the best fits, are shown in Figure 9. A visual inspection of this figure reveals that only the flux associated with the soft-excess shows a clear positive trend. This finding is confirmed by the formal fitting of the data, , as well as by the Spearman’s and Kendalls’s rank correlation coefficients ( and , respectively) and their associated chance probabilities (). On the other hand, no statistically significant correlation is found for vs. (, and ), or for vs. (, and ).
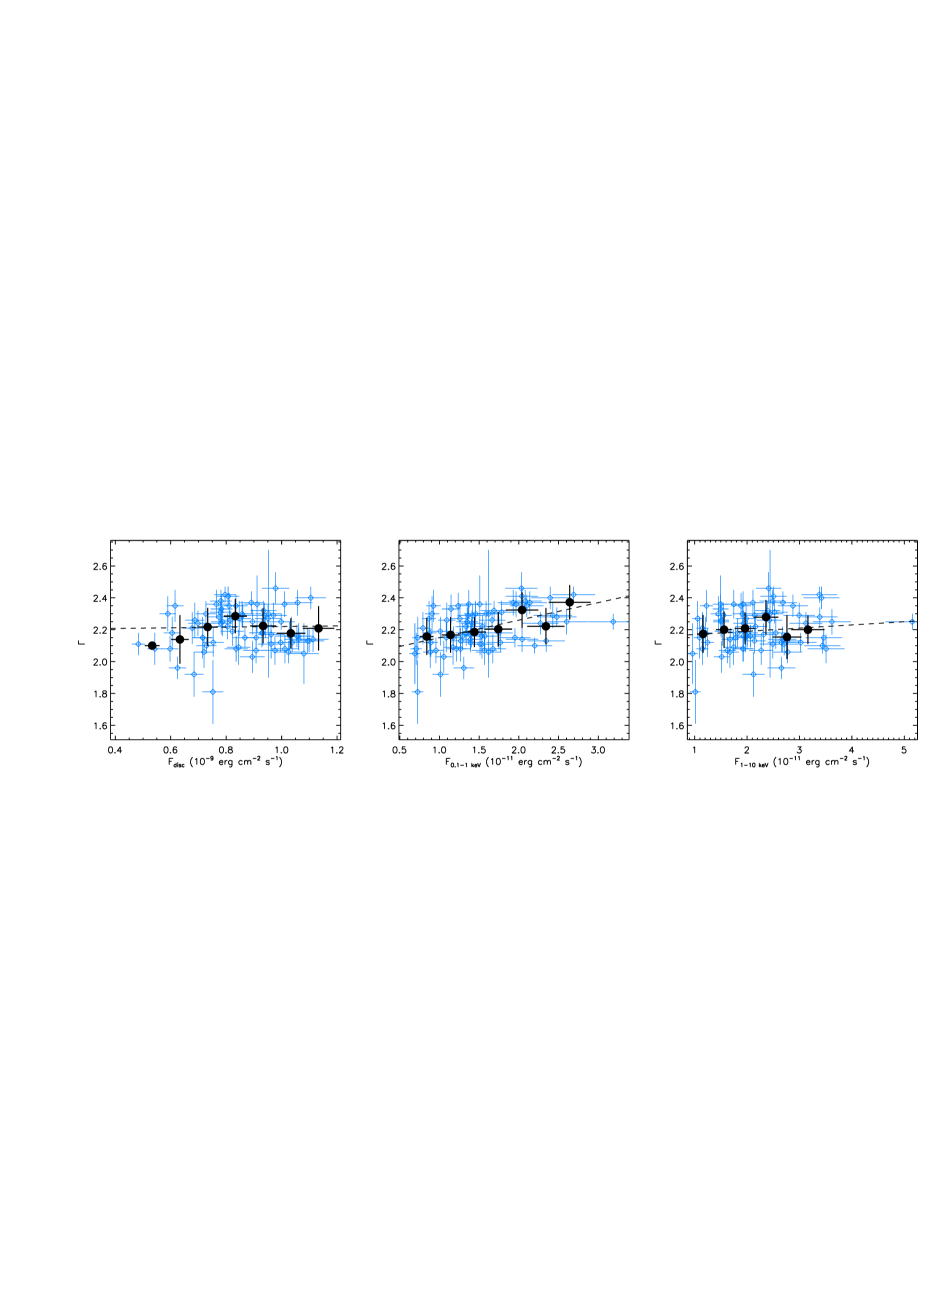
In conclusion, the overall SEDs of PKS 0558–504 are adequately fitted by a disc model parameterizing the optical/UV emission and two Comptonisation components that respectively describe the soft excess and coronal emission. The SED is dominated by a variable disc component (), with substantial contribution from the two highly variable Comptonisation components ( and ). The coronal changes parameterized by the hard X-ray photon index appear to be correlated with the soft excess flux suggesting that the latter component is the source of the seed photons.
6 Discussion and Conclusion
To put in context the main findings of our 1.5 year SWIFT monitoring campaign of PKS 0558–504, we will summarize the most relevant observational results and discuss their implications.
-
•
X-ray flux and spectral variability: Throughout the 1.5 year SWIFT XRT monitoring campaign, PKS 0558–504 showed continuous large-amplitude flux variations with similar variability levels in the soft and hard X-ray band: %. Analogous values of were measured in the 1-year RXTE monitoring between March 2005 and March 2006, suggesting that the variability level of PKS 0558–504 is considerably stable over a time interval of several years and an energy band ranging from 0.3 to 15 keV.
Model-independent analyses based on long-term XRT data revealed that soft (0.3–1 keV) and hard (1–10 keV) X-ray count rates appear to broadly vary in concert, as indicated by the similar variability trends in Fig. 1 and by the tight correlation in the soft-hard count rate plot (see Fig. 2). The apparent variability of the light curve (shown in the bottom panel of Fig. 1 and confirmed by a test) and the substantial scatter in the soft-hard count rate plot indicate the presence of significant spectral variability in the 0.3–10 keV band, which can be explained by the presence of a second component in the X-ray band (i.e., the soft excess) whose variability properties are not identical to those of the hard X-ray component.
The results from the broad-band fits to the optical/UV/X-ray spectra indicate significant spectral variability within the 1–10 keV, as indicated by the variations in Fig.8. Furthermore, the plot of vs. soft X-ray flux (see the middle panel of Fig. 9), reveals the existence of a positive correlation and suggests that the soft excess is the source of seed photons for the corona. In this scenario, the soft excess may physically represent a “hot skin” on top of the disc, which is adequately fitted by a low-temperature Comptonisation component, in agreement with previous spectral analysis based on higher quality X-ray spectra from XMM-Newton (Brinkmann et al., 2004; Papadakis et al., 2010a). Correlations between soft photons and hard photon index represent one of the strongest evidence in favor of Comptonisation in radio-quiet AGN, as demonstrated by recent work on different AGN (see, e.g., Nandra et al., 2000; Done et al., 2012; Petrucci et al., 2013)
On the other hand, there is no clear evidence for a strong positive correlation between and hard X-ray flux (see Fig. 9 right panel), which is typically observed in Seyfert galaxies when is plotted versus the hard X-ray flux (e.g., Papadakis et al., 2002; Sobolewska & Papadakis, 2009). However, it must be kept in mind that PKS 0558–504 accretes at a higher level (based on the SWIFT data PKS 0558–504 appear to accrete at super-Eddington rate with , where the range encompasses the variability of the integrated and the uncertainty on the black hole mass) compared to typical Seyfert galaxies. Interestingly, this spectral behaviour is consistent with our findings based on the long-term RXTE campaign of PKS 0558–504 in the 2–15 keV band which we interpreted as an indication that PKS 0558–504 is a large-scale analog of GBHs in highly-accreting intermediate spectral state.
-
•
Optical and UV variability: Although previous studies revealed the UV dominance of the SED of PKS 0558–504 (e.g., O’Brien et al., 2001), the brevity of the observations hampered a meaningful study of the UV variability. The long-term monitoring with the SWIFT UVOT made it possible for the first time to investigate simultaneously the variability in the optical and UV bands, which are crucial to probe the activity of the accretion disc. Our 1.5 year SWIFT campaign revealed that PKS 0558–504 is significantly variable in all the energy bands covered by the UVOT with moderately large amplitude variations occurring on timescales of months with variability levels increasing from the reddest (%) to the bluest filter (%). The UVOT variability is substantially lower than the X-ray variability, in agreement with the findings of Grupe et al. (2010), who studied the variability of the largest sample of AGN with simultaneous coverage of the UV and X-ray energy ranges and found that UV emission only varies marginally.
The disc component is reasonably well fitted by a discPN model and the variability appears to be dominated by variations of the disc normalization, which depends on physical properties of the system that are constant (such as the distance, the black hole mass, and the inclination angle) and on the colour factor, whose temporal evolution is poorly understood. The limited number of data points in the optical-UV bands do not allow to use more sophisticated disc models that may provide more direct clues on the dominant variable physical parameters of the accretion flow. Nevertheless, following Dexter & Agol (2011), we can speculate that the disc variations observed in PKS 0558–504 can be explained by local fluctuations in a strongly inhomogeneous disc.
A model-independent analysis based on the light curve of confirms the presence of persistent broadband spectral variability with ranging between 1.10 and 1.35. The existence of significant intrinsic variability, %. is in agreement with recent findings from Vagnetti et al. (2013) that were derived from a systematic study of the variability of the bright, soft X-ray selected sample of AGN observed with SWIFT (Grupe et al., 2010). Combining the variability range of with the fact that throughout the monitoring campaign the hard X-ray photon index varies in the 1.8–2.4 range, makes it possible to locate PKS 0558–504 in the region of the diagram consistent with GBHs in the intermediate state (see Figure 6 of Sobolewska et al. 2009).
-
•
Correlation analysis: A combined study of the SWIFT UVOT and XRT light curves of PKS 0558–504 indicates that the UVW2 data are highly correlated with all the other UVOT bands and weakly correlated with the XRT. A CCF analysis confirms these results and suggests the presence of an evolution trend in the time lags, although not at a statistically significant level. More specifically, the changes in the optical bands appear to lead those in the UV bands, which in turn lead the X-ray variations.
These results do not support the “reprocessing model”, where the UV variable component is thought to be caused by X-ray irradiation from the corona. Indeed, several past studies have favored this model for different AGN (e.g., Mrk 79, Breedt et al. 2009; NGC 3783, Arévalo et al. 2009; NGC 4051, Breedt et al. 2010), including a recent work based on the long-term SWIFT monitoring of the low mass AGN, NGC 4395 (Cameron et al., 2012). However, in the reprocessing scenario X-ray changes are predicted to lead the UV, which in turn should lead the optical band variation, which is at odds with the observational results of PKS 0558–504.
On the other hand, this trend appears to be consistent with a scenario where perturbations rapidly propagate from the outer part of the accretion flow (responsible for the optical emission) to the inner hotter region (that emits UV and is closely connected to the X-ray emitting corona). A possible problem with this interpretation is that the time lags inferred from the CCF analysis (see Table 1) appear to be significantly shorter than the predicted propagation timescales in a standard accretion disc (e.g., Frank, King, & Raine, 2002). However, the apparent discrepancy between measured time lags and predicted propagation timescales can be reconciled considering that PKS 0558–504 is likely accreting at or above the Eddington rate and therefore its accretion flow cannot be parametrized by a standard accretion disc but rather by a slim disc whose typical timescales are considerably shortened (e.g., Kawaguchi, 2003).
Another possible problem for the propagation model is the amplitude of the variations: the fractional variability measured in the UV bands is larger than the one measured in the optical bands both in percentage and using physical units (i.e., multiplying by the average luminosity in each specific energy band: , , , , , ). However, the emission from the inner disc regions can be additionally affected by localized variations which do not influence the emission of the optical band produced at larger radii. If these putative variations are of larger amplitude (which is plausible, since most of the energy is released in the inner part of the disc), then the different levels of variability of PKS 0558–504 measured by the UVOT can be reconciled with the inward propagation scenario. Furthermore, these extra variations may also explain the fact that the correlation between the UV and the optical bands is not as strong as the correlation among UV bands. This scenario can also explain the observed delay of X-ray light curves with respect to the UV.
In conclusion, our study confirms that PKS 0558–504 is a highly accreting system, whose optical, UV, and X-ray radiation is dominated by accretion-related emission. On long timescales, PKS 0558–504 is highly variable at all wavelengths probed by the SWIFT UVOT and XRT with variability levels decreasing from the X-rays (%), to the UV (%), to the optical band (%). The large-amplitude variations measured by the bluest UV filter (UVW2) are highly correlated with all the other UVOT bands and weakly (but significantly) correlated with the X-ray variations, implying a physical link between disc and corona. The CCF results provide suggestive evidence for perturbations that rapidly propagate from the outer to the inner parts of the accretion flow and to the corona, favoring the inward propagation scenario over the reprocessing one. However, the latter cannot be completely ruled out, since it may occur and dominate on timescales shorter than those probed in our long-term campaign with weekly cadence. Finally, the positive correlation between the soft X-ray flux and the hard photon index suggests that in PKS 0558-504 the seed photons are provided to the corona by the soft excess component, which may represent the “hot skin” of the accretion disk.
This work demonstrates that the simultaneous investigation of
UV, optical, and X-ray variability in AGN is one of the most
effective tools to shed light on their central engine. Further progress
can be obtained by targeting highly variable, clean systems (i.e., without prominent
intrinsic absorption, warm absorbers, and jets), whose and
are well constrained.
Acknowledgements
MG acknowledges support by the SWIFT Guest Investigator Program
under NASA grant 201564. DG acknowledges support from the NASA Swift program
through contract NAS5-00136.
References
- Arévalo et al. (2008) Arévalo et al. 2008, MNRAS, 389, 1479
- Arévalo et al. (2009) Arévalo et al. 2009, MNRAS, 397, 2004
- Arnaud (1996) Arnaud, K. 1996, in ASP Conf. Ser. 101, Astronomical Data Analysis Software and Systems V, ed. G. Jacoby & J. Barnes (San Francisco: ASP), 17
- Bennet et al. (2003) Bennet, C.L. et al. 2003, ApJS, 148, 1
- Breedt et al. (2009) Breedt E., et al. 2009, MNRAS, 394, 427
- Breedt et al. (2010) Breedt, E., et al. 2010, MNRAS, 403, 605
- Breeveld et al. (2010) Breeveld, A.A., et al. 2010 MNRAS, 406, 1687
- Brinkmann et al. (2004) Brinkmann, W., Arévalo, P., Gliozzi, M., Ferrero, E. 2004, A&A, 415, 959
- Burrows et al. (2005) Burrows, D. et al. 2005, Space Sci. Rev., 120, 165
- Cameron et al. (2012) Cameron, D.T., et al. 2012, MNRAS, 422, 902
- Cardelli et al. (1989) Cardelli, J.A., Clayton, G.C., & Mathis, J.S. 1989, ApJ, 345, 245
- Churazov et al. (2001) Churazov, E., Gilfanov, M., & Revnivtsev, M. 2001, MNRAS, 321, 759
- Constantin et al. (2009) Constantin, A., et al. 2009, ApJ, 705, 1336
- Dexter & Agol (2011) Dexter, J. & Agol, E. 2011, ApJ, 727, L24
- Done et al. (2012) Done, C., Davis, S.W., Jin, C., Blaes, O., & Ward, M. 2012, MNRAS, 420, 1848
- Edelson & Krolik (1988) Edelson, R.A. & Krolik, J.H. 1988, ApJ, 333, 646
- Emmanoulopoulos et al. (2012) Emmanoulopoulos, D., et al. 2012, MNRAS, 424, 1327
- Fossati et al. (2000) Fossati, G., Celotti, A., Chiaberge, M., et al. 2000, ApJ, 541, 153
- Frank, King, & Raine (2002) Frank, J., King, A., & Raine, D. J. 2002, Accretion Power in Astrophysics (Cambridge: Cambridge Univ. Press)
- Gehrels (2004) Gehrels, N. et al. 2004, ApJ, 611, 1005
- Gierliński et al. (1999) Gierliński, M. et al. 1999, MNRAS, 309, 496
- Gliozzi et al. (2000) Gliozzi M., Boller Th., Brinkmann W., Brandt W.N. 2000 A&A 356, L17
- Gliozzi et al. (2006) Gliozzi M., Sambruna, R.M., Jung, I., et al. 2006a, ApJ, 646, 61
- Gliozzi et al. (2007) Gliozzi M., Papadakis, I.E., & Brinkmann, W. 2007, 656, 691
- Gliozzi et al. (2010) Gliozzi M., Papadakis, I.E., Grupe, D., Brinkmann, W., Räth, C., & Kedziora-Chudczer, L. 2010, ApJ, 717, 1243
- Grupe et al. (2010) Grupe D., Komossa, S., Leighly K.M., & Page, K.L. 2010, ApJS, 187, 64
- Gu & Cao (2009) Gu, M. & Cao, X. 2009, MNRAS, 399, 349
- Hill et al. (2004) Hill, J.E. et al. 2004, Proc. SPIE, 5165, 217
- Kawaguchi (2003) Kawaguchi 2003 ApJ, 593, 69
- Leighly (1999) Leighly, K.M. 1999, ApJS, 125, 317
- Maoz et al. (2000) Maoz et al. 2000, AJ, 119, 119
- Nandra et al. (2000) Nandra, K., Le, T., George, I.M., Edelson, R.A., Mushotzky, R.F., Peterson, B.M., & Turner, T.J. 2000, ApJ, 544, 734
- O’Brien et al. (2001) O’Brien, P.T., et al. 2001, A&A, 365, L122
- Papadakis et al. (2002) Papadakis, I.E., Petrucci, P.O., Maraschi, L., et al. 2002, ApJ, 573, 92
- Papadakis et al. (2010a) Papadakis, I.E., Brinkmann, W., Gliozzi, M., Räth, C., Nicastro, F., & Conciatore, M.L. 2010, A&A, 510, 65
- Papadakis et al. (2010b) Papadakis, I.E., Brinkmann, W., Gliozzi, & M., Räth, C. 2010, A&A, 518, 28
- Peterson et al. (1998) Peterson, B.M., Wanders, I., Horne, K., Collier, S., Alexander, T., Kaspi, S., & Maoz, D. 1998, PASP, 110, 660
- Petrucci et al. (2013) Petrucci, P.-O., Paltani, S., Malzac, J., et al. 2013, A&A, 549, 73
- Poole et al. (2008) Poole, T.S. et al. 2008, MNRAS, 383, 627
- Press et al. (1997) Press, W.H., Teukolsky, S.A., Vetterling, W.T., & Flannery, B.P. 1997, Numerical Recipes (Cambridge: Cambridge Univ. Press)
- Remillard et al. (1991) Remillard R.A., Grossan B., Bradt H.V., Ohashi T., Hayashida K., et al., 1991, Nat 350, 589
- Roming et al. (2005) Roming, P.W.A. et al. 2005, Space Sci. Rev., 120, 95
- Roming et al. (2009) Roming, P.W.A. et al. 2009, ApJ, 690, 163
- Schlegel et al. (1998) Schlegel, D. J., Finkbeiner, D. P., & Davis, M. 1998, ApJ, 500, 525
- Shemmer et al. (2001) Shemmer, O., et al. 2001, ApJ, 561, 162
- Sobolewska & Papadakis (2009) Sobolewska, M.A., & Papadakis, I.E. 2009, MNRAS, 399, 1597
- Sobolewska et al. (2009) Sobolewska, M.A., Gierliński, M., & Siemiginowska, A. 2009, MNRAS, 394, 1640
- Tananbaum et al. (1979) Tananbaum, H., Avni, Y., Branduardi, G., et al. 1979, ApJ, 234, 9L
- Titarchuk et al. (1997) Titarchuk, L., Mastichiadis, A., & Kylafis, N. 1997, ApJ, 487, 834
- Uttley et al. (2003) Uttley et al. 2003, ApJ, 584, L53
- Vagnetti et al. (2013) Vagnetti, F., Antonucci, M., & Trevese, D. 2013, A&A, 550, A71
- Younes, et al. (2011) Younes, G., Porquet, D., Sabra, B., & Reeves, J.N. 2011, A&A, 530, 149
- Wang et al. (2001) Wang, T.G., Matsuoka, M., Kubo, H., Mihara, T., Negoro, H. 2001, ApJ, 554, 233
- Wu & Gu (2008) Wu, Q. & Gu, M. 2008, ApJ, 682, 212
- Zhang et al. (1999) Zhang, Y.H., et al. 1999, ApJ, 527, 719