Phase transformations in methanol at high pressure measured by dielectric spectroscopy technique.
Abstract
Dielectric response in methanol measured in wide pressure and temperature range ( GPa; 100 K 360 K) reveals a series of anomalies which can be interpreted as a transformation between several solid phases of methanol including a hitherto unknown high-pressure low-temperature phase with stability range 1.2 GPa and K. In the intermediate P-T region GPa, K a set of complicated structural transformations occurs involving four methanol crystalline structures. At higher pressures within a narrow range GPa methanol can be obtained in the form of fragile glass ( K, at GPa) by relatively slow cooling.
pacs:
64.70.dg 61.25.Em 61.43.Fs 61.66.HqI Dielectric spectroscopy and phase diagram of methanol
Methanol is a very interesting object for study of its P-T phase diagram because it is the simplest organic substance with only one hydrogen bond per molecule. It can be regarded as a simple (one bonded) approximation of water where one of the hydrogen bonds is capped with alcyl group. It is well-known that the P-T phase diagram of water is extremely complicated, but it turns out that by now it is better studied than the phase diagram of its significantly simpler interconnected counterpart – methanol.
At ambient pressure there are two crystalline phases of methanol – the high-temperature one (just below the melting curve) is a plastic crystal, orientationally disordered -phase which exists in the temperature range K. At lower temperatures -phase transforms into an ordered -phase, stable down to lowest temperatures. It was shown that both these phases persist at least up to pressures about 1.6 GPa Gromnitskaya et al. (2004). There is also one report Allan et al. (1998) where it was demonstrated by the single crystal X-Ray diffraction in diamond anvils, that the high-pressure phase of methanol stable at room temperature in the pressure range GPa (called -phase) is different from the -phase. It should be noted, that this observation contradicts earlier optical studies at high pressures Mammone, Sharma, and Nicol (1980); Eaton, Yuan, and Anderson (1997), where no difference between high- and low-pressure phases was found.
However the phase boundaries, not only between the crystalline phases, but even the melting curve above 2 GPa are not known yet (though the efforts of its determination Bridgman (1942) date back to Bridgman himself). The low entropy and volume changes accompanying the transitions ( 0.6 % , 3 % Staveley and Hogg (1954), 3.8, 18.0 J/(K mole) Carlson and Edgar F. Westrum (1971) at ambient pressure) require high sensitivity of standard methods based on measurement of energy output (like DTA/DSC technique, though these sort of methods were also tried at elevated pressures Würflinger and Landau (1977)). Another complication of experimental studies of methanol at high pressure is the easiness with which methanol can be obtained in metastable liquid phase (supercooled or superpressed) – the feature marked by many researchers who studied methanol at high pressures. For example, the region, for which the viscosity data for liquid methanol Grocholski and Jeanloz (2005); Cook, Herbst, and King (1993) were obtained, overlaps with the region of existence of solid -phase Allan et al. (1998). Computer simulation Gonzalez Salgado and Vega (2010) of methanol phase diagram (despite the tremendous progress made by the computational molecular dynamic in the recent years) predicted hugely overestimated values for transition temperatures and pressures. Though at ambient pressure methanol is practically impossible to obtain in glassy form by the cooling of liquid Anderson et al. (1988), the existence of methanol glass at elevated pressures was widely discussed Piermarini, Block, and Barnett (1973); Brugmans and Vos (1995); Zaug, Slutsky, and Brown (1994); Grocholski and Jeanloz (2005); Cook, Herbst, and King (1993), so methanol is an interesting model object for study of the transitions between various (and variously) disordered phases at high pressure. Structure determination of material composed of light atoms by direct diffraction methods is very technically complicated, especially at high pressures Loveday et al. (2000, 2001). So indirect methods of location of possible phase boundaries (which could be lately refined by the structural studies) are very important in this case.
Liquid and solid methanol at ambient pressure was thoroughly studied by the dielectric spectroscopy (DS) technique Denney and Cole (1955); Davidson (1957); Ledwig and Würflinger (1982); Barthel et al. (1990). This studies give consistent picture of phase transformations in methanol at ambient pressure. Since methanol molecules are highly polar, any arrest of their motions should invariably result in significant change of dielectric susceptibility values. Just that is observed in practice in a sequence of transitions from liquid to -phase and then into -phase ( respectively Denney and Cole (1955); Davidson (1957)). These observations contributed a lot to understanding of disordered nature of -phase. Due to its independence of scanning speed (in contrast to DTA/DSC one) DS technique also allows to avoid the problem of metastable phases and to set practically arbitrary routine for heating/cooling cycles. Combination of all these virtues makes DS almost the method of choice for studies of phase diagram of polar compounds at high pressure. So far, due to the characteristics of standard cylinder-piston setup, the DS applicability was limited to pressures GPa. Only recently this range was significantly extended Pronin et al. (2010a, b); Kondrin et al. (2012) by introduction of toroid-type high-pressure device Khvostantsev, Slesarev, and Brazhkin (2004). In this paper we present results of DS of methanol for pressure and temperature region P GPa, T K and discuss the consequences this data imply for determination of crystal structure of solid methanol in this range.
II Experiment details
The samples of 99.5 % pure methanol (MERCK) were used. The previous research Würflinger and Landau (1977) demonstrated that the influence of impurities ( 1 at. %) on phase transformations in methanol is negligible. In general we follow the same experimental routine as it was outlined earlier Pronin et al. (2010a, b); Kondrin et al. (2012). Experimentally accessible frequency window (10 Hz – 2 MHz) and the precision of dielectric susceptibility measurements () was determined by the device used – QuadTech-7600qua (1997). The capacitance values were measured twice before an experiment: in empty capacitor and capacitor filled with methanol. These values were used later for calculation of dielectric susceptibility at high pressure. “Empty” capacitance readings were about 10 pF, values of “filled” capacitance were related to it according to 30 characteristic of methanol at room temperature. During high-pressure experiments the variation of thermodynamic parameters in crystal phase was possible only along isobars (with typical rate K/min), because otherwise the pressure change would lead to the breakage of the measurement capacitor, so the presented data were exclusively isobaric ones. However the small deformation of measurement capacitor can be expected even in this “mild” regime but the checks of capacitance values after pressure release demonstrated that such deformations were negligible. It was found that the final values of “empty” capacitance are within 5% range of the starting ones. The pressure values during experiments was estimated by the readings of manganin gauge in the liquid phase just prior to the crystallization onset. The rate of temperature variation was not strictly controlled, mostly it was determined by the thermal inertia (quite large) of our setup. The typical cooling rate was about K/min but the heating rate can be varied in the range K/min by the application of external manual heating. Though we weren’t able to repeat exactly cooling/heating cycle at the same P-T conditions several times in a row, but subsequent measurements in similar P-T conditions produced similar results. Since the heating rate was quite small (in comparison, for example, to the “standard” value of 10 K/min adopted for measurements of glass transitions in DTA/DSC experiments) we didn’t observe significant difference of phase transitions temperatures (from the values reported below) depending on the temperature scan rates. Presented results were collected in the process of several high-pressure experiments on different measurement cells.
III Dielectric spectroscopy of solid methanol at high pressure
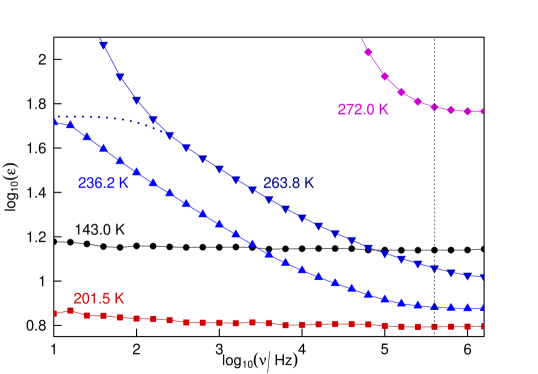
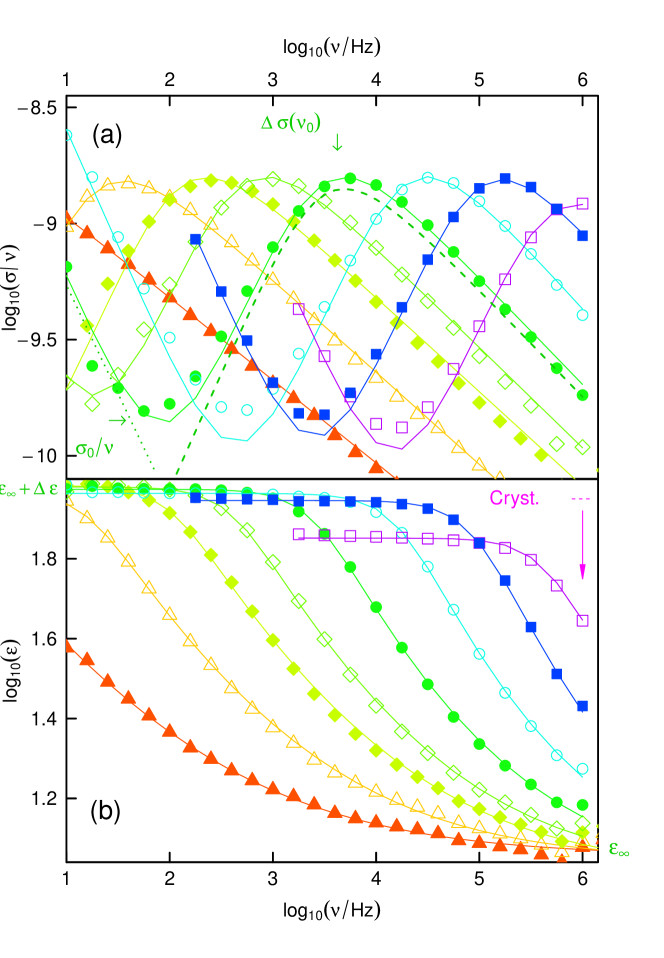
The temperature dependencies of dielectric susceptibility values measured at frequency 300 kHz at different pressures are shown in Fig. 1. The choice of the measurement frequency was influenced by the presence of dispersion observed in our frequency window in unordered methanol phases (some examples at GPa are shown in Figs. 2). Low-frequency dispersion commonly found in liquids is a surface effect and is usually attributed to contact polarization. On the other hand, dielectric dispersion in plastic crystals is an intrinsic/volume property and it is widely observed in plastic crystal phases of mono-alcohols (for example, metastable phase of ethanol Benkhof et al. (1998) or orientationally disordered phases of cyclo-octanol/heptanol Martínez-García et al. (2011)), so methanol is not an exception. Though the dispersion induced by polarization may occur in plastic crystal phases too, especially at high temperatures and the low-frequency range (see the difference between experimentally registered values at K and the dotted line representing the polarization-less dispersion in Fig. 2), but this is not the most prominent feature. Though it may seem quite counter-intuitive, the “static” dielectric susceptibility isn’t the lower-frequency limit but the frequency-independent value above dispersion region (in the particular case of -methanol we just follow the earlier practice Denney and Cole (1955); Davidson (1957)). The frequency value 300 kHz was above dispersion region in the liquid as well as in the -methanol phase so the dielectric susceptibility value measured at this frequency was considered as a “static” one. In all other ordered methanol phases dispersion wasn’t observed so the values measured in such a way practically coincide with the low-frequency ones (Figs. 2, 3).
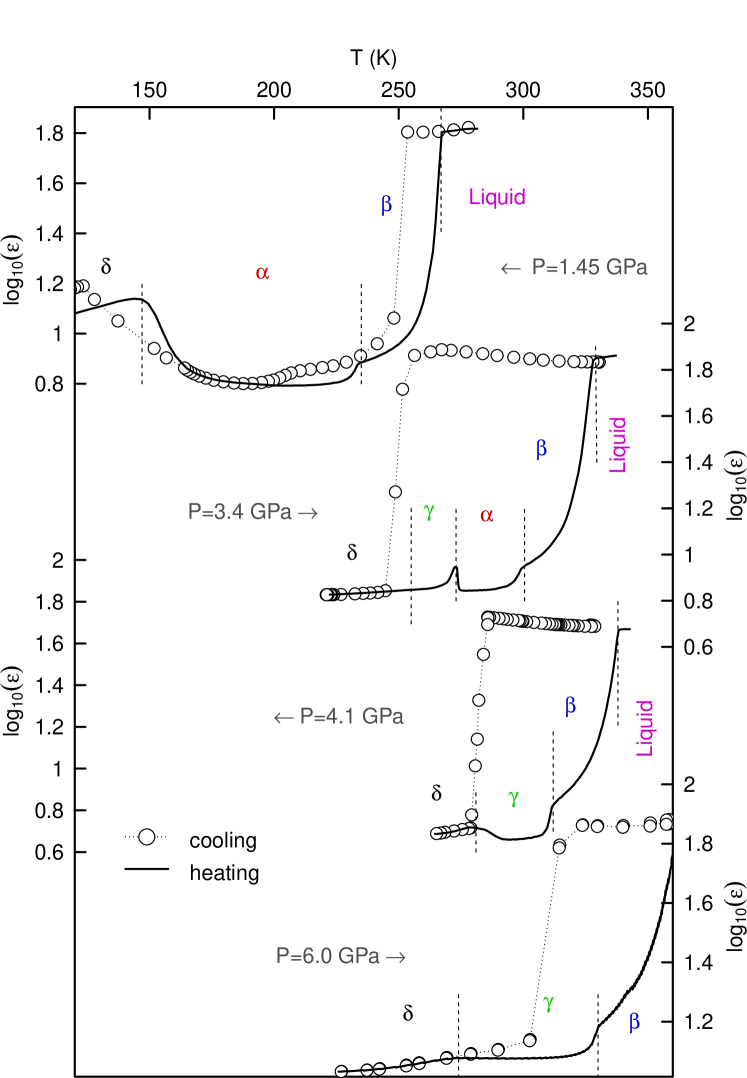
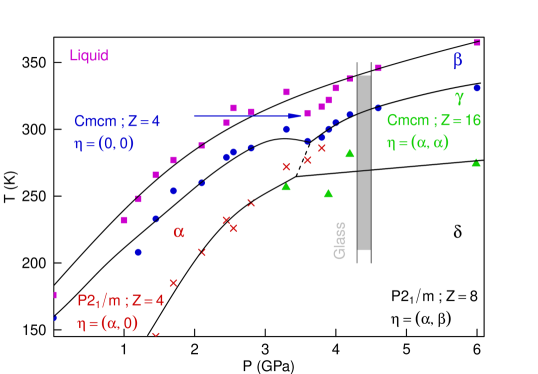
As it can be seen from Fig. 1, the hysteresis between cooling and heating curves spans quite a wide temperature range which significantly increases above 2.0 GPa and exceeds 50 K at GPa. However at all pressures used, the crystallization of the liquid phase did occur as indicated by abrupt drops of dielectric response from 70 (values typical to liquid methanol phase at melting point) to several units. In the process of subsequent heating it was revealed that the supercooled region includes several features (marked by vertical dashed lines in Fig. 1) which should be interpreted as the structural transformations of solid methanol between different crystalline phases. The whole set of these anomalies plotted on P-T plane produces consistent picture (Fig. 4) which is considered as a close approximation of the true thermodynamic phase diagram of methanol.
Though connection between the anomalies in temperature dependence of static dielectric susceptibility and structural transformation is not that straightforward, it is widely observed in practice. Static dielectric susceptibility in quite a number of polar molecular compounds is remarkably robust to variation of temperature. In disordered materials (like liquids) it is inversely proportional to temperature according to the Debye-Onsager-Kirkwood law and is independent of temperature in most of crystalline solids, so in that last case it well deserves its another name ”dielectric constant”. In particular, abrupt changes (especially exponentially large) of dielectric susceptibility value is a good indication of phase transformation taking place in the material studied.
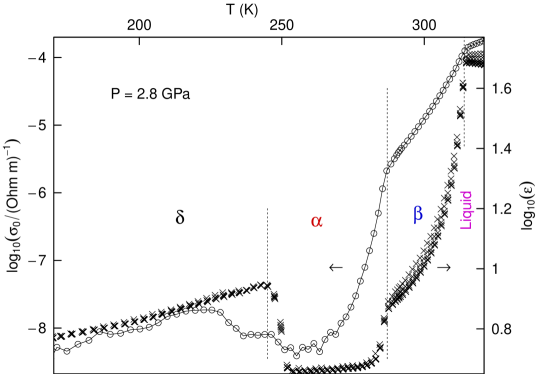
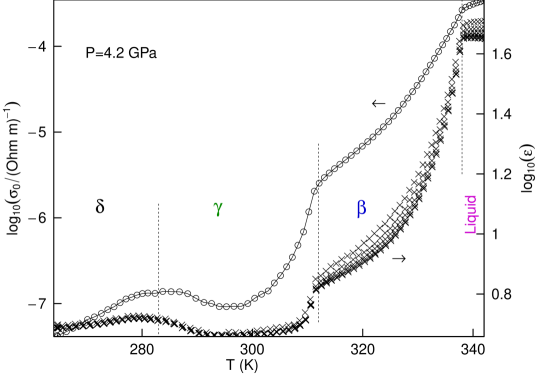
Comparison of this tentative phase diagram (Fig. 4) with available diffraction data Tauer and Lipscomb (1952); Torrie, Weng, and Powell (1989); Torrie et al. (2002); Allan et al. (1998) suggests existence of two high-pressure phases of methanol: the room-temperature one (in pressure range coinciding with that of -phase reported previously Allan et al. (1998)) and unknown before low-temperature phase (marked as -phase in Fig. 4). The transformations of this phase to higher temperatures ones is accompanied by quite significant increase of dielectric constant, though at high pressures (curve P=6.0 GPa in Fig. 1) this transition may be somewhat smoothed due to nonhydrostatic effects which we can not rule out in our experiments at such a high pressure. Determination of the lowest-pressure extreme point of phase boundary was limited by the experimentally available temperature range but at 100 K this boundary is found to be in the pressure range GPa. The -phase seems to be more conductive than the and phases of methanol as suggested by conductivity data in Fig. 3. However we can not bring forward any quantitative assessments, because the conductivity level is very low in this case (the resistance of phase at 2.8 GPa is about of 10 GOhm cm, which is on the edge of capabilities of measurement devicequa (1997)), so the conductivity values below (Ohm m)-1 in Fig. 3 should be considered with certain caution.
Another conclusion following from the phase diagram Fig. 4 is the presence of disordered -phase in the region adjacent to the melting curve in the entire pressure range studied by us. It can be deduced not just from the presence of the step-like anomaly below the melting transition on all curves in Fig. 1 but also from specific dispersion of dielectric response in the radio-frequency range intrinsic to the -phase which was discussed earlier. Also the data shown in Fig. 3 demonstrate very distinct shoulders on the temperature dependence of static conductivity in the vicinity of and phase boundaries. In some way such extended pressure region of -phase stability contradicts the conclusions of Ref. Gromnitskaya et al., 2004 where vanishing of -phase at pressures above 1.6 GPa was conjectured on the ground of their ultrasound data. However no direct evidence (like demonstration of triple point) was presented there, so we believe that in fact there is no contradiction in our data with the previous one.
It is also worth mentioning the evolution of dielectric susceptibility anomalies along , and phase boundaries. Though in the first two cases the anomalies are represented by rather smooth peaks widened with the pressure increase (see curves GPa in Fig. 1 and Fig. 3 too) while transition is always accompanied by very sharp (-like) feature that was regularly observed in the pressure range GPa. Since this feature is strongly dependent on pressure, we had certain difficulties in exact determination of phase boundary so it is approximately designated in Fig. 4 as dashed line. The experimental curve ( GPa) in Fig. 1 demonstrates variation of static dielectric susceptibility between 4 solid phases of methanol.
Another interesting region on the phase diagram of methanol is the range in the vicinity of 3.7 GPa on the melting curve (Fig. 4). There is significant deviation of experimental points from the smoothed line which in some way reflects the trend of and phase boundaries but shifted to higher temperatures. The smoothed lines (solid lines in Fig. 4) in the case of solid methanol phases comply to the thermodynamical phase contact rule which leaves little freedom how the phase boundaries could be placed. On the other hand, the “wiggling” of the melting curve as suggested by experimental data in Fig. 4 would indicate existence of different solid phases below it (for example two phases in our case). However no difference between -phase in low-pressure region (adjacent to -phase) and high-pressure (adjacent to -phase) was found. The most plausible explanation is the certain arbitrariness in the way we have drawn the melting curve – at the end of transition, where is equal at the beginning and the end of the cooling/heating cycles, but not in the middle of melting process, which is much more accepted practice. For example, one may expect that the width of melting transition might be widened in the vicinity of transition, but this certainly requires a more thorough investigation.
Nonetheless our measurements can be considered not just as an independent experimental evidence of existence of high-pressure methanol -phaseAllan et al. (1998) at room temperature, but also as a strong indication of existence of another low-temperature high-pressure -phase.
IV Vitrification of methanol
Quite unexpectedly we obtained methanol in glassy state (Fig. 4) in the narrow pressure range GPa. The process of vitrification is illustrated in Fig. 5 by evolution of structural relaxation in supercooled liquid methanol at pressure GPa and temperature range K. Though relaxation properties of many mono-alcohol liquids have quite complicated character, involving several components of mixed Debye and non-Debye types, in our case we have observed only one non-Debye mode ( in Eq. 1 below) which was fitted by the Cole-Davidson formula Davidson and Cole (1951) with additional direct current contribution (solid lines in Fig. 5):
| (1) |
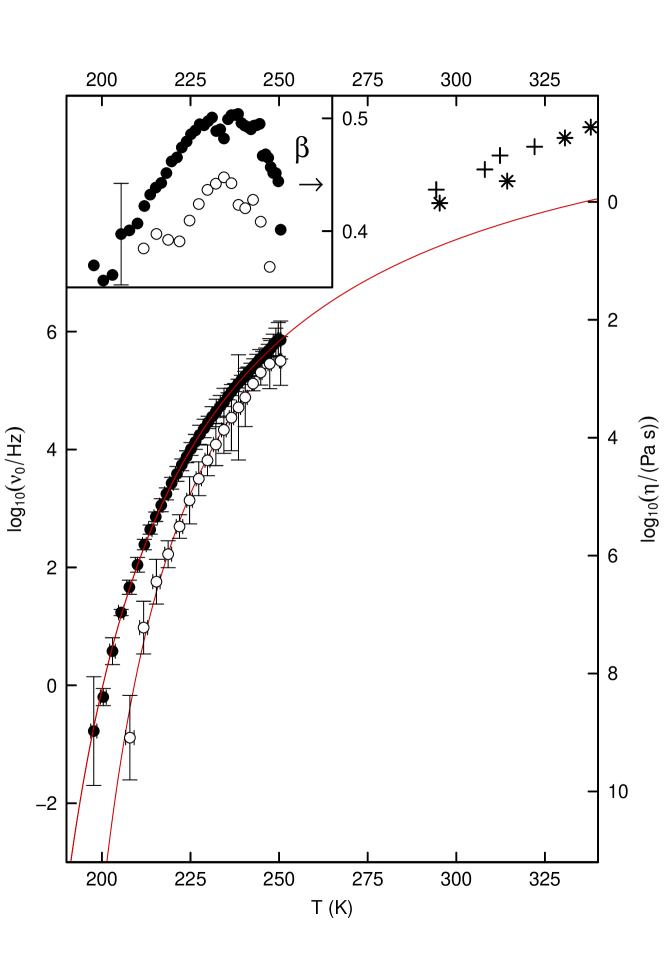
Characteristic frequency of relaxation () is shown in Fig. 6. Temperature evolution of along two isobars is approximated by empirical Vogel-Fulcher-Tamman (VFT) relation:
| (2) |
By extrapolation of experimental data with this formula the vitrification temperatures of methanol at GPa can be obtained as the temperature values at which Hz (= 192 and 202 K respectively). Fragility index , demonstrating how far the relaxation in real liquid is from the Arrhenius one Angell et al. (2000), yields the value about 85, i.e. methanol is more fragile than the popular molecular glassformer glycerol Pronin et al. (2010a, b) at similar pressures.
However, methanol glass obtained in this pressure range is quite unstable and easily crystallizes upon heating. Beginning of the crystallization process is visible in Fig. 5 as a quite large drop of dielectric susceptibility at K, which at even higher temperatures (not depicted here) would bring it to the level of several units (that is on the same level with in Fig. 5). It is interesting to note that this recrystallization process roughly coincides with phase boundary, so the crystal obtained is -phase, which at higher temperatures converts into -phase in accordance with the phase diagram in Fig. 4.
Some parameters of vitrification process can be compared with the literature data. Though (as it was already mentioned) methanol is hard to obtain in glassy form at ambient pressure, it is well known that addition of small amount of water ( mol. % Bermejo et al. (1990)) expedites this process significantly. However, the DS data of vitrification in methanol-water mixtures have only recently became availableSun et al. (2011). In small concentrations (10 and 20 mol. %) the relaxation process clearly consists of two seemingly non-symmetric (and consequently non-Debye) modes, which were ascribed to methanol and water. By fitting methanol component relaxation time published there and using the same conventions as above we obtain values K (depending on water content) and = 65, which are in good accordance with our results. Relatively slow rise of glassification temperature with pressure rising and increase of fragility at high pressure was previously registered in many hydrogen-bonded glassformers (e.g. glycerolPronin et al. (2010a, b)).
Glassy methanol obtained by compression is more controversial topic. First it was introduced by PiermariniPiermarini, Block, and Barnett (1973) as an explanation of widening of ruby R1 fluorescence line observed in diamond anvils filled with pure methanol at 8.6 GPa. However, the glassification pressure 8.6 GPa is almost certainly an error (though it is still occasionally citedLoubeyre et al. (2013)), and most likely this widening was caused by crystallization of methanol at this pressure. Moreover, it was directly disproved by viscosity measurementsCook, Herbst, and King (1993) at similar conditions (8.3 GPa, Pa s, that is quite liquid-like) and analysis of methanol crystallization process at high pressuresBrugmans and Vos (1995). Extrapolation of viscosity data Cook, Herbst, and King (1993); Grocholski and Jeanloz (2005) suggests larger values GPa (depending on the model used), which roughly corresponds to the results of Ref. Brugmans and Vos, 1995. Though the translationally disordered methanol phase was observed at pressures above 10 GPaBrugmans and Vos (1995); Zaug, Slutsky, and Brown (1994), no other information on its nature and relaxation properties is yet available.
We can compare methanol’s DS relaxation frequencies at GPa with viscosity dataGrocholski and Jeanloz (2005) (see Fig. 6) obtained in the same pressure range, but at higher temperatures ( K). Extrapolation of viscosity data by the Arrhenius law yieldsGrocholski and Jeanloz (2005) the values K, but this is surely is an underestimate because this extrapolation does not take into account crossover to steeper dependence (like the VFT one) close to the glassification temperature. Viscosity () and relaxation time () are related to each other by the Maxwell relation:
| (3) |
where is an infinite frequency shear module. It is of order GPa for common window-pane glass, but for small molecule organic glassformers it is likely to be lower and lays in the range GPa (characteristic for two popular molecular glassformers DGEBA and glycerol respectively) Schröter and Donth (2002). For methanol we choose the value 1 GPa which is comparable by order of magnitude with the value suggested by the viscosity data of its close analog – ethanolStickel, Fischer, and Richert (1996). Though VFT fit of our data yields a slightly underestimated value of characteristic frequency than one would expect from viscosity data (Fig. 6), this sort of discrepancy was already observed in molecular galssformers (see the comparison of “Maxwell” and DS times in DGEBA in Ref. Schröter and Donth, 2002). There may be two sources of this discrepancy: either the contribution of another high-frequency process to the overall viscosity (as a result the substance is less viscous than it could be expected from the consideration of only one low-frequency relaxation), or, most probably, the dynamic crossover observed in most of organic molecular glassformersStickel, Fischer, and Richert (1996). For example the extrapolation of low temperature data in ethanol at ambient pressure by the VFT relation produces underestimated values of characteristic frequency Lunkenheimer et al. (2010).
Still our measurements are the first parametrization of glass transition in methanol and the first report of vitrification of methanol by cooling at high pressure.
V Discussion
The most interesting question arising from our measurements is if there is relation between vitrification of methanol and phase transitions taking place in adjacent pressure ranges. Answering this requires closer examination of diffraction data available from literature Tauer and Lipscomb (1952); Krishna Murti (1959); Torrie, Weng, and Powell (1989); Torrie et al. (2002). The main point of this examination is establishing the type of phase transformations observed in methanol at high pressures. Indeed the ordering of hydrogen bonds in solid methanol at lower temperatures can be formally described by a symmetry loss. This sort of transformations is described as displacive or order/disorder ones which as a rule bring about quite small energy output in the transition. On the other hand, another type (called reconstructive) of phase transitions accompanied with formation of new bonds (and new symmetry operations, not present in high or low temperature phases) will produce a much higher energy output (see e.g. Refs. Izyumov and Syromyatnikov, 1990; Tolédano and Tolédano, 1990; Tolédano and Dmitriev, 1996). Though the energy of hydrogen bonds present in molecular methanol isn’t large, but one may expect that reconstructive phase transitions in solid methanol (for example in transformation) would result in much greater enthalpy output than registered in practice Staveley and Hogg (1954). It was already shown that this output (as suggested by Ref. Würflinger and Landau, 1977) as well as the volume effectGromnitskaya et al. (2004) diminishes with pressure rising, so one may assume that the phase transformations in methanol (at least one) are displacive. Thus a certain restrictions may be applied to the experimental structural data reviewed below.
Though all the authors Tauer and Lipscomb (1952); Torrie, Weng, and Powell (1989); Torrie et al. (2002) are unanimous about the structure of phase (space group with 4 molecules per conventional unit cell ), there is disagreement about the -phase. The controversy can be summarized as whether transformation leads to multiplication of the unit cell or loss of inversion center in the -phase. The first X-Ray measurements of single-crystal Tauer and Lipscomb (1952) and polycrystalline Krishna Murti (1959) samples demonstrated that the center of inversion is retained (space group ), but the conclusion about the cell size was not that certain. The value was suggested as a preferred one but allowances Tauer and Lipscomb (1952) were made for larger cell which is twice the original primitive unit cell with duplication of parameter. Next 30 years of optical Falk and Whalley (1961); Wong and Whalley (1971); Dempster and Zerbi (1971); Durig et al. (1971); Franck and Deul (1978); Mammone, Sharma, and Nicol (1980); Anderson et al. (1988) and NMR Garg and Davidson (1973) research demonstrated that the number of optical modes is only compatible with prepositions that either , or there is no inversion center, or both. The structure version with orthorhombic lattice (; ) suggested lately Torrie, Weng, and Powell (1989); Weng and Anderson (1992); Torrie et al. (2002) realizes just that last case. Still it can be easily demonstrated that in this case phase transition is reconstructive one. So the earlier monoclinic version but with larger cell (; ) seems more preferable for the -phase.
Such duplication of unit cell can be only produced by lattice distortions with wave vector in () point of Brillouin-zone of -phase. Moreover, all other observed transformations in methanol at high pressure can be explained in similar way as freezing of vibrational modes in the point. Using available softwareStokes, Hatch, and Campbell (2007); Capillas et al. (2003); Aroyo et al. (2006) one can demonstrate that any of the four 2-dimensional irreducible representations in the -point of space group involves not only the symmetry breaking with the full 2-dimensional order parameter ( in Fig. 4 and Table 1) but also has two more symmetrical directions (isotropical) in the order parameter space. The identification of methanol phases and unit cell transformations brought about by irreducible representation of space group is shown in Table 1.
| Phase(Refs.) | S.G./Z/(Å3) | Unit cell(Å, o) | S.G./Z() | Transformation |
| Tauer and Lipscomb (1952); Torrie, Weng, and Powell (1989); Torrie et al. (2002) | ||||
| Tauer and Lipscomb (1952); Krishna Murti (1959) | (4.59) | |||
| (4.68) | ||||
| (4.92) | ||||
| (97.5) | ||||
| Torrie, Weng, and Powell (1989); Torrie et al. (2002) | ||||
| Allan et al. (1998) | ||||
| 88.10 | ||||
| 93.85 | ||||
| 102.2 | ||||
This consideration is somewhat oversimplified and does not take into account possible coupling of - and -point order parameters which would lead to even higher symmetry breaking in -phase down to space group observed earlier in -phase Allan et al. (1998). However the center of inversion is retained in transitions (or ) and it can be shown Tolédano and Tolédano (1980); Stokes, Hatch, and Campbell (2007) that these transformations are improper ferroelastic ones. Though in general the spontaneous elastic strain in improper ferroelastic transitions is not large, it can be observed in samples subjected to external mechanical fields, for example sound waves. In methanol, for example, the volume effect in transition at pressures GPa is small and the volume variation in the transition from liquid to -phase is quite smooth Gromnitskaya et al. (2004). However the transition as measured by ultrasound methods produces quite large variation in sound velocity values, so it may be an evidence of ferroelastic nature of this phase transition.
Moreover the relation between ferroelastic transitions and amorphization at high non-hydrostatic pressure was considered before Tolédano and Machon (2005); Braginskii (1990); Brazhkin et al. (2003) and this may be the rationale behind formation of the glassy state in methanol at the pressures 4.3, 4.6 GPa. Roughly speaking the process responsible for amorphization of methanol may result from the hindering of nucleus growth because of elastic strain between domains of different ferroelastic phases (,,) in the vicinity of phase boundaries between them. The same consideration is applicable to the methanol glass obtained by fast compression at room temperature Brugmans and Vos (1995). The route of this process also lays in the vicinity (but at higher temperatures) of this region. So it probably involves quenching of liquid methanol into -phase, which is likely to be present at room temperature at higher pressures ( GPa) as suggested by the phase diagram (Fig. 4).
The straightforward test of the structural model of phase transformations in methanol is determining the density of -phase. Experimental value Allan et al. (1998) was based on the density value measured in liquid methanol Brown et al. (1988), which is likely to yield underestimated value of solid methanol density. In the present treatment the primitive unit cell with comparable volume should contain methanol molecules, so it should be at least 25 % denser. But the resolution of this contradiction requires a more thorough examination of methanol solid phases structures at ambient and high pressures in wide temperature range.
VI Conclusions
Dielectric spectroscopy measurements in methanol in the pressure range up to GPa demonstrate the existence of two high-pressure phases of methanol. The room-temperature one obviously corresponds to the known -phase Allan et al. (1998), and the lower-temperature one is a previously unknown phase (tentatively called -phase). In the intermediate pressure region GPa we observed vitrification of methanol and evaluated phenomenological parameters describing its temperature evolution. We suggest a simple structural model describing phase transformations in methanol as condensation of vibrational modes in -point of the Brillouin zone of disordered -phase. Possible relation of this model with vitrification of methanol at high pressure was considered too.
Acknowledgements.
This work was supported by the RFBR grants #13-02-00542 and #13-02-01207. The authors are grateful for A.V. Rudnev and A.V. Gulutin for technical assistance in accomplishing of experiments.References
- Gromnitskaya et al. (2004) E. Gromnitskaya, O. Stal’gorova, O. Yagafarov, V. Brazhkin, A. Lyapin, and S. Popova, JETP Letters 80, 597 (2004).
- Allan et al. (1998) D. R. Allan, S. J. Clark, M. J. P. Brugmans, G. J. Ackland, and W. L. Vos, Phys. Rev. B 58, R11809 (1998).
- Mammone, Sharma, and Nicol (1980) J. F. Mammone, S. K. Sharma, and M. Nicol, The Journal of Physical Chemistry 84, 3130 (1980).
- Eaton, Yuan, and Anderson (1997) R. A. Eaton, Y. N. Yuan, and A. Anderson, Chemical Physics Letters 269, 309 (1997).
- Bridgman (1942) P. W. Bridgman, Proceedings of the American Academy of Arts and Sciences 74, 399 (1942).
- Staveley and Hogg (1954) L. A. K. Staveley and M. A. P. Hogg, J. Chem. Soc. , 1013 (1954).
- Carlson and Edgar F. Westrum (1971) H. G. Carlson and J. Edgar F. Westrum, The Journal of Chemical Physics 54, 1464 (1971).
- Würflinger and Landau (1977) A. Würflinger and R. Landau, Journal of Physics and Chemistry of Solids 38, 811 (1977).
- Grocholski and Jeanloz (2005) B. Grocholski and R. Jeanloz, The Journal of Chemical Physics 123, 204503 (2005).
- Cook, Herbst, and King (1993) R. L. Cook, C. A. Herbst, and H. E. King, The Journal of Physical Chemistry 97, 2355 (1993).
- Gonzalez Salgado and Vega (2010) D. Gonzalez Salgado and C. Vega, The Journal of Chemical Physics 132, 094505 (2010).
- Anderson et al. (1988) A. Anderson, B. Andrews, E. M. Meiering, and B. H. Torrie, Journal of Raman Spectroscopy 19, 85 (1988).
- Piermarini, Block, and Barnett (1973) G. Piermarini, S. Block, and J. Barnett, Journal of Applied Physics 44, 5377 (1973).
- Brugmans and Vos (1995) M. Brugmans and W. Vos, The Journal of Chemical Physics 103, 2661 (1995).
- Zaug, Slutsky, and Brown (1994) J. M. Zaug, L. J. Slutsky, and J. M. Brown, The Journal of Physical Chemistry 98, 6008 (1994).
- Loveday et al. (2000) J. S. Loveday, R. J. Nelmes, S. Klotz, J. M. Besson, and G. Hamel, Phys. Rev. Lett. 85, 1024 (2000).
- Loveday et al. (2001) J. S. Loveday, R. J. Nelmes, M. Guthrie, S. A. Belmonte, D. R. Allan, D. D. Klug, J. S. Tse, and Y. P. Handa, Nature 410, 661 (2001).
- Denney and Cole (1955) D. J. Denney and R. H. Cole, The Journal of Chemical Physics 23, 1767 (1955).
- Davidson (1957) D. W. Davidson, Canadian Journal of Chemistry 35, 458 (1957).
- Ledwig and Würflinger (1982) R. Ledwig and A. Würflinger, Zeitschrift für Physikalische Chemie 132, 21 (1982).
- Barthel et al. (1990) J. Barthel, K. Bachhuber, R. Buchner, and H. Hetzenauer, Chemical Physics Letters 165, 369 (1990).
- Pronin et al. (2010a) A. A. Pronin, M. V. Kondrin, A. G. Lyapin, V. V. Brazhkin, A. A. Volkov, P. Lunkenheimer, and A. Loidl, Phys. Rev. E 81, 041503 (2010a).
- Pronin et al. (2010b) A. A. Pronin, M. V. Kondrin, A. G. Lyapin, V. V. Brazhkin, A. A. Volkov, P. Lunkenheimer, and A. Loidl, JETP Letters 92, 479 (2010b).
- Kondrin et al. (2012) M. V. Kondrin, E. L. Gromnitskaya, A. A. Pronin, A. G. Lyapin, V. V. Brazhkin, and A. A. Volkov, The Journal of Chemical Physics 137, 084502 (2012).
- Khvostantsev, Slesarev, and Brazhkin (2004) L. G. Khvostantsev, V. N. Slesarev, and V. V. Brazhkin, High Pressure Research: An International Journal 24, 371 (2004).
- qua (1997) 7600 Precision LCR Meter Model B Instruction Manual (1997).
- Benkhof et al. (1998) S. Benkhof, A. Kudlik, T. Blochowicz, and E. Rössler, Journal of Physics: Condensed Matter 10, 8155 (1998).
- Martínez-García et al. (2011) J. Martínez-García, J. Tamarit, S. Rzoska, A. Drozd-Rzoska, L. Pardo, and M. Barrio, Journal of Non-Crystalline Solids 357, 329 (2011).
- Tauer and Lipscomb (1952) K. J. Tauer and W. N. Lipscomb, Acta Crystallographica 5, 606 (1952).
- Torrie, Weng, and Powell (1989) B. Torrie, S.-X. Weng, and B. Powell, Molecular Physics 67, 575 (1989).
- Torrie et al. (2002) B. Torrie, O. Binbrek, M. Strauss, and I. Swainson, Journal of Solid State Chemistry 166, 415 (2002).
- Davidson and Cole (1951) D. W. Davidson and R. H. Cole, The Journal of Chemical Physics 19, 1484 (1951).
- Angell et al. (2000) C. A. Angell, K. L. Ngai, G. B. McKenna, P. F. McMillan, and S. W. Martin, Journal of Applied Physics 88, 3113 (2000).
- Bermejo et al. (1990) F. Bermejo, D. Martín-Marero, J. Martínez, F. Batallán, M. García-Hernández, and F. Mompeán, Physics Letters A 150, 201 (1990).
- Sun et al. (2011) M. Sun, L.-M. Wang, Y. Tian, R. Liu, K. L. Ngai, and C. Tan, The Journal of Physical Chemistry B 115, 8242 (2011).
- Loubeyre et al. (2013) L. Loubeyre, M. Ahart, S. A. Gramsch, and R. J. Hemley, The Journal of Chemical Physics 138, 174507 (2013).
- Schröter and Donth (2002) K. Schröter and E. Donth, Journal of Non-Crystalline Solids 307-310, 270 (2002).
- Stickel, Fischer, and Richert (1996) F. Stickel, E. W. Fischer, and R. Richert, The Journal of Chemical Physics 104, 2043 (1996).
- Lunkenheimer et al. (2010) P. Lunkenheimer, S. Kastner, M. Köhler, and A. Loidl, Phys. Rev. E 81, 051504 (2010).
- Krishna Murti (1959) G. S. R. Krishna Murti, Indian Journal of Physics 33, 458 (1959).
- Izyumov and Syromyatnikov (1990) Y. Izyumov and V. Syromyatnikov, Phase transitions and crystal symmetry (Kluwer, Dordrecht, 1990).
- Tolédano and Tolédano (1990) J.-C. Tolédano and P. Tolédano, The Landau theory of phase transitions (World Scientific, Singapore, 1990).
- Tolédano and Dmitriev (1996) P. Tolédano and V. Dmitriev, Reconstructive phase transitions in crystals and quasicrystals (World Scientific, Singapore, 1996).
- Falk and Whalley (1961) M. Falk and E. Whalley, The Journal of Chemical Physics 34, 1554 (1961).
- Wong and Whalley (1971) P. T. T. Wong and E. Whalley, The Journal of Chemical Physics 55, 1830 (1971).
- Dempster and Zerbi (1971) A. B. Dempster and G. Zerbi, The Journal of Chemical Physics 54, 3600 (1971).
- Durig et al. (1971) J. R. Durig, C. B. Pate, Y. S. Li, and D. J. Antion, The Journal of Chemical Physics 54, 4863 (1971).
- Franck and Deul (1978) E. U. Franck and R. Deul, Faraday Discuss. Chem. Soc. 66, 191 (1978).
- Garg and Davidson (1973) S. K. Garg and D. W. Davidson, The Journal of Chemical Physics 58, 1898 (1973).
- Weng and Anderson (1992) S. X. Weng and A. Anderson, physica status solidi (b) 172, 545 (1992).
- Stokes, Hatch, and Campbell (2007) H. T. Stokes, D. M. Hatch, and B. J. Campbell, “ISOTROPY: http://stokes.byu.edu/iso/isotropy.html ” (2007).
- Capillas et al. (2003) C. Capillas, E. Kroumova, M. I. Aroyo, J. M. Perez-Mato, H. T. Stokes, and D. M. Hatch, Journal of Applied Crystallography 36, 953 (2003).
- Aroyo et al. (2006) M. I. Aroyo, J. M. Perez-Mato, C. Capillas, E. Kroumova, S. Ivantchev, G. Madariaga, A. Kirov, and H. Wondratschek, Zeitschrift für Kristallographie 221, 15 (2006).
- Tolédano and Tolédano (1980) J.-C. Tolédano and P. Tolédano, Phys. Rev. B 21, 1139 (1980).
- Tolédano and Machon (2005) P. Tolédano and D. Machon, Phys. Rev. B 71, 024210 (2005).
- Braginskii (1990) A. Y. Braginskii, Sov. Phys. Solid State 32, 10 (1990).
- Brazhkin et al. (2003) V. V. Brazhkin, A. G. Lyapin, R. N. Voloshin, S. V. Popova, E. V. Tat’yanin, N. F. Borovikov, S. C. Bayliss, and A. V. Sapelkin, Phys. Rev. Lett. 90, 145503 (2003).
- Brown et al. (1988) J. M. Brown, L. J. Slutsky, K. A. Nelson, and L. T. Cheng, Science 241, 65 (1988).