Thermal emission in the early X-ray afterglows of GRBs: following the prompt phase to late times
Abstract
Thermal radiation, peaking in soft X-rays, has now been detected in a handful of GRB afterglows and has to date been interpreted as shock break-out of the GRB’s progenitor star. We present a search for thermal emission in the early X-ray afterglows of a sample of Swift bursts selected by their brightness in X-rays at early times. We identify a clear thermal component in eight GRBs and track the evolution. We show that at least some of the emission must come from highly relativistic material since two show an apparent super-luminal expansion of the thermal component. Furthermore we determine very large luminosities and high temperatures for many of the components—too high to originate in a SN shock break-out. Instead we suggest that the component may be modelled as late photospheric emission from the jet, linking it to the apparently thermal component observed in the prompt emission of some GRBs at gamma-ray and hard X-ray energies. By comparing the parameters from the prompt emission and the early afterglow emission we find that the results are compatible with the interpretation that we are observing the prompt quasi-thermal emission component in soft X-rays at a later point in its evolution.
Subject headings:
Gamma-rays bursts: General — radiation mechanisms: thermal1. Introduction
Gamma-ray bursts (GRBs) are extremely bright transient sources, completely dominating the gamma-ray sky for milliseconds to half an hour. The nature of these bursts was long unknown, but since discovering an association with type Ic supernovae (SNe) (e.g. Galama et al. 1998; Hjorth et al. 2003; Stanek et al. 2003), long GRBs (any burst lasting longer than two seconds) are known to be caused by the core-collapse of massive stars. While the afterglows have provided a lot of information over the past 15 years, there is still a lot of uncertainty associated with the prompt high energy radiation. Recent evidence has been found in some GRBs for an apparently thermal component in the early soft X-ray emission (Campana et al., 2006; Starling et al., 2011; Page et al., 2011). This component is often, though not exclusively (e.g. Ghisellini et al., 2007a), interpreted as originating from the SN shock-breakout, as associated SNe have been detected spectroscopically for GRB 060218/SN2006aj (Campana et al., 2006; Pian et al., 2006) and GRB 100316D/SN2010bh (Starling et al., 2011; Wiersema et al., 2010; Chornock et al., 2010; Bufano et al., 2011), and photometrically for GRB 090618 (Page et al., 2011; Cano et al., 2011).
Interestingly, a weak second component was found to be required statistically in the combined late prompt/early afterglow spectra of a few very soft GRBs (Moretti et al., 2008), suggesting either the emergence of the afterglow or a thermal component. The clear evidence for individual X-ray thermal components has so far only been detected in low redshift bursts with SNe. Sparre & Starling (2012) searched for this thermal emission in the total sample of Swift bursts, but removed all bursts with high redshift, as they argue that the thermal emission detected in these are at high risk of being false positives. We have analysed a sample of bright early X-ray afterglows for the presence of thermal-type emission as well, but without the redshift filter, as we see no reason to rule these out beforehand. We find several new apparent thermal components, including bursts with redshifts . In section 2 we present the sample and the analysis of the Burst Alert Telescope (BAT) and the X-Ray Telescope (XRT) data. In section 3 the results of our time-resolved spectroscopy is presented for the best fit time series of each burst. In section 4 we examine the implications of the physical parameters deduced from modeling the emission component.
A flat universe cosmology is assumed with km s-1 Mpc-1 and . 1 errors for each parameter have been used. When only upper limits are given, these are 3 .
2. Observational data and methods
The sample presented in this paper consists of the brightest bursts (as of 2011 December 20) in the Swift online catalogue (Evans et al., 2007). We have selected bursts with at least 20 000 counts in the XRT Window Timing (WT) data as well as reliable spectroscopic redshifts, to ensure good fit statistics and to be able to study the evolution in time and the rest-frame properties of the afterglows. Twenty nine bursts fit these criteria, but the dataset for GRB 100906A had to be discarded as repeated extractions of the spectra failed to produce reliable results, so the final sample size is twenty eight bursts (see Table 1).
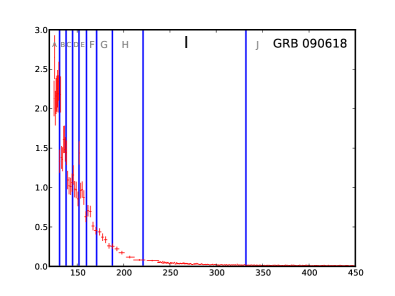
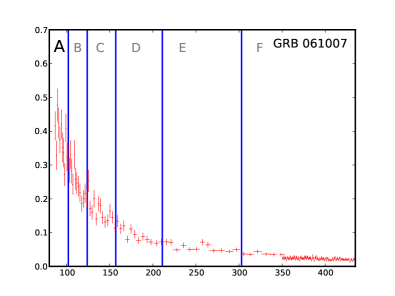
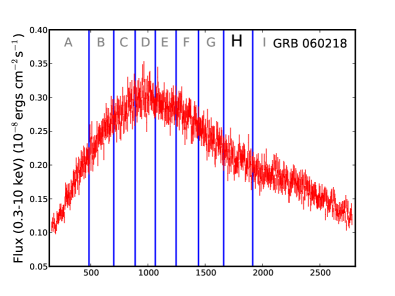
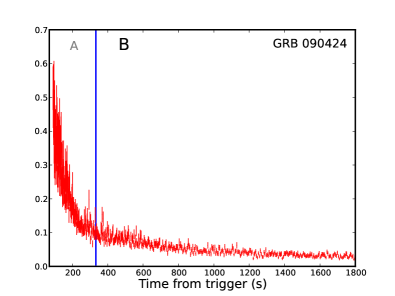
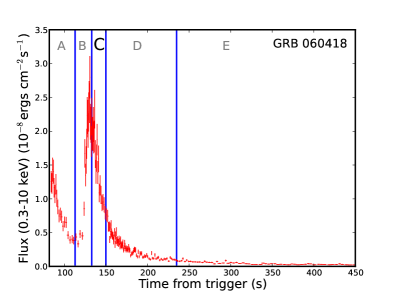
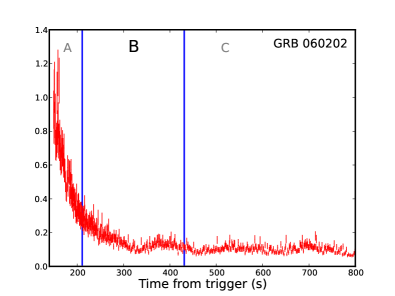
In this paper, we have processed data from Swift BAT and XRT using the analysis tools within HEASOFT. BAT data have been included when available and the spectrum extracted using standard procedure, binning the data in the standard energy binning. The WT mode data have been used from the XRT observations. This has been divided into time periods with a minimum of 10 000 counts for each spectrum, except for GRB 060418 where 5 000 counts per spectrum was used. The XRT light-curves for bursts with a detection of a thermal component are presented in Fig. 1 and the time periods delineated. This way between two and nine spectra have been extracted for each burst. For data reduction the FTOOLs Swift-specific sub package ”xrtproducts” has been used. As centre-position the output from running ”xrtcentroid” on the Photon Counting (PC) mode data has been used. The response files are from the Swift repository. The spectra have been pile-up corrected following Romano et al. (2006).
We should note here that this sample of the brightest early-phase Swift-XRT bursts only overlaps with the six candidate bursts with possible blackbody emission of Sparre & Starling (2012) in GRB 100621A as well as GRB 090618 and GRB 060218 which were claimed elsewhere. The rest of their bursts were not bright enough to enter our sample. Of the bursts we claim as possible detections in Table 1, the above-mentioned bursts are detected in common. We also find detections in GRB 060202, 060418, 061007, 061121, and 090424. All of these bursts, except GRB 061007 are noted as initial possible candidates by Sparre & Starling (2012).
3. Results
The extracted spectra were fit in Xspec with a Band model (Band et al., 1993) with photoelectric absorption from both the Milky Way (, fixed) and the GRB host galaxy (variable and at the redshift of the host). This model was compared to a similarly absorbed Band + blackbody model. The Galactic foreground column densities were fixed to values from the Leiden/Argentine/Bonn (LAB) Survey of Galactic H I (Kalberla et al., 2005) throughout the analysis. The equivalent hydrogen column density based on the dust extinction column would be somewhat different, usually slightly lower (Watson, 2011). Using this value would typically increase the column density inferred at the host galaxy redshift (), but would not affect the other fit parameters substantially. All fits have been done in two steps to reduce the computational cost to a manageable level. First the spectra for a given burst were fit simultaneously to determine for the host galaxy. The absorption was then frozen to this value during individual fitting of the spectra. for the host was determined separately for the Band and the Band + blackbody models. The optical spectroscopic redshifts of the GRBs were used to calculate model parameters in the host galaxy rest frame. Fit statistics and parameters of the best-fit blackbody for the time series with the most significant blackbody detection for each burst in the sample can be seen in Table 1. The temperature and the luminosity111The luminosity is given by the blackbody normalisation in the xspec model: Here is the luminosity in units of 1039 ergs/s, and is the proper motion/luminosity distance to the source in units of 10 kpc. were determined from the fits. Using these parameters and the Stefan-Boltzmann eq., the apparent radiative surface area was determined, assuming a simple, non-relativistic blackbody. Under spherical geometry, the radius would then be: , where .
Parameters have only been included if the improvement for the addition of a blackbody is better than = 25.
| GRB | Redshift | refs. | bb lum.a | bb %b | kT/keV | Rphotc | Timed | Time Seriese | ||
| 060202 | 0.783 | (1) | 28.1 | 13 | 211–431 | B | ||||
| 060218 | 0.0331 | (2) | 73.4 | 0.24 | 1661–1914 | H | ||||
| 060418 | 1.489 | (3) | 33.9 | 3.5 | 254 | 150–235 | D | |||
| 061007 | 1.262 | (4) | 36.1 | 10 | 86–102 | A | ||||
| 061121 | 1.314 | (4) | 49.4 | 0.74 | 72–86 | B | ||||
| 090424 | 0.544 | (5) | 49.8 | 27 | 333–5554 | B | ||||
| 090618 | 0.54 | (6) | 46.9 | 17 | 1058 | 138–145 | C | |||
| 100621A | 0.542 | (7) | 36.5 | 23 | 141–40540 | C | ||||
| 060124 | 2.300 | (4) | 11.9 | 25 | 0.25 | — | — | — | 557–635 | B |
| 060510B | 4.9 | (8) | 9.26 | 136 | 38 | — | — | — | 127–252 | A |
| 060526 | 3.221 | (9) | 8.17 | 8.8 | 4.1 | — | — | — | 81.5–282 | A |
| 060614 | 0.125 | (10) | 14.2 | 0.14 | 15 | — | — | — | 97–109 | A |
| 060729 | 0.543 | (4) | 11.6 | 37 | 23 | — | — | — | 130–146 | A |
| 060814 | 1.92 | (11) | 24.0 | 0.25 | 52 | — | — | — | 168–75055 | C |
| 060904B | 0.703 | (4) | 15.5 | 1.8 | 33 | — | — | — | 77–178 | A |
| 071031 | 2.692 | (4) | 19.3 | 70 | 22 | — | — | — | 109–178 | A |
| 080310 | 2.42 | (12) | 14.5 | 8.6 | 3.1 | — | — | — | 215–287 | B |
| 080319B | 0.937 | (13) | 20.1 | 7.6 | 0.05 | — | — | — | 90–120 | B |
| 080607 | 3.036 | (14) | 7.45 | 222 | 18 | — | — | — | 123–144 | B |
| 080928 | 1.692 | (4) | 19.1 | 22 | 8.0 | — | — | — | 210–248 | B |
| 081008 | 1.9685 | (15) | 14.7 | 35810 | 100 | — | — | — | 94–144 | A |
| 081028 | 3.038 | (16) | 8.60 | 3.5 | 14 | — | — | — | 341–61920 | B |
| 090417B | 0.345 | (17) | 2.87 | 0.1 | 1.8 | — | — | — | 702–1497 | B |
| 090516A | 4.109 | (18) | 14.6 | 325 | 46 | — | — | — | 171–136 | A |
| 090715B | 3.0 | (19) | 9.33 | 82 | 7.7 | — | — | — | 219–274 | C |
| 100814A | 1.44 | (20) | 9.17 | 41 | 3.6 | — | — | — | 94–157 | A |
| 110205A | 2.22 | (21) | 12.0 | 76 | 7.1 | — | — | — | 273–325 | D |
| 110801A | 1.858 | (22) | 18.5 | 57 | 13 | — | — | — | 380–424 | C |
a Blackbody luminosity in ergs s-1
b Percent of total luminosity in the thermal component.
c Photospheric radius in cm
d Seconds since BAT trigger
e Part of light curve that contains best fit improvement
References: (1) Butler (2007); (2) Mirabal & Halpern (2006); (3) Prochter et al. (2006); (4) Fynbo et al. (2009); (5) Chornock et al. (2009); (6) Cenko et al. (2009); (7) Milvang-Jensen et al. (2010); (8)Price (2006); (9) Jakobsson et al. (2006); (10) Della Valle et al. (2006); (11) Jakobsson et al. (2012); (12) De Cia et al. (2012); (13) Racusin et al. (2008); (14) Prochaska et al. (2009); (15) D’Avanzo et al. (2008); (16) Berger et al. (2008); (17) Berger & Fox (2009); (18) de Ugarte Postigo et al. (2009); (19) Wiersema et al. (2009); (20) O’Meara et al. (2010); (21) Cenko et al. (2011); (22) Cabrera Lavers et al. (2011)
In Table 1, the values are given for the two models. The actual probabilities as seen in Table 2 are inferred from a Monte Carlo analysis, and gives the likelihood that the added blackbody is just a better fit per random chance. As can be seen from Table 1 the spectral fit seems generally to be improved with the addition of a blackbody. The blackbody model only adds two free parameters, so the fact that (was wrong before, should not have been ) decrease by more than a factor of two in all but one burst indicates that an extra component is needed in addition to the Band function.
To test the statistical significance of the fit improvement, we used a Monte Carlo method, generating 10 000 artificial spectra from the single Band function model. We did this for every burst with a large improvement in (, the 3 limit from the first three time series analysed), since it is extremely unlikely, that a small value will turn out to be significant, and because the Monte Carlo analysis is computationally expensive. The distribution of was found to be the same for different time series in the same burst, but not compatible between different bursts using the Kolmogorov-Smirnoff test. For bursts with no match in in the first 10 000 spectra, a further 10 000 were done to improve statistics. The detection probabilites for an additional blackbody component resulting from these simulations are provided in Table 2 for each time series. We adopt a thermal component detection criterion of less than one in 10 000 over the null hypothesis in at least one of the time series. This corresponds to a detection probability of better than .
Early afterglow thermal emission has already been reported for GRB 060218 (Campana et al., 2006), and extensively analysed (Waxman et al., 2007; Li, 2007; Ghisellini et al., 2007b, a; Sollerman et al., 2006). The detection of thermal emission in GRB 090618 (Page et al., 2011) and GRB 100621A (Sparre & Starling, 2012) has also been reported, though not as extensively, and so we include our analysis of these bursts here for comparison. In addition to these bursts we report the detection of thermal emission in GRBs 060202, 060418, 061007, 061121, and 090424.


3.1. GRB 061007
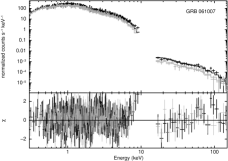
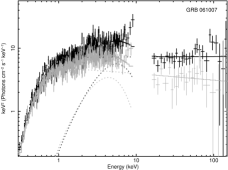
The spectral fitting for GRB 061007 is improved for the added blackbody for time series A to confidence (that is, the Monte Carlo analysis found no match in 20 000 simulated spectra). We also performed 10 000 simulations separately for time series B, where 0.16% (approximately confidence) of the faked data had a as large or larger than the real one. The component is very bright, accounting for respectively 10 and 11% of the total luminosity in series A and B. With luminosities of up to ergs s-1 as well as blackbody temperatures of several keV, this thermal emission is both more luminous and hotter than those previously reported (Campana et al., 2006; Page et al., 2011; Sparre & Starling, 2012). The spectra are plotted in Fig. 2, top panel.
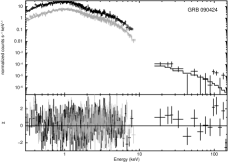
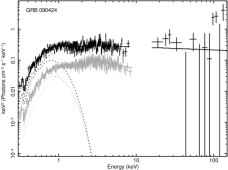
3.2. GRB 090424
The thermal emission from GRB 090424 looks more like the “classical” thermal component, with low luminosity and temperatures of keV, similar to, for instance, GRB 060218. We performed the Monte Carlo analysis for both series separately. For time series B no match was found in 20 000 spectra. For the time series A about 0.2% () match the real value. Compared to the burst’s low total luminosity, the thermal emission is very bright, constituting about one fourth of the total luminosity. The spectra can be seen in Fig. 2, second panel.
3.3. GRB 061121, 060202 and 060418
GRBs 061121, 060202 and 060418 are only good candidates for thermal emission in one time series. Spectra can be seen in Fig. 2. We note that the parameters for GRB 060418 are not very well constrained. All parameters for the detections are similar, with temperatures around 1 keV, luminosities corresponding to few percent of the total, and apparent host-frame blackbody radii around – cm. The general tendency seems to be for the thermal component to be detected in the declining phase after a flare (though for GRB 061121 the time series includes the peak of the flare), see Fig 1.


3.4. Previous detections
Our statistical analysis is relatively conservative as we require a detection. Furthermore, we use a Band model as our underlying continuum, which allows for a certain curvature in the spectra without invoking an additional component. For example for a burst such as GRB 090618 where thermal emission has been claimed previously, we only have a clear detection by our criteria in the very late phase. For our claimed detections, only GRB 061007 is not noted to possibly have a thermal component (i.e. to have a significant deviation from a single power-law) in the analysis of Sparre & Starling (2012). However, this may not be surprising, since we find a highly significant detection only in the first epoch and the signal may be washed out over the rest of the burst. GRBs 060202, 060418, 061121, and 090424 are all flagged as initial possible candidates in Sparre & Starling (2012), but are excluded from their final list for a variety of reasons. We examine these reasons below and discuss why these GRBs have thermal components. GRBs 060202 and 061121 were excluded because the significance of their detections was too sensitively dependent on the column density used in the fits. For our analysis, we do not find that varying our column density, which is based on a simultaneous fit of all the data, has a notable effect on the statistical significance of the detection for these bursts. Within a 90 % c.l varies with a maximum of 3, while the temperature for the blackbody fit remains constant within errors. Furthermore it was noted that GRB 061121 had a high temperature and redshift. We do not include the temperature or redshift attributes of the thermal components in our search criteria. GRB 060418 was excluded by Sparre & Starling (2012) because of strong flaring activity in the light curve. We do not exclude flaring light curves in our analysis a priori since we fit the data with a Band model as the underlying continuum and include the BAT data in our analysis where it is available. Finally, GRB 090424 was found to have a low statistical significance in their time-sliced spectra. Our detection comes from a spectrum over a much wider time range (333–5554 s compared to 700–1000 s) and hence has a far higher signal-to-noise ratio.
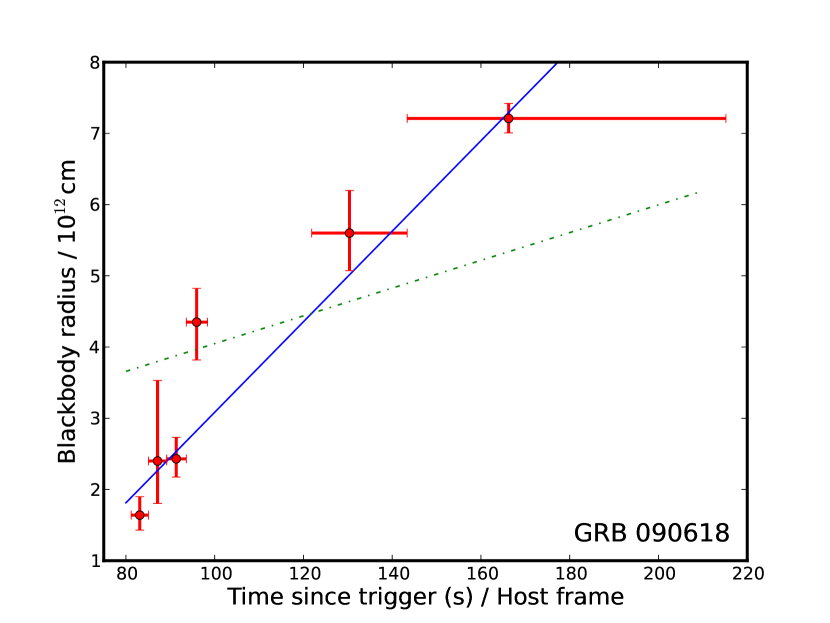
We track the evolution of the temperature and luminosity of GRB 090618 and
find, in the host galaxy rest-frame an apparent expansion with a best-fit
speed of cm s-1 (see Fig. 3). This is times the speed of light. We therefore conclude that the thermal component in
GRB 090618 must be treated relativistically.
| Timea | Nr.b | Band /d.o.f | Probability | |
| GRB 060202 () | ||||
| 171.3 | A | 361.29/329 | 6.7 | 0.12 |
| 295.3 | B | 342.65/268 | 28 | 0.000068 |
| 684.1 | C | 370.49/342 | 6.4 | 0.13 |
| GRB 060418 () | ||||
| 93.00 | A | 174.59/192 | 5.0 | 0.16 |
| 128.5 | B | 245.48/202 | 2.1 | 0.50 |
| 140.2 | C | 216.15/201 | 13 | 0.0078 |
| 171.9 | D | 240.63/211 | 34 | |
| 542.1 | E | 157.76/176 | 6.9 | 0.076 |
| GRB 061007 () | ||||
| 94.22 | A | 340.71/316 | 36 | |
| 113.1 | B | 336.81/308 | 27 | 0.0016 |
| 139.5 | C | 379.37/319 | 11 | 0.10 |
| 181.1 | D | 356.18/317 | 4.0 | 0.56 |
| 251.8 | E | 330.56/316 | 8.1 | 0.21 |
| 372.8 | F | 330.56/315 | 12 | 0.070 |
| 612.8 | G | 387.64/316 | 14 | 0.041 |
| 1286 | H | 312.30/264 | 24 | 0.0033 |
| GRB 061121 () | ||||
| 68.80 | A | 298.45/323 | 2.0 | 0.61 |
| 78.72 | B | 456.34/339 | 49 | |
| 102.6 | C | 257.15/235 | 4.1 | 0.27 |
| 371.3 | D | 228.59/194 | 20 | 0.0003 |
| GRB 090424 () | ||||
| 165.0 | A | 387.76/305 | 21 | 0.0020 |
| 618.1 | B | 380.28/328 | 50 | |
| GRB 090618 () | ||||
| 128.1 | A | 191.41/208 | 11 | 0.034 |
| 134.3 | B | 244.24/226 | 19 | 0.0045 |
| 140.8 | C | 255.60/241 | 27 | 0.00095 |
| 147.8 | D | 254.21/231 | 16 | 0.0074 |
| 155.6 | E | 234.05/214 | 5.7 | 0.21 |
| 165.1 | F | 214.43/208 | 6.6 | 0.16 |
| 178.3 | G | 200.51/185 | 1.3 | 0.83 |
| 200.9 | H | 253.39/233 | 29 | 0.00057 |
| 256.1 | I | 368.69/300 | 47 | |
| GRB 100621A () | ||||
| 88.05 | A | 249.80/311 | 7.6 | 0.041 |
| 117.3 | B | 322.56/286 | 8.8 | 0.028 |
| 173.3 | C | 257.35/212 | 37 | |
a Mean time in seconds after BAT trigger time.
b Time series
4. Origin of the thermal component
4.1. SN shock breakout
It has been suggested that the thermal emission found in previous GRB early afterglows is due to a SN shock break-out from the stellar winds surrounding the progenitor. While this may be a plausible model for low-luminosity systems, it seems implausible that the very large luminosities discovered here could possibly be related to a shock breakout from a SN. Models of SN shock breakouts confirm this (e.g. Li, 2007). Typical values reported are ergs for the break-out energy and a blackbody temperature of keV. This energy is lower than any we observe in the soft X-ray thermal component. Even attempts to explain GRB 060218’s thermal component, (the lowest blackbody luminosity in our sample) with an asymmetric explosion (Waxman et al., 2007) have been shown by Ghisellini et al. (2007a) to require a deal of fine tuning. The fact that we obtain very large luminosities for both GRB 061007 and GRB 061121 (about four orders of magnitude larger than GRB060218), but that the properties of the extra component are not qualitatively dissimilar to previous thermal components found, suggests strongly that not only is a SN shock break-out not the origin in these cases, but it may not be in most other cases where this has been discovered either. Soderberg et al. (2008) reported the case of possible shock breakout in a SN without an accompanying GRB, SN2008D. It has also been suggested that this was photospheric emission from a mildly relativistic jet (Mazzali et al., 2008). The case has been throughly studied, (van der Horst et al., 2011; Gorosabel et al., 2010; Tanaka et al., 2009), but without conclusive results. With a total energy of ergs, this burst is consistent with what could be expected for a break-out, and with the limited photon statistics we cannot distinguish the origin of the emission using the spectra. For the GRBs though, we should look elsewhere for the origin of an apparently thermal component in the late prompt/early afterglow soft X-ray emission.
4.2. Alternative models
While much progress has been made because of the afterglows of GRBs, the origin of, and mechanism behind the prompt phase and early afterglow are still uncertain. Emission from a cocoon surrounding the jet has been proposed (e.g. Suzuki & Shigeyama, 2013), but the model does not seem to explain the energies and expansion velocities reported here.
The models traditionally used to model the high energy spectra, a cut-off power-law or smoothly broken power-law (Band et al., 1993), are empirical and not strongly motivated from a physical understanding of the emission process. The main part of the radiation is often considered to be non-thermal, with high energy photons originating from synchrotron and/or inverse Compton processes in the ultra-relativistic jet (e.g. Tavani, 1996; Cohen et al., 1997; Daigne et al., 2011)). However, based on the detection of components in the prompt gamma-ray emission with a blackbody-like spectral shape in addition to a power law (Ryde, 2005), and on difficulties in reproducing low energy spectral indices with synchrotron models (Crider et al., 1998), a trend has been growing to attribute much of the prompt-phase emission to the photosphere at the head of the ultra-relativistic jet (e.g. Pe’er et al., 2007; Pe’er & Ryde, 2010; Lazzati et al., 2013). Such emission emerges from an optically thick plasma, generally not in thermal equilibrium, producing a quasi-thermal spectrum (Ryde & Pe’er, 2009). Observationally, this high energy photospheric emission decays in luminosity and temperature as a power-law in time (Ryde & Pe’er, 2009). If that trend continues, it is not unreasonable to suppose that it may appear at the end of the prompt phase in soft X-rays as an apparently thermal component with high apparent luminosity and temperature. Under this hypothesis, we can then model the excess component as late photospheric emission.
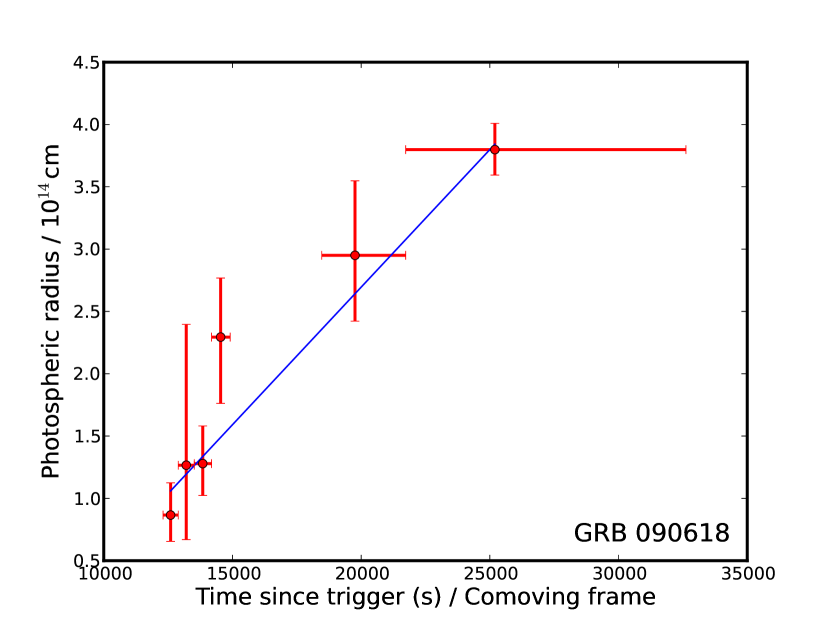
Using eqs. 5 and 7 found in Pe’er et al. (2012) (modified to our parameters), we can calculate the Lorentz factor and the photospheric radius:
Taking the model luminosities found for each time series we get values for the Lorentz factors, as seen in Table 1. These values should be corrected with a factor expressing the ratio of the blackbody and total luminosity that is in the relevant burst epoch, as the equation uses the values over the entire burst, but as the luminosity ratio is to the power of 1/4, the correcting factor will be close to 1. We then use these values to calculate the photospheric radii (also shown in Table 1), where is a geometrical factor close to one (we set = 1 exactly).
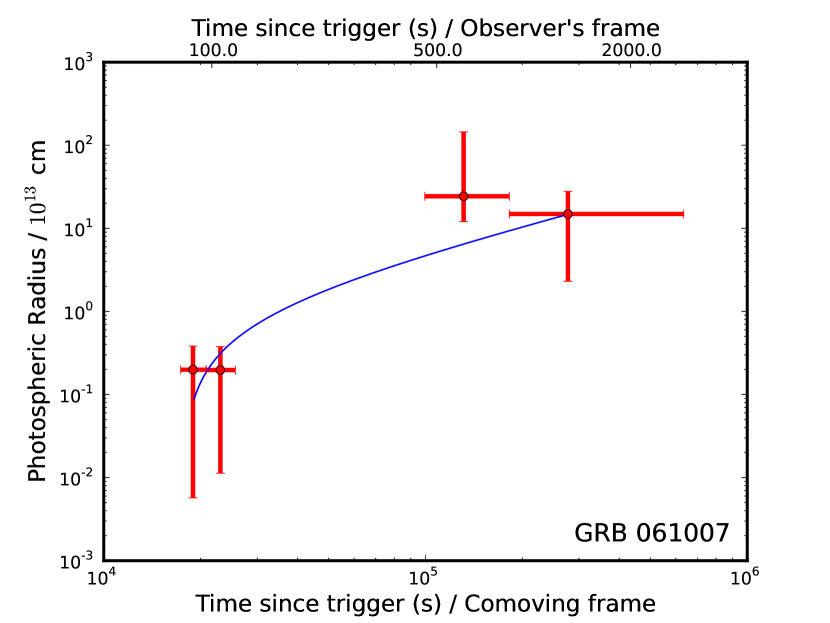
The Lorentz factors calculated here are asymptotic values, valid for the coasting phase of the jet, so they should be similar to the values calculated from the prompt phase emission. As seen in Table 1, the Lorentz factors we get are consistent with the emission being late photospheric, with values between ten and several hundreds. Another consistency check is apparent superluminal motion of the photospheric radii. In order to look for this, we fitted the photospheric expansion assuming this to be constant throughout. We checked all bursts with detections better than 2 in more than one time series, using these for the fit. Fig. 4 shows fits for GRBs 090618 and 061007.
For GRB 090618 we fit an apparent velocity of , which corresponds to in the jet frame using the calculated asymptotic Lorentz factor, consistent with a relativistic expansion close to that Lorentz factor. For GRBs 061007 and 061121 the fitted non-relativistic velocities are and respectively. However, using the asymptotic Lorentz factors in this case yields jetframe velocities only a small fraction of the speed of light. We conclude that for these bursts the jet has started to slow down and expand, so the assumption of a constant Lorentz factor is no longer valid. Our sample then includes all cases, both the jet coasting phase, with velocities near the speed of light, as seen in GRB 090618, the deceleration phase as seen for GRBs 061007 and 061121, and the case where the jet has slowed down completely, seen by the constant radius (photospheric as well as simple blackbody) of GRBs 060418 and 090424.
In principle, the observed evolution of the thermal component in the soft X-ray should be compatible with those observed at early times in the gamma-ray regime. While we have only one GRB in our sample which has a reported prompt phase gamma-ray thermal component, GRB 061007 (see below), as reported by Ryde & Pe’er (2009), the evolution in temperature and luminosity behaves consistently across bursts, with an initial increase in value until a break occurs after a few seconds, and then a decay with a power-law index between and for the luminosity and and for the temperature. Using the points we have from the bursts with good fit over several time series to calculate power-law indices, we get values largely consistent with these for GRB 061007, 090618, 061121, 090424 and 060218; luminosity: , , , , and , and temperature: , and , , and respectively. As far as we are aware there is no theoretical reason why these power-law decay trends necessarily have to continue indefinitely, but the fact that our results for the luminosity and temperature decay rates lie in the range observed from the gamma-ray prompt phase is encouraging for the model.
GRB 061007 is of special interest, since Larsson et al. (2011) find the prompt emission of this burst to be dominated by apparent thermal emission. They find that the evolution in temperature and flux follow the light curve. By the time the XRT started observing, the light curve is in constant decline, so the temperature and flux would be expected to decay, as we find in our analysis of the XRT data. We cannot compare decay indices, as Larsson et al. (2011) observe before the onset of the declining phase. The thermal component started off very strong, accounting for about 75% of the total luminosity. By the time of the XRT observation it has fallen to about 10% for the first two time series, and then becomes too weak to be statistically significant.
A comparison of Lorentz factors is also instructive. Larsson et al. (2011) find values of , which should be directly comparable to the asymptotic Lorentz factors in our sample, for which we obtain similar values, between about 30 and 670 (see table 1), from our observations. For GRB 061007, at XRT observation time, the jet seems to be slowing down, but we still find apparent superluminal expansion of the blackbody radius, which means that the Lorentz factor is still significant. Our proposed model is furthermore supported by observations such as that of Axelsson et al. (2012), who report a detection of prompt phase thermal emission for GRB 110721A, following the blackbody temperature all the way down to 4.9 keV.
With this interpretation, our discovery of highly luminous quasi-thermal components in the soft X-ray emission allows the photospheric prompt emission model to be explored at much later times and with the more sensitive narrow-field soft X-ray instruments, and thus potentially with better statistics and spectral resolution than has so far been the case.
5. Conclusions
We have examined a sample of the brightest Swift GRBs looking for thermal emission in the XRT data. We find clear evidence for this emission in 8 out of 28 bursts, with an indication that such emission exists in the majority of bursts. We track the temperatures and luminosities of these components over time. We find that several of these thermal components are very luminous (three to four orders of magnitude more luminous than the component in GRB 060218) and the temperature is high. These facts therefore make SN shock breakout an unlikely explanation in the generality of GRB thermal components, since the components uncovered here are physically similar to other thermal components discovered so far. We find that several of the components have apparent superluminal expansion, indicating that they are clearly expanding relativistically and use late photospheric emission from the jet as a physically well-motivated theory, to allow us to determine Lorentz factors for the bursts. We find the decay rates of the luminosity and temperatures as well as the Lorentz factors to be compatible with values obtained elsewhere from prompt gamma-ray thermal emission. This explanation links the emission observed in the prompt phase to that of later times and is supported by the detection of superluminal motion and the observation that the trends observed in the gamma-ray thermal emission reported extend to the soft X-ray regime and may mark a crucial step in understanding the prompt/early phase of GRB emission.
References
- Axelsson et al. (2012) Axelsson, M., Baldini, L., Barbiellini, G., et al. 2012, ApJ, 757, L31
- Band et al. (1993) Band, D., Matteson, J., Ford, L., et al. 1993, ApJ, 413, 281
- Berger et al. (2008) Berger, E., Foley, R., Simcoe, R., & Irwin, J. 2008, GRB Coordinates Network, 8434, 1
- Berger & Fox (2009) Berger, E., & Fox, D. B. 2009, GRB Coordinates Network, 9156, 1
- Bufano et al. (2011) Bufano, F., Pian, E., Sollerman, J., et al. 2011, ArXiv e-prints
- Butler (2007) Butler, N. R. 2007, ApJ, 656, 1001
- Cabrera Lavers et al. (2011) Cabrera Lavers, A., de Ugarte Postigo, A., Castro-Tirado, A. J., et al. 2011, GRB Coordinates Network, 12234, 1
- Campana et al. (2006) Campana, S., Mangano, V., Blustin, A. J., et al. 2006, Nature, 442, 1008
- Cano et al. (2011) Cano, Z., Bersier, D., Guidorzi, C., et al. 2011, MNRAS, 413, 669
- Cenko et al. (2011) Cenko, S. B., Hora, J. L., & Bloom, J. S. 2011, GRB Coordinates Network, 11638, 1
- Cenko et al. (2009) Cenko, S. B., Perley, D. A., Junkkarinen, V., et al. 2009, GRB Coordinates Network, 9518, 1
- Chornock et al. (2009) Chornock, R., Perley, D. A., Cenko, S. B., & Bloom, J. S. 2009, GRB Coordinates Network, 9243, 1
- Chornock et al. (2010) Chornock, R., Berger, E., Levesque, E. M., et al. 2010, ArXiv e-prints
- Cohen et al. (1997) Cohen, E., Katz, J. I., Piran, T., et al. 1997, ApJ, 488, 330
- Crider et al. (1998) Crider, A., Liang, E. P., & Preece, R. D. 1998, in American Institute of Physics Conference Series, Vol. 428, Gamma-Ray Bursts, 4th Hunstville Symposium, ed. C. A. Meegan, R. D. Preece, & T. M. Koshut, 359–363
- Daigne et al. (2011) Daigne, F., Bošnjak, Ž., & Dubus, G. 2011, A&A, 526, A110
- D’Avanzo et al. (2008) D’Avanzo, P., D’Elia, V., & Covino, S. 2008, GRB Coordinates Network, 8350, 1
- De Cia et al. (2012) De Cia, A., Ledoux, C., Fox, A. J., et al. 2012, A&A, 545, A64
- de Ugarte Postigo et al. (2009) de Ugarte Postigo, A., Gorosabel, J., Malesani, D., Fynbo, J. P. U., & Levan, A. J. 2009, GRB Coordinates Network, 9383, 1
- Della Valle et al. (2006) Della Valle, M., Chincarini, G., Panagia, N., et al. 2006, Nature, 444, 1050
- Evans et al. (2007) Evans, P. A., Beardmore, A. P., Page, K. L., et al. 2007, A&A, 469, 379
- Fynbo et al. (2009) Fynbo, J. P. U., Jakobsson, P., Prochaska, J. X., et al. 2009, ApJS, 185, 526
- Galama et al. (1998) Galama, T. J., Vreeswijk, P. M., van Paradijs, J., et al. 1998, Nature, 395, 670
- Ghisellini et al. (2007a) Ghisellini, G., Ghirlanda, G., & Tavecchio, F. 2007a, MNRAS, 382, L77
- Ghisellini et al. (2007b) —. 2007b, MNRAS, 375, L36
- Gorosabel et al. (2010) Gorosabel, J., de Ugarte Postigo, A., Castro-Tirado, A. J., et al. 2010, A&A, 522, A14
- Hjorth et al. (2003) Hjorth, J., Sollerman, J., Møller, P., et al. 2003, Nature, 423, 847
- Jakobsson et al. (2006) Jakobsson, P., Fynbo, J. P. U., Ledoux, C., et al. 2006, A&A, 460, L13
- Jakobsson et al. (2012) Jakobsson, P., Hjorth, J., Malesani, D., et al. 2012, ApJ, 752, 62
- Kalberla et al. (2005) Kalberla, P. M. W., Burton, W. B., Hartmann, D., et al. 2005, A&A, 440, 775
- Larsson et al. (2011) Larsson, J., Ryde, F., Lundman, C., et al. 2011, MNRAS, 414, 2642
- Lazzati et al. (2013) Lazzati, D., Morsony, B. J., Margutti, R., & Begelman, M. C. 2013, ArXiv e-prints
- Li (2007) Li, L.-X. 2007, MNRAS, 375, 240
- Mazzali et al. (2008) Mazzali, P. A., Valenti, S., Della Valle, M., et al. 2008, Science, 321, 1185
- Milvang-Jensen et al. (2010) Milvang-Jensen, B., Goldoni, P., Tanvir, N. R., et al. 2010, GRB Coordinates Network, 10876, 1
- Mirabal & Halpern (2006) Mirabal, N., & Halpern, J. P. 2006, GRB Coordinates Network, 4792, 1
- Moretti et al. (2008) Moretti, A., Margutti, R., Pasotti, F., et al. 2008, A&A, 478, 409
- O’Meara et al. (2010) O’Meara, J., Chen, H.-W., & Prochaska, J. X. 2010, GRB Coordinates Network, 11089, 1
- Page et al. (2011) Page, K. L., Starling, R. L. C., Fitzpatrick, G., et al. 2011, MNRAS, 416, 2078
- Pe’er et al. (2007) Pe’er, A., Mészáros, P., & Rees, M. J. 2007, Royal Society of London Philosophical Transactions Series A, 365, 1171
- Pe’er & Ryde (2010) Pe’er, A., & Ryde, F. 2010, ArXiv e-prints
- Pe’er et al. (2012) Pe’er, A., Zhang, B.-B., Ryde, F., et al. 2012, MNRAS, 420, 468
- Pian et al. (2006) Pian, E., Mazzali, P. A., Masetti, N., et al. 2006, Nature, 442, 1011
- Price (2006) Price, P. A. 2006, GRB Coordinates Network, 5104, 1
- Prochaska et al. (2009) Prochaska, J. X., Sheffer, Y., Perley, D. A., et al. 2009, ApJ, 691, L27
- Prochter et al. (2006) Prochter, G. E., Prochaska, J. X., Chen, H.-W., et al. 2006, ApJ, 648, L93
- Racusin et al. (2008) Racusin, J. L., Karpov, S. V., Sokolowski, M., et al. 2008, Nature, 455, 183
- Romano et al. (2006) Romano, P., Campana, S., Chincarini, G., et al. 2006, A&A, 456, 917
- Ryde (2005) Ryde, F. 2005, ApJ, 625, L95
- Ryde & Pe’er (2009) Ryde, F., & Pe’er, A. 2009, ApJ, 702, 1211
- Soderberg et al. (2008) Soderberg, A. M., Berger, E., Page, K. L., et al. 2008, Nature, 453, 469
- Sollerman et al. (2006) Sollerman, J., Jaunsen, A. O., Fynbo, J. P. U., et al. 2006, A&A, 454, 503
- Sparre & Starling (2012) Sparre, M., & Starling, R. L. C. 2012, MNRAS, 427, 2965
- Stanek et al. (2003) Stanek, K. Z., Matheson, T., Garnavich, P. M., et al. 2003, ApJ, 591, L17
- Starling et al. (2011) Starling, R. L. C., Wiersema, K., Levan, A. J., et al. 2011, MNRAS, 411, 2792
- Suzuki & Shigeyama (2013) Suzuki, A., & Shigeyama, T. 2013, ApJ, 764, L12
- Tanaka et al. (2009) Tanaka, M., Yamanaka, M., Maeda, K., et al. 2009, ApJ, 700, 1680
- Tavani (1996) Tavani, M. 1996, ApJ, 466, 768
- van der Horst et al. (2011) van der Horst, A. J., Kamble, A. P., Paragi, Z., et al. 2011, ApJ, 726, 99
- Watson (2011) Watson, D. 2011, A&A, 533, A16
- Waxman et al. (2007) Waxman, E., Mészáros, P., & Campana, S. 2007, ApJ, 667, 351
- Wiersema et al. (2010) Wiersema, K., D’Avanzo, P., Levan, A. J., et al. 2010, GRB Coordinates Network, 10525, 1
- Wiersema et al. (2009) Wiersema, K., Levan, A., Kamble, A., Tanvir, N., & Malesani, D. 2009, GRB Coordinates Network, 9673