Turbulence in the SuperModel:
Mass Reconstruction with Nonthermal Pressure for Abell 1835
Abstract
The total mass derived from X-ray emission is biased low in a large number of clusters when compared with the mass estimated via strong and weak lensing. Suzaku and Chandra observations out to the virial radius report in several relaxed clusters steep temperature gradients that on assuming pure thermal hydrostatic equilibrium imply an unphysically decreasing mass profile. Moreover, the gas mass fraction appears to be inconsistent with the cosmic value measured from the CMB. Such findings can be interpreted as an evidence for an additional nonthermal pressure in the outskirts of these clusters. This nonthermal component may be due to turbulence stirred by residual bulk motions of extragalactic gas infalling into the cluster. Here we present a SuperModel analysis of Abell 1835 observed by Chandra out to the virial radius. The SuperModel formalism can include in the equilibrium a nonthermal component whose level and distribution are derived imposing that the gas mass fraction equals the cosmic value at the virial radius. Including such a nonthermal component, we reconstruct from X rays an increasing mass profile consistent with the hydrostatic equilibrium also in the cluster outskirts and in agreement at the virial boundary with the weak lensing value. The increasing profile confirms that the baryons are not missing but located at the cluster outskirts.
Subject headings:
cosmic background radiation — galaxies: clusters: individual (Abell 1835) — X-rays: galaxies: clusters1. Introduction
Clusters of galaxies formed from the collapse of primordial density fluctuations are powerful cosmological probes mostly relied on the their total virial mass. The traditional method to estimate is based on the IntraCluster Plasma (ICP) density and temperature profiles derived from the X-ray bremsstrahlung emission. These profiles allow to solve the equation of hydrostatic equilibrium (HE) assuming spherical symmetry. The comparison with masses estimated via strong and weak lensing (Arnaud et al. 2007; Mahdavi et al. 2008; Lau et al. 2009; Battaglia et al. 2012) has highlighted that the X-ray mass is biased low by a systematic 10-20 even in relaxed clusters. These differences in the mass values suggest the presence of a nonthermal gas pressure support that could resolve this discrepancy. On the other hand, simulations unanimously show the presence of gas motions driven by inflow of material into the cluster from its environment, by mergers, and by the supersonic movements of galaxies through the ICP. These motions may cause the development of turbulence in the cluster outskirts with a deep impact on the physics of the ICP (Nagai et al. 2007; Shaw et al. 2010; Burns et al. 2010; Vazza et al. 2011; Rasia et al. 2012). Also the gas clumping, that may be important at large radii, can considerably underestimate the total mass (Nagai & Lau 2011; Simionescu et al. 2011; Eckert et al. 2012; Vazza et al. 2013).
An incorrect estimate of the total mass implies an incorrect determination of the baryon fraction in the ICP that contains most of the baryons in clusters. The remaning baryons with a fraction that represent a few percent of the total mass are in stars and intracluster light (Gonzalez et al. 2007; Giodini et al. 2009). The total baryon fraction () and its evolution with the red-shift are used to constrain cosmological parameters since it is believed to be representative of the Universe (e.g., White et al. 1993; Metzler & Evrard 1994; Ettori et al. 2009). Current studies have shown that the cluster baryon fraction derived at is lower than the ratio measured from the CMB by several experiments (Afshordi et al. 2007; Umetsu et al. 2009; Vikhlinin et al. 2006; Arnaud et al. 2007; Sun et al. 2009; Komatsu et al. 2011) raising the question of where the missing baryons are allocated (Rasheed et al. 2010). To address this issue, Landry et al. (2012) have recently used Chandra X-ray observations to measure the gas mass fraction for a complete sample of massive clusters in the red-shift range (0.15- 0.30) from the Brightest Cluster Sample (Ebeling et al. 1998; Dahle 2006). These clusters are observed at the radius within which the mass density is 500 times the critical density of the universe at the cluster’s redshift. They find that the baryon content in these high-luminosity clusters is consistent at with the cosmic ratio implying that there are no missing baryons within this radius in the most luminous and massive clusters. But, in accord with several studies they measure an increase of with radius raising the question of what happens to the gas mass fraction beyond . It can be presumed always higher values of going toward the virial boundary as also reported by recent Suzaku observations (e.g., Simionescu et al. 2011). However, Landry et al. (2012) doubt the validity of this extrapolation considering that the gas could not be in HE beyond , and/or that the clumping of the gas may become always more important toward the virial radius. An underestimate of the total mass may be the cause of the discrepancy between and the ratio at .
One of the clusters in the sample of Landry et al. (2012) is Abell 1835 ( = 0.253) that has been investigated by Bonamente et al. (2013) out to the virial radius thanks to a long exposure and high quality data. Chandra reports soft X-ray surface brightness emission out to a radial distance of 2.4 Mpc, and a very step temperature profile like to that observed by Suzaku in some relaxed clusters (Bautz et al. 2009; Hoshino et al. 2010; Kawarada et al. 2010; Walker et al. 2012). This temperature profile implies a decreasing total mass profile at , a value consistent with the cosmological ratio at , but inconsistent at greater distances. Their conclusion is that the steepening of the temperature profile is incompatible with the HE in the outskirts of the cluster as confirmed by recent Suzaku observations out to the virial radius (Ichikawa et al. 2013). Besides, Bonamente et al. (2013), report that a negative entropy gradient renders the ICP convectively unstable, flattening within a few Gyrs the temperature profile for the transport of central hotter gas in the periphery of the cluster. They suggest the presence of cool gas in the outskirts of the cluster that may be the result of infall from the filamentary structure if this gas lies in projection against the outermost regions.
Here we show how it is possible to reconstruct the total cluster mass using the SuperModel (Cavaliere et al. 2009) that includes a nonthermal pressure component (Cavaliere et al. 2011) due to turbulent motions. This component in addition to the ICP thermal pressure sustains the HE. Turbulence is related to the weakening of the accretion shocks that induces an increase of the bulk inflow energy in the cluster outskirts and also saturation of entropy production determining the observed steep temperature profiles (see Lapi et al. 2010). In particular, we analyze Abell 1835 showing that the inclusion of this nonthermal component gives an increasing total mass also in the cluster outskirts and in agreement with the weak lensing measurements. The level and distribution of this nonthermal pressure support are obtained imposing that the baryon mass fraction is consistent with the cosmic ratio at the virial boundary (see Sect. 3).
Throughout the paper we adopt the standard flat cosmology with parameters km s-1 Mpc-1, , (see Komatsu et al. 2011; Hinshaw et al. 2013, Planck collaboration 2013a). With this 1 arcmin corresponds to 237.48 kpc.
2. Turbulence in the SuperModel
The wealth of current and upcoming data for emission in X-rays and scattering in the waves of the CMB photons for the Sunyaev-Zel,dovich effect requires a precision modelling of the ICP density and temperature distributions. This modeling is provided by the SM based on the run of the ICP specific entropy (adiabat) set by the processes for its production and erosion. AGN outbursts and deep mergers often followed by inner sloshing determine a raise of the entropy at the cluster centers; in addition there the entropy may be partly eroded by cooling processes. At the other end, a large quantity of entropy is continuously produced at the virial boundary where the ICP is shocked by the supersonic gravitational inflow of gas accreted from the environment along with the dark matter (DM), and is adiabatically stratified into the DM potential well. These physical processes concur to create a spherically averaged profile for the ICP entropy , see Voit (2005). A central floor ( 10-100 keV cm2) is followed by an outer ramp with slope 1 (Tozzi & Norman 2001) leading to entropy values some 103 keV cm2 at the virial boundary.
The thermal pressure is used in the SM to balance the DM gravitational pull and sustain the hydrostatic equilibrium out to the virial boundary. From the HE equation we directly derive the temperature profile:
| (1) |
Note that the density follows , so that and are linked, rather than independently rendered with multiparametric expressions as in other approaches. The few physical parameters specifying are enough to provide remarkably good fits to the detailed X-ray data on surface brightness and on temperature profiles of many cool-core CCs and non-cool-core NCCs clusters (see Fusco-Femiano et al. 2009), and to the SZ Planck profile for the Coma cluster (Fusco-Femiano et al. 2013). Good fits have been also obtained for the steep temperature profiles observed by Suzaku out to the virial radius in some relaxed CC clusters that, as suggested by Lapi et al. (2010), can be explained in terms of the entropy profile flattening observed in these clusters. The entropy run starts with an initial slope , but for it deviate downward from a simple powerlaw (see Eq. 4 in Lapi et al. 2010) where is a free parameter. The outer branch of the entropy profile is described by a linear decline of the slope with gradient . This lower entropy production may be explained in terms of decreasing accretion rate due to the slowdown at later cosmic times of the cosmological structure growth in an accelerating Universe. The effect is enhanced by little mass available for accretion in cluster sectors adjacent to low-density regions of the surrounding environment. So, we expect azimuthal variations of the X-ray observables (Lapi et al. 2010).
This scenario seems confirmed by a recent analysis of a sample of relaxed cool-core clusters at redshift below 0.25 (Walker et al. 2012). On the other hand, the clumping effect reported by numerical simulations (Nagai & Lau 2011) is not large enough to account for the observed amount of entropy flattening. Also the proposed difference between the electron and ion temperatures in the ICP inside the accretion shock in the outskirts as a cause of the entropy profile flattening (Hoshino et al. 2010; Akamatsu et al. 2011) seems to be in contrast with Sunyaev-Zeldovich (SZ) effect observations with Planck (Planck collaboration 2013b).
The weakening of the accretion shock in relaxed clusters not only reduces the thermal energy to feed the intracluster entropy, but also increases the amount of bulk energy to drive turbulence into the outskirts (Cavaliere et al. 2011). Turbulent motions start a the virial radius with coherence lenghts /2 set in relaxed CC clusters by the pressure scale height or by shock segmentation (see Iapichino & Niemeyer 2008; Valdarnini 2010; Vazza et al. 2010). Then they fragment downstream into a dispersive cascade to sizes . Larger values of turbulent energy compared to the gas thermal energy are reported by simulations in the innermost cluster regions of post-merger and merging clusters. Here instead we deal with the outskirts of relaxed clusters where the simulations report much lower values in the cluster cores but an increasing profile going toward the virial radius (e.g., Vazza et al. 2011).
Since turbulent motions contribute to the pressure to substain HE, we focus on the ratio of turbulent to thermal pressure with radial shape decaying on the scale from the boundary value . The total pressure is now that when inserted in the HE equation gives the temperature profile in the form
Again, is linked to by . In our numerical computations we adopt the functional shape
| (3) |
which decays on the scale inward of a round maximum. The runs we adopt are consistent with those indicated by numerical simulations (Lau et al. 2009; Vazza et al. 2011). A power law has been instead used to describe the radial distribution of the fraction by Morandi et al. (2012; see also Shaw et al. 2010) in their 3-D structure reconstruction of Abell 1835. They performed a triaxial joint analysis using X-rays, strong lensing (SL) and SZ data available to infer the gas entropy and the nonthermal pressure profiles out to .
3. SuperModel Analysis of Abell 1835
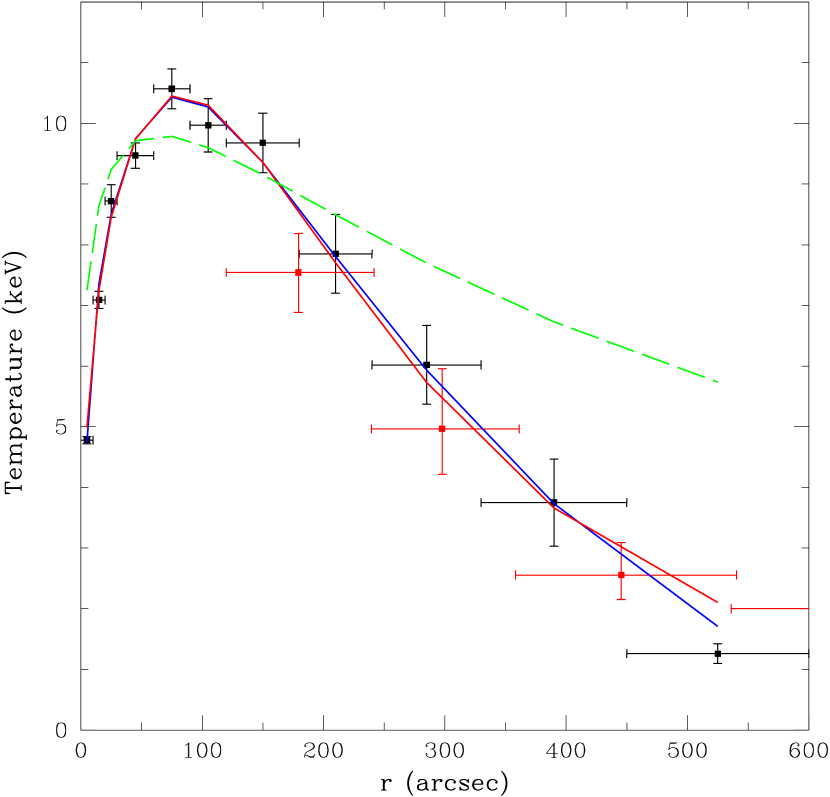
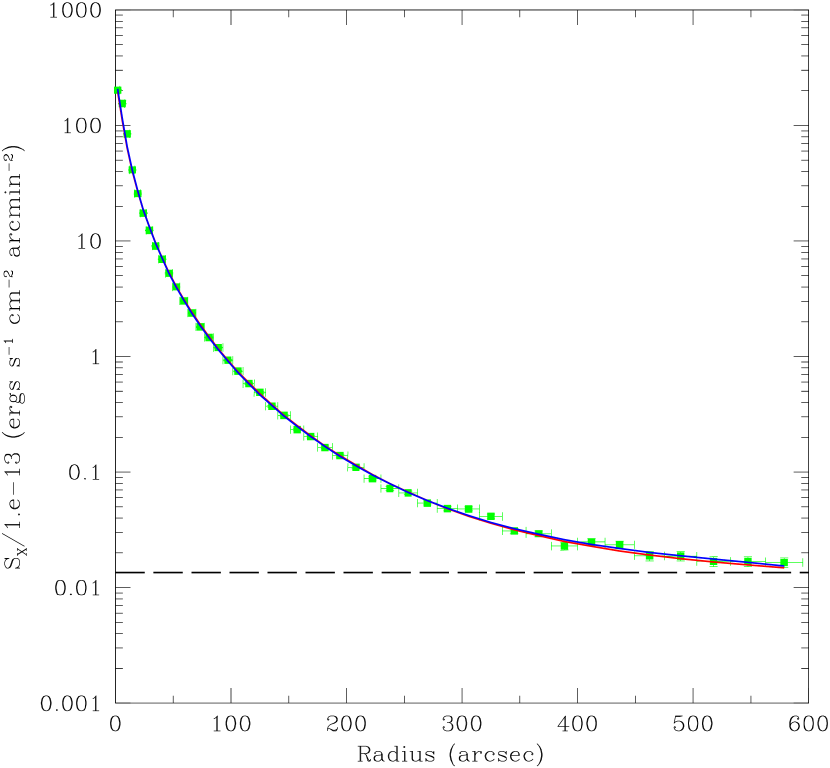
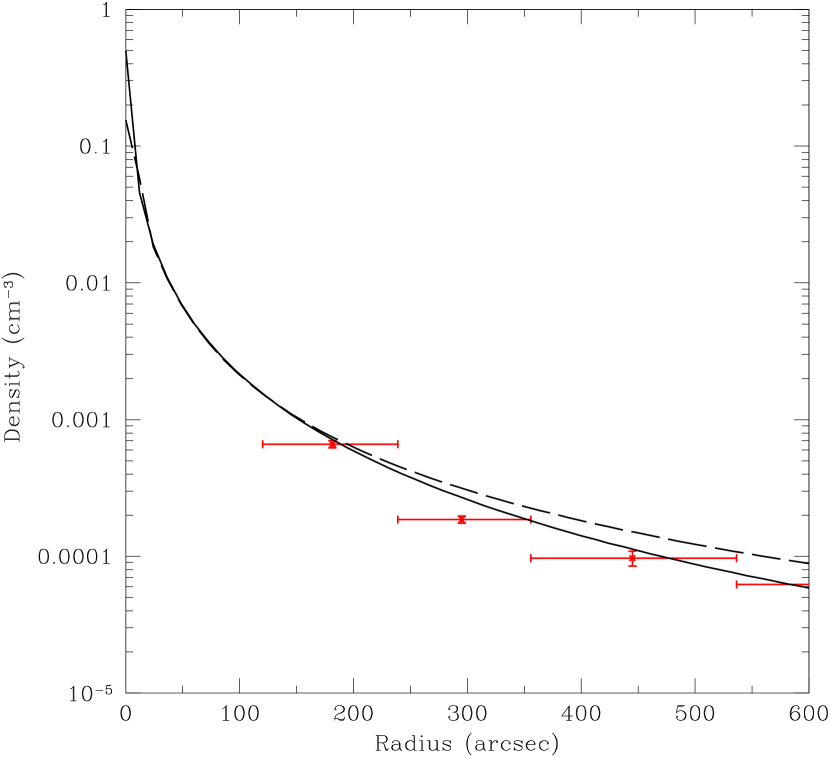
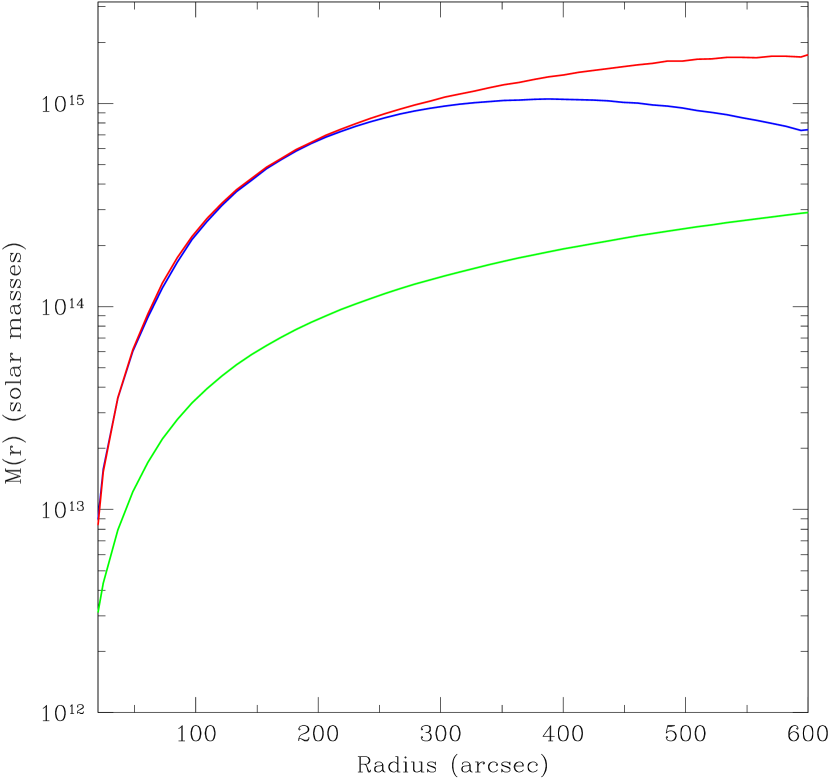
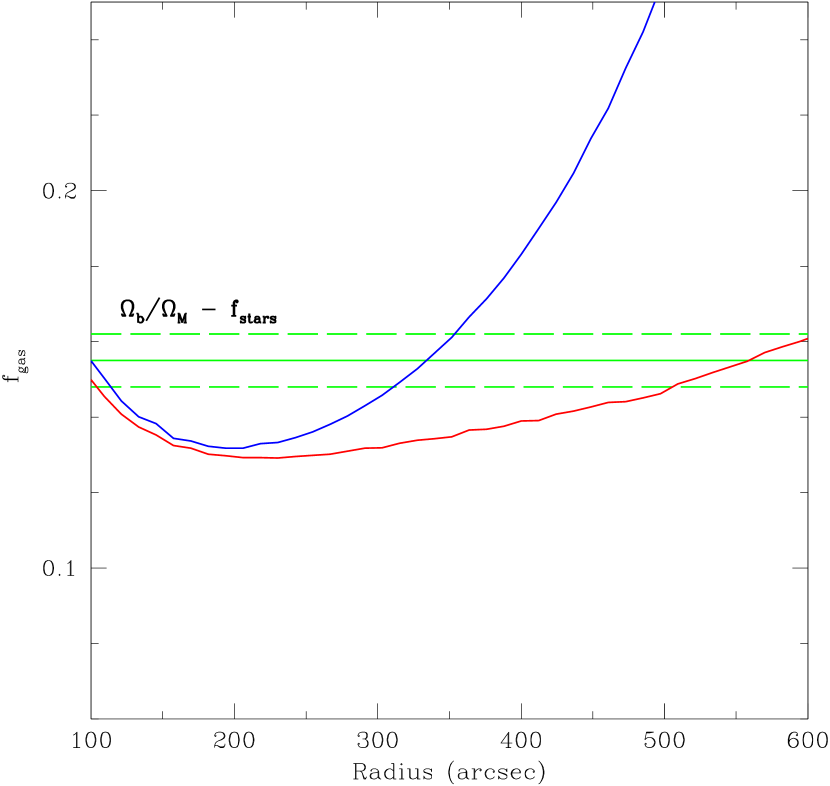
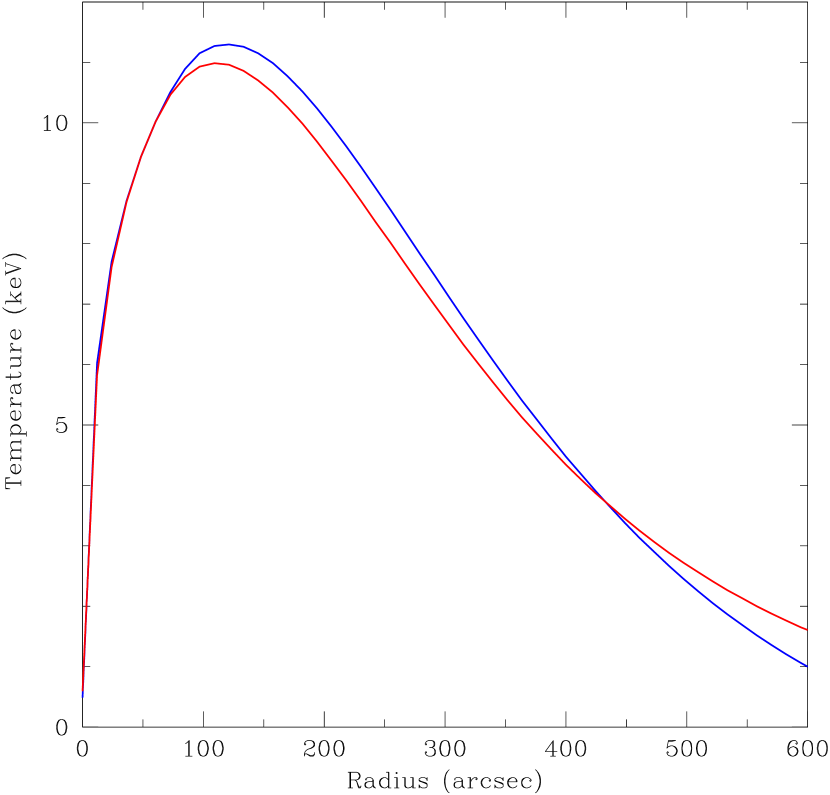
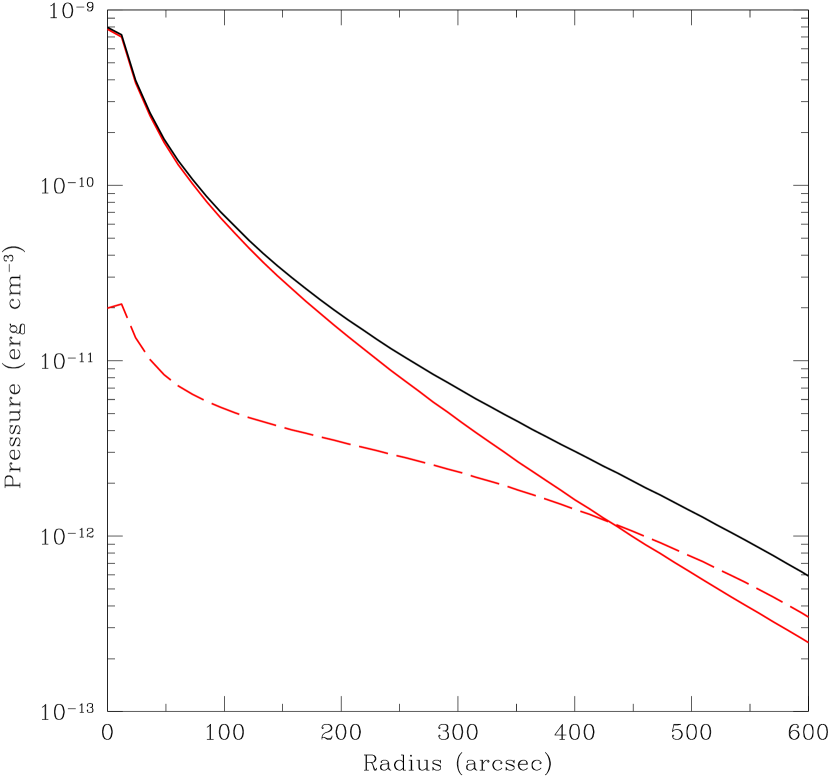
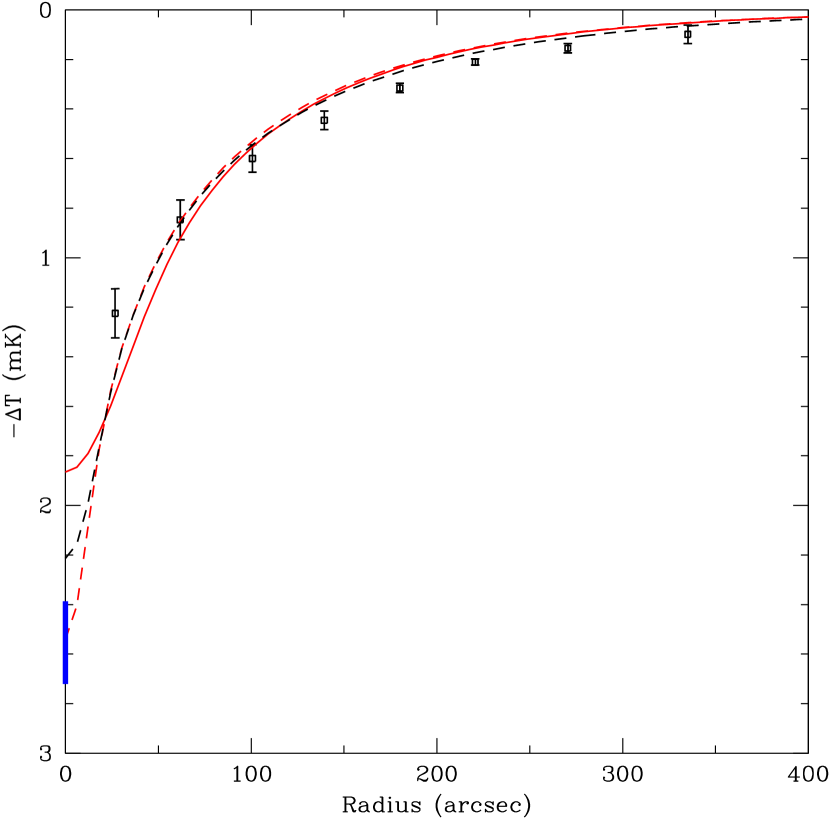
The SM analysis of Abell 1835 observed by Chandra (Schmidt et al. 2001; Bonamente et al. 2013) begins assuming that the total pressure for the HE is given only by the thermal ICP pressure (see Eq. 1). Fig. 1 shows the fit to the projected temperature profile (blue line) assuming a deviation of the entropy from the profile at ; this because a power law increase is inconsistent with the Chandra data (see green line). From the surface brightness distribution (see Fig. 1) we derive the ICP density profile of Fig. 2 slightly different from the deprojected electron density profile obtained by Li et al. (2012) from Chandra observations and in agreement with the profile derived at by the Suzaku observations (Ichikawa et al. 2013). As shown in Fig. 5 the gas density profile gives a central SZ effect value absolutely consistent with the observations (Reese et al. 2002), at variance with the gas density profile derived by Li et al. (2012). Moreover, our SZ effect profile reproduces fairly well the profile observed by Bolocam at (Sayers et al. 2011). The central gas density is 0.49 0.03 cm-3 while at the virial boundary ( = 2.4 Mpc or 606.4 arcsec) is (5.73 0.37) 10-5 cm-3. This last value is about a factor 2 greater than the gas density reported by Morandi et al. (2012) at the virial radius. In accord with Bonamente et al. (2013), who have analyzed the Chandra data with the fitting formulae of Vikhlinin et al. (2006), the steep temperature profile causes a decreasing total matter at 400′′ and a consequent gas mass fraction consistent with the cosmic value at ( 327′′), but absolutely inconsistent at larger radii (see Fig. 3). This profile provides evidence that beyond the HE is not supported only by thermal pressure, as suggested by several theoretical studies (e.g., Lau et al. 2009).
In Sect. 2 we have shown that the SM formalism has the ability to straightforwardly include in the equilibrium a nonthermal pressure to yield the total pressure where the pressure can be physically characterized in terms of a normalization provided by the infall kinetic energy seeping through the virial shocks to drive turbulence, and of a dissipative decay scale (see Eqs. 2 and 3). The inclusion of a nonthermal component leads to an increasing total mass also in the more peripheral regions of Abell 1835 (see Fig. 3, red line). We determine the quantities and (see Eq. 3) imposing that the baryon mass fraction equals the cosmic value at the virial radius (red line in Fig. 3), and that the mass profile is smooth in the outskirts. These values yield the pressure profiles , and shown in Fig. 5 ( = 1.4, = 0.5). The thermal pressure is about 40 of the total pressure at the virial radius helped by turbulent motions in sustaining the equilibrium, while it predominates at the center. The nonthermal pressure starts to become significant at where our analysis with , in accord with Bonamente et al. (2013), reports a decreasing mass profile.
In presence of a nonthermal pressure the traditional equation to estimate the total mass within is modified as
where is the Boltzmann constant, is the mean molecular weight, is the proton mass, is the gravitational constant. The mass of the hot gas is
| (5) |
where is the mean molecular weight of the electrons.
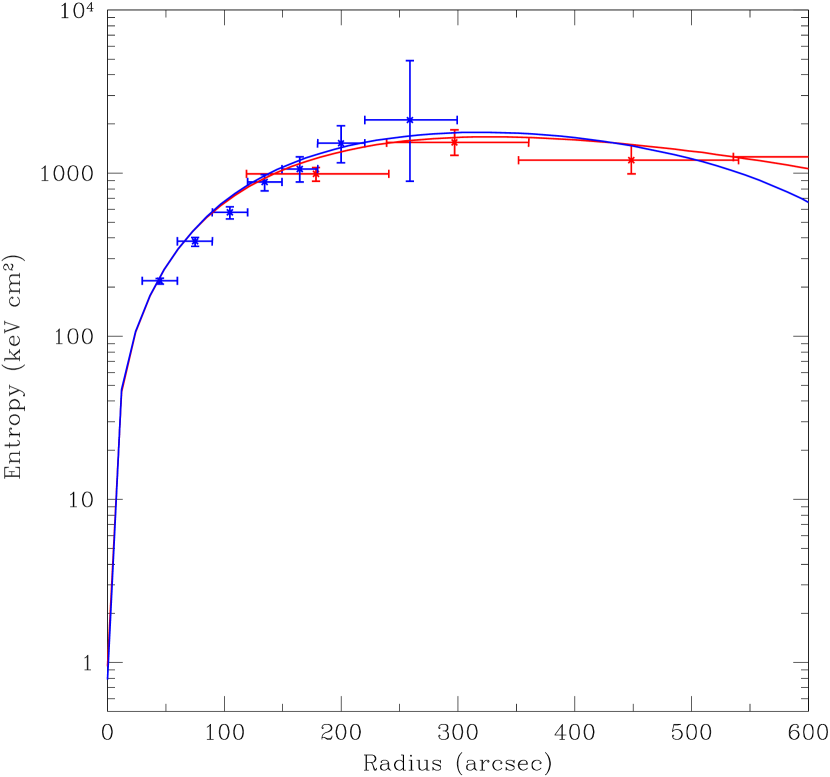
The fit to the Chandra projected temperature profile with the the ratio is only slightly different from the fit with only the thermal pressure to sustain the HE. This difference is completely negligible in the fit to the brightness profile due to its weak dependence on the temperature (see Fig. 1). From these fits we extract values (with their 1- uncertainty) of the parameters keV cm2, , and keV cm2 specifying the entropy pattern for ; for the entropy decline starts at ( kpc), with a gradient . Fig. 4 shows the 3-D temperature and entropy profiles of the ICP when a nonthermal pressure component is included in the HE equation. Our entropy profile for is consistent with the observed entropy values derived by XMM-Newton (Zhang et al. 2007) and Suzaku (Ichikawa et al. 2013) observations. Our value of between (260-640) kpc derived by Chandra observations is consistent with the radius in the interval (470-950) kpc where the Suzaku entropy profile starts to decline downward (see Fig. 7 in Ichikawa et al. 2013). We note also that the SM entropy profile (red line) is sufficiently flat to satisfy the Schwarzschild criterion discussed by Bonamente et al. (2013) for the convective instability. Moreover, an increasing entropy profile that deviates from a power law is within the uncertainty of the slope .
4. Discussion and Conclusions
Only recently the use of the Suzaku observations and of the SZ effect profiles have allowed to obtain some first insights on the thermodynamic properties of the cluster outskirts. This avoids resorting to extrapolations of the information available at to estimate the ICP and total masses going toward the virial boundary. The Suzaku and Chandra observations of several relaxed clusters have highlighted steep temperature profiles and entropy profiles that deviate from the expected power law increase (e.g., Walker et al. 2012). However, a recent combined analysis of SZ and X-ray data seems not to indicate the entropy flattening in relaxed clusters (Eckert et al. 2013). As already reported in Lapi et al. (2010) for a number of clusters, here we confirm for Abell 1835 that the observed steep temperature profile measured with Chandra can be fitted by our SM only imposing a deviation of the entropy profile from a power law increase at . Also the recent Suzaku observations (Ichikawa et al. 2013) report an entropy flattening; a similar behaviour is found in the combined X-rays, SL and SZ data analysis of Morandi et al. (2012). We highlight that the goodness of our gas density and temperature profiles obtained by the SM fits to the Chandra X-ray observables is widely tested. The derived entropy profile is in agreement with the entropy values reported by XMM-Newton and Suzaku results (see Fig. 4), and the SZ effect profile is consistent with the observations (see Fig. 5).
In the Perseus cluster, observed by Suzaku in the outskirts, the gas mass fraction exceeds at the virial boundary the cosmic baryon value measured by the CMB (Simionescu et al. 2011). The authors suggest that the most plausible explanation for this apparent baryon excess toward the cluster periphery is gas clumping. According to this interpretation the electron density is overestimated affecting gas mass fraction, entropy, and pressure profiles. The observed electron density must reach a value of up to 4 of the true density at the virial radius to have consistent with the cosmic value. However, as reported by Walker et al. (2012) the gas clumping derived by Nagai & Lau (2011) appears insufficient to match observations and is expected to be most significant at while the observed entropy profiles start to flatten around 0.5 (see also Ichikawa et al. 2013). However, a recent paper by Walker et al. (2013) attributes to the gas clumping the major responsibility of the entropy flattening observed in several clusters. But, for Abell 1835 the observed density needs to be overestimated by a large factor 7 to make the entropy profile agree with a power law increase in the outskirts. Besides, the too low measured temperatures compared to predictions seem to be responsible for the entropy flattening in this cluster.
The observed sharp drops in temperature imply decreasing mass profiles in the outskirts of some relaxed galaxy clusters (e.g., Kawaharada et al. 2010; Bonamente et al. 2013; Ichikawa et al. 2013). This unphysical situation may be interpreted in terms of an ICP far from the HE. However, simulations show that clusters are subject to an intense activity from the surrounding cluster environment. Continued infall of gas onto clusters along filaments, violent mergers of groups and sub-clusters, and supersonic motions of galaxies through the ICP may induce turbulence that gives rise to a nonthermal pressure (Lau et al. 2009; Burns et al. 2010; Vazza et al. 2011). The weakening of the accretion shocks not only lowers the entropy production but also increases the amount of bulk energy to drive turbulence into the outskirts (Cavaliere et al. 2011). The result is that in addition to the thermal pressure a nonthermal component may sustain the HE to obtain an increasing mass profile and therefore a more accurate determination of the baryon gas fraction.
We test this possibility in Abell 1835, observed by Chandra out to a radial distance of 2.4 Mpc, exploiting the SM formalism; the latter is able to include a nonthermal component (see Eq. 2), at variance with the fitting formulae used in the analysis of the cluster X-ray observables by Bonamente et al. (2013) and Landry et al. (2012). To determine the level and distribution of the nonthermal pressure that in addition to the thermal pressure sustains the HE we have imposed that the gas baryon fraction equals the observed cosmic value at the virial radius . Our constraint is supported by the Suzaku observations that report a gas mass fraction, defined by the lensing total mass, that at agrees with the cosmic baryon fraction. Also the combined analysis of Eckert et al. (2013) reports that at the gas fraction converges for relaxed clusters to the expected value.
The thermal and nonthermal pressure profiles of Fig. 5 define the total pressure distribution that guarantees HE everywhere as evidenced by the increasing profile of the cluster mass (see Eq. 2 and Fig. 3). The goodness of the SM analysis is confirmed by the comparison between our total mass values at and with the weak lensing cluster mass measured by Clowe & Schneider (2002) and Hoekstra et al. (2012). In particular, the last authors report consistent with our value of obtained with and inconsistent with the value of derived when the HE is supported only by the thermal pressure ().
For Abell 1835 we obtain a nonthermal pressure contribution at the virial radius around 60 of the total pressure and in agreement with the simulations of Burns et al. (2010) that report for a sample of clusters. The ratio between the mass estimated including turbulence in the SM and the mass estimated without turbulence is 2.4. Giles et al. (2012) found that X-ray hydrostatic masses for relaxed clusters are underestimated by a factor 1.210.23 when compared to the weak-lensing masses. The level of the nonthermal pressure at the virial radius and the ratio are strictly related to the ICP temperature run that is the main responsible for the mass profile. The above values are justified by the uncommon drop of a factor 10 from the peak temperature to the value at the virial radius reported by Chandra in Abell 1835 (see Fig. 1). A lower value () is reported by Suzaku (Ichikawa et al. 2013). For a drop factor of 2.5, more similar to those reported by Suzaku observations in other clusters, we obtain that the nonthermal pressure at the virial radius decreases to of the total pressure and lowers to 1.31 consistent with the average value derived by Giles et al. (2012). For this smoother decline of the temperature profile the nonthermal pressure contribution to the total support is consistent with that derived by simulations for relaxed clusters (see Lau et al. 2009; Vazza et al. 2011). These simulations show a radial increase of similar to that described by Eq. 3 and a nonthermal pressure contribution to the total pressure of (30-40) at the virial boundary. Greater values are obtained in the simulations of some relaxed clusters. A lower level of about 20% has been derived by the analysis of Morandi et al. (2012). A value that is also lower than the predictions from numerical simulations. This discrepancy may be due to their use of X-ray data limited at where the steepening of the temperature profile observed by Chandra and Suzaku is not yet evident. A further cause is to consider spherical averaging of ellipsoidal galaxy clusters in the context of X-ray observables. However, the mean biases in observables are not greater than few percent within (Buote & Humphrey 2012), although higher values are likely going toward the virial radius.
Mahdavi et al. (2013) found relaxed clusters consistent with no bias when hydrostatic and weak lensing masses are compared at . But, we believe that the increasing radial profile of reported by the simulations may give hydrostatic masses that bias low at the virial radius. This is supported by the differences between and at and in the relaxed Abell 1835 (see Fig. 3). This difference is negligible at and much evident at .
In summary, we have shown how the analysis of the X-ray observables allows to derive a total mass profile consistent with the weak lensing measurements, and to trace the thermal and nonthermal pressure profiles. This can be obtained on introducing in the HE equation a nonthermal pressure support as allowed by our SuperModel. In particular, we have reconstructed from Chandra X-ray observations the gas and total mass profiles of Abell 1835. The values of and that defines the nonthermal pressure component have been obtained by the condition that equals - at the virial radius. We have also shown that the level of turbulence depends on the observed ICP temperature profile. A steep drop in implies a decreasing mass profile and therefore a high level of turbulence is required to obtain an increasing cluster mass profile that satisfies the cosmic gas mass fraction at the virial boundary. A lower level is necessary for a smoother decline of the temperature. This is consistent with the weakening of the accretion shocks that leads to a reduction of the thermal energy to feed the ICP entropy and to an increase of the bulk energy to drive turbulence in the cluster outskirts. As discussed in Sect. 2, the weakening degree of the accretion shocks may depend on the cluster environment and this seems to be confirmed by the significant azimuthal variations of the electron density, temperature and entropy reported by Suzaku (Ichikawa et al. 2013). Using the SDSS photometric data for Abell 1835 and Abell 1689, the authors found that the hot regions are associated with a filamentary structure, while the cold regions contact low-density regions outside the clusters. Finally, the increasing profile at reported in Fig. 3 confirms the conclusion of Rasheed et al. (2010) that the baryons are not missing. They are simply located in the most peripheral regions of the clusters likely for the heating processes (such as shocks-heating of the gas, supernovae and AGN feedback) that cause the ICP to expand or hinder its inflow.
References
- (1)
- (2) Afshordi, N., Lin, Y-T, Nagai, D., & Sanderson A. J. R. 2007, MNRAS 378, 293
- (3)
- (4) Akamatsu, H., Hoshino, A., Ishisaki, Y., Ohashi, T., Sato, K., Takei, Y., & Ota, N. 2011, PASJ, 63, 1019
- (5)
- (6) Arnaud, M., Pointecouteau, E., & Pratt, G. W. 2007, A&A, 474, L37
- (7)
- (8) Bardeau, S., Soucail, G., & Kneib, J.-P., et al. 2007, A&A, 470, 449
- (9)
- (10) Battaglia, N., Bond, J. R., Pfrommer, C., & Sievers, J. L. 2012, ApJ, submitted (preprint arXiv:1209.4082)
- (11)
- (12) Bautz, M.W., Millwe, E.D., & Sanders, J. S. et al. 2009, PASJ, 61, 1117
- (13)
- (14) Bonamente, M., Landry, M., Maughan, B., Giles, P., Joy, M., & Nevalainen, J. 2013, MNRAS, 428, 2812
- (15)
- (16) Buote, D. A., & Humphrey, P. J. 2012, MNRAS, 421, 1399
- (17)
- (18) Burns, J. O., Skillman, S., W., & O’Shea, B., W. 2010, ApJ, 721, 1105
- (19)
- (20) Cavaliere, A., Lapi, A., & Fusco-Femiano, R. 2011, ApJ, 742, 19
- (21)
- (22) Cavaliere, A., Lapi, A., & Fusco-Femiano, R. 2009, ApJ, 698, 580
- (23)
- (24) Cavaliere, A., & Fusco-Femiano, R. 1976, A&A, 49, 137
- (25)
- (26) Clowe, D., & Schneider, P. 2002, A&A, 395, 385
- (27)
- (28) Dahle, H. 2006, ApJ, 563, 954
- (29)
- (30) Ebeling, H. et al. 1998, MNRAS, 301, 881
- (31)
- (32) Eckert, D., Molendi, S., Vazza, F., Ettori, S., & Paltani, S. 2013, 551, A22
- (33)
- (34) Eckert, D., Ettori, S., Molendi, S., Vazza, F., & Paltani, S. 2013 A&A 551, A23
- (35)
- (36) Ettori, S. et al. 2009, A&A, 501, 61
- (37)
- (38) Fusco-Femiano, R., Cavaliere, A., & Lapi, A. 2009, ApJ, 705, 1019
- (39)
- (40) Fusco-Femiano, R., Lapi, A., & Cavaliere, A., 2013, ApJL, 763, 3
- (41)
- (42) Giles, P. A., Maughan, B. J., Dahle, H., Bonamente, M., et al. 2012, in preparation
- (43)
- (44) Giodini, S. et al. 2009, ApJ, 703, 982
- (45)
- (46) Gonzalez, A. H., Zaritsky, D., & Zabludoff, A. I. 2007, ApJ, 666, 147
- (47)
- (48) Hinshaw, G., Larson, D., Komatsu, E., et al. 2013, ApJS, submitted (preprint arXiv:1212.5226)
- (49)
- (50) Hoekstra, H., Mahdavi, A., Babul, A., & Bildfell, C. 2012, MNRAS, 427, 1298
- (51)
- (52) Hoshino, A., Henry, P. H., Sato, K., et al. 2010, PASJ, 62, 371
- (53)
- (54) Iapichino, L., & Niemeyer, J. C. 2008, MNRAS, 388, 1089
- (55)
- (56) Ichikawa, K., Matsushita, K., Okabe, N. et al. 2013, ApJ, 766, 90
- (57)
- (58) Kawaharada, M., Okabe, N., Umetsu, K., et al. 2010, ApJ, 714, 423
- (59)
- (60) Komatsu, E., Smith, K. M., Dunkley, J., et al. 2011, ApJS, 192, 18
- (61)
- (62) Landry, M., Bonamente, M., Giles, P., Maughan, B., & Joy, M. 2012, MNRAS, submitted (preprint arXiv:1211.4626)
- (63)
- (64) Lapi, A., Fusco-Femiano, R., & Cavaliere, A. 2010, A&A, 516, 34
- (65)
- (66) Lau, E. T., Kravtsov, A. V., & Nagai, D. 2009, ApJ, 705, 1129
- (67)
- (68) Li, C. K., Jia, S. M., Chen, Y., et al. 2012, A&A, 545, 100
- (69)
- (70) Mahdavi, A., Hoekstra, H., Babul, A., & Henry, J.P. 2008, MNRAS, 384, 1567
- (71)
- (72) Mahdavi, A., Hoekstra, H., Babul, A., et al. 2013, ApJ, 767, 116
- (73)
- (74) Metzler, C. A., & Evrard, A. E. 1994, ApJ, 437, 564
- (75)
- (76) Morandi, A., Limousin, M., Sayers, J., et al. 2012, MNRAS, 425, 2069
- (77)
- (78) Nagai, D., Vikhlinin, A., & Kravtsov, A. V. 2007, ApJ, 665, 98
- (79)
- (80) Nagai, D., Kravtsov, A. V., & Vikhlinin, A. 2007, ApJ, 668, 1
- (81)
- (82) Nagai, D., & Lau, E. T. 2011, ApJL, 731, 10
- (83)
- (84) Planck Collaboration 2013a, A&A, submitted (preprint arXiv:1303.5076)
- (85)
- (86) Planck Collaboration 2013b, A&A, 550, A131
- (87)
- (88) Rasheed, B., Bahcall, N., & Bode, P. 2010, PNAS; submitted (preprint arXiv:1007.1980v1)
- (89)
- (90) Rasia, E. et al. 2012, New Journal of Physics, 14, 055018
- (91)
- (92) Reese, E. D., Carlstrom, J., E., Joy, M., et al. 2002, ApJ, 581, 53
- (93)
- (94) Sayers, J., Golwala, S. R., Ameglio, S., & Pierpaoli, E. 2011, ApJ, 728, 39
- (95)
- (96) Shaw, L. D., Nagai, D., Bhattacharya, S., & Lau, E. T. 2010, ApJ, 725, 1452
- (97)
- (98) Simionescu, A. et al. 2011, Science, 331, 1576
- (99)
- (100) Schmidt, R. W., Allen, S. W., & Fabian, A. C. 2001, MNRAS, 327, 1057
- (101)
- (102) Sun, M. et al. 2009, ApJ, 693, 1142
- (103)
- (104) Sunyaev, R. A., & Zeldovich, Ya. B. 1980, ARA&A, 18, 537
- (105)
- (106) Tozzi, P., & Norman, C. 2001, ApJ, 546, 63
- (107)
- (108) Umetsu, K. et al. 2009, ApJ, 694, 1643
- (109)
- (110) Valdarnini, R. 2011, A&A, 526, 158
- (111)
- (112) Vazza, F., Brunetti, G., Gheller, C., & Brunino, R. 2010, New Astron., 15, 695
- (113)
- (114) Vazza, F., Brunetti, G., Gheller, C., Brunino, R., & Bruggen, M. 2011, A&A, 529, A17
- (115)
- (116) Vazza, F., Eckert, D., Simionescu, A., Bruggen, M., & Ettori, S. 2013, MNRAS, 429, 799
- (117)
- (118) Vikhlinin, A., Kravtsov, A., Forman, W., et al. 2006, ApJ, 640, 691
- (119)
- (120) Voit, G. M. 2005, Rev. Mod. Phys., 77, 207
- (121)
- (122) Walker, S., Fabian, A., Sanders, J., & George, M. 2012, MNRAS, 427, 45
- (123)
- (124) Walker, S., Fabian, A., Sanders, J., & George, M. 2012, MNRAS, 424, 1826
- (125)
- (126) Walker, S., Fabian, A., Simionescu, A, & Tawara, Y. 2013, MNRAS, in press (preprint arXiv:1303.4240)
- (127)
- (128) White, S. D. M., Navarro, J. F., Evrard, A. E., & Frenk, C.S. 1993, Nature 366, 429
- (129)
- (130) Zhang, Y.-Y., Finoguenov, A., Bohringer, H., et al. 2007, A&A, 467, 437
- (131)