Route guidance strategies revisited: Comparison and evaluation in an asymmetric two-route traffic system
Abstract
To alleviate traffic congestion, a variety of route guidance strategies has been proposed for intelligent transportation systems. A number of the strategies are proposed and investigated on a symmetric two-route traffic system over the past decade. To evaluate the strategies in a more general scenario, this paper conducts eight prevalent strategies on a asymmetric two-route traffic network with different slowdown behaviors on alternative routes. The results show that only mean velocity feedback strategy is able to equalize travel time, i.e., approximate user optimality; while the others fail due to incapability of establishing relations between the feedback parameters and travel time. The paper helps better understand these strategies, and suggests mean velocity feedback strategy if the authority intends to achieve user optimality.
keywords:
Nagel-Schrekenberg model , Asymmetric traffic system , Route guidance strategy , Intelligent transportation system1 Introduction
Nowadays traffic congestion has been one of the most prevalent city diseases. To alleviate the congestion, route guidance strategies, which recommend optimal route for drivers, are receiving extensive attention (see e.g. Pavlis, 1999; Deflorio, 2000; Wahle et al., 2002; van den Berg et al., 2004; Hegyi, 2004; Liu and Chang, 2011; Nagatani and Naito, 2011; Tobita and Nagatani, 2012). Over the past decade, a variety of route guidance strategies has also been proposed and investigated in the field of physics, such as travel time feedback strategy (TTFS) (Wahle and Bazzan, 2000), mean velocity feedback strategy (MVFS) (Lee and Hui, 2001), congestion coefficient feedback strategy (CCFS) (Wang et al., 2005), prediction feedback strategy (PFS) (Dong et al., 2009), weighted congestion coefficient feedback strategy (WCCFS) (Dong et al., 2010b), corresponding angle feedback strategy (CAFS) (Dong and Ma, 2010), vehicle number feedback strategy (VNFS) (Dong et al., 2010a), vacancy length feedback strategy (VLFS) (Chen et al., 2012), etc. All these strategies are proposed and studied in a symmetric two-route traffic network first adopted in Wahle and Bazzan (2000). The remarkable features of the traffic system are not only the same configurations of alternative routes, but also the same slowdown probability utilized in the employed Nagel-Schrekenberg model, which reflects drivers’ imperfect break behaviors. However, the slowdown probability pertaining to routes is not the same most of time in reality due to different traffic conditions on alternative routes, such as different road types, different percentages of trucks, etc.
The paper is thus dedicated to evaluating the effectiveness of the existing strategies in a more general asymmetric two-route network with different slowdown probability on alternative routes. The research will help better understand these strategies and provide implications for practical applications of the strategies. Toward the end, the remainder of the paper is organized as follows: section 2 briefly describes eight route guidance strategies revisited in the paper; section 3 introduces the traffic flow model and the user optimality; section 4 compares and evaluates the performance of these strategies in symmetric and asymmetric traffic systems; conclusions are made at last.
2 The existing route guidance strategies
The paper revisits the following eight route guidance strategies:
TTFS diverts an incoming vehicle to a route with the minimum travel time of the last departure vehicle. When a route is empty, the travel time is set as free flow travel time, i.e., dividing route length by maximum velocity.
MVFS diverts an incoming vehicle to a route with the minimum mean velocity of all en-route vehicles.
CCFS diverts an incoming vehicle to a route with the minimum congestion coefficient, which is defined as
| (1) |
where is vehicle number of the ith congestion cluster in which vehicles are close to each other without any gap; is a weight coefficient, and the value is set as 2 as Wang et al. (2005) did; is the total number of en-route vehicles.
PFS diverts an incoming vehicle to a route with the minimum congestion coefficient in prediction time. Prediction is made in the same simulation scenario, and the value is set as 60s as Dong et al. (2009) suggested.
WCCFS diverts an incoming vehicle to a route with the minimum weight congestion coefficient, which is proposed as
| (2) |
where is a weight function; is the location of the middle vehicle in the ith congestion cluster; and are respectively set as -2 and 2 as suggested in Dong et al. (2010b).
CAFS diverts an incoming vehicle to a route with the minimum corresponding angle congestion coefficient, which reads
| (3) |
where stands for a corresponding angle of the ith congestion cluster; and are the locations of the first and last vehicles in the ith congestion cluster; is set as 100 as Dong and Ma (2010) did.
VNFS diverts an incoming vehicle to a route with the minimum number of en-route vehicles.
VLFS diverts an incoming vehicle to a route with the maximum distance between entrance and the vehicle closest to the entrance.
Obviously, CCFS, PFS, WCCFS and CAFS are based on measuring the congestion cluster; we thus call them as cluster-based strategies.
3 The traffic flow model and the user optimality
As the previous works proposing the strategies did, the paper also employs the Nagel-Schrekenberg (NS) model (Nagel and Schreckenberg, 1992), one of the most popular traffic flow models presently. Due to popularity of the NS model, we do not introduce the details except for the slowdown probability (for more information one can refer to relevant papers such as those cited in the introduction). The slowdown probability incorporated in the NS model is to reflect drivers’ imperfect break behaviors, i.e., at each simulation step a vehicle reduces its velocity by one unit with the slowdown probability. With consideration of the probability, macroscopic traffic phenomena such as stop-and-go waves, traffic breakdown, can be well reproduced by the NS model. Obviously, the larger the probability is, the larger the number of congestion clusters is.
The diversion is at each time step generating a new vehicle that chooses a route completely following the recommendation of the route guidance strategies; the new vehicle will be deleted if its target loading cell (the first cell) is occupied. Note that drivers’ completely follow implies that all outcomes are led by the strategies; it is benefit to evaluate the strategies.
Compared with optimizing traffic conditions of a route guidance strategy, we are more interested in its ability of achieving user optimality (UO), i.e., equalizing travel times on two routes. It is because that UO is compatible with drivers’ own decision criteria, whereas system optimality would sacrifice some drivers’ benefits; it may lead to large scale rejection of route guidance in the long practical run (Chiu and Huynh, 2007; Papageorgiou et al., 2007).
4 Simulation results
4.1 A scenario on a symmetric two-route traffic network
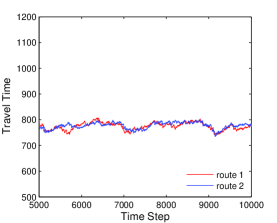
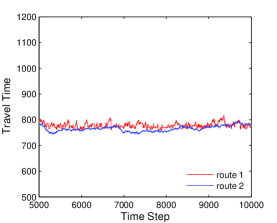
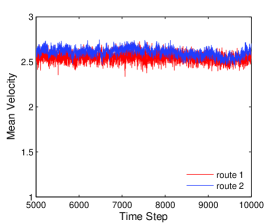
To be convenient for comparison, we first test the strategies on a symmetric traffic system as the previous works did, i.e., a network with two alternative routes, one entrance and two exits. More specifically, the routes have the same length 2000 cells, the same maximum velocity 3 cells and the same slowdown probability . 10000 time steps are conducted and only the stable results from 5000 to 10000 are presented here. Moreover, we take experienced travel time of departure vehicles as travel time on a route.
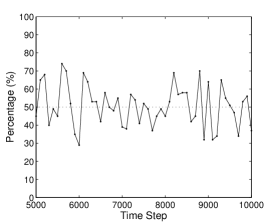
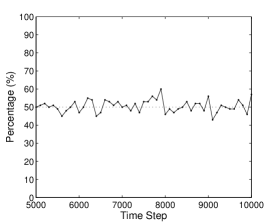
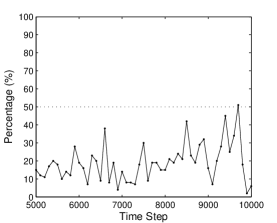
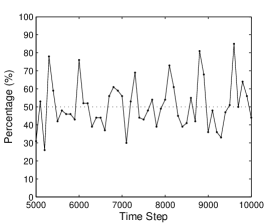
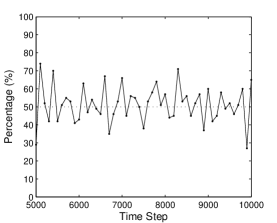
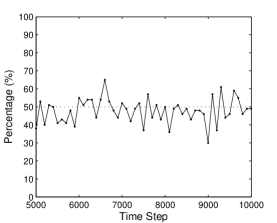
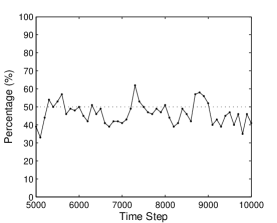
Figure 1 presents the simulation results. It is obvious that all strategies except for TTFS approximate UO in the scenario. Figure 2 show vehicle percentages diverting to route 2; all strategies except for TTFS result in around 50% diversions due to identity of the routes. The failure of TTFS can be explained by the lag effect as the previous works mentioned, i.e., the experienced traffic conditions of a departure vehicle can not reflect the conditions behind it.

4.2 A scenario on an asymmetric two-route traffic network
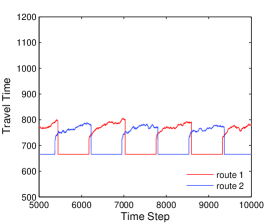
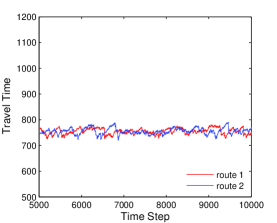
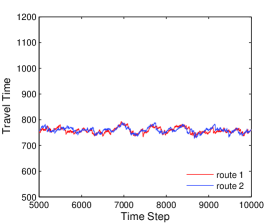
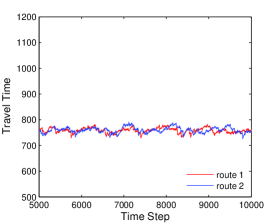
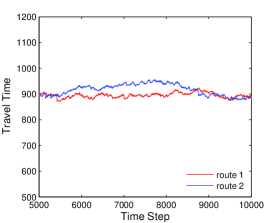
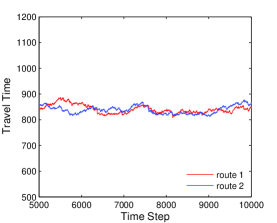
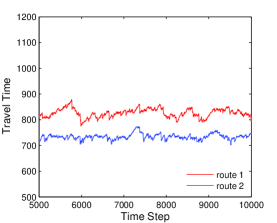
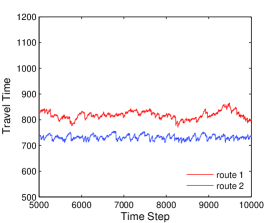
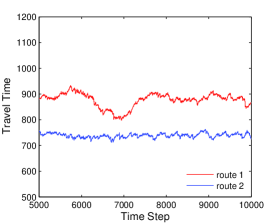
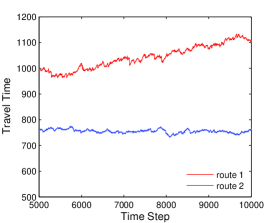
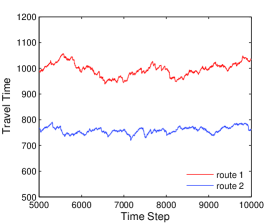
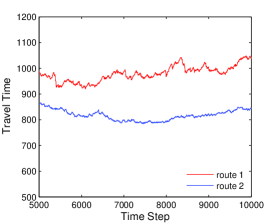
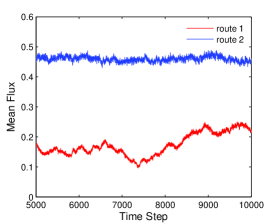
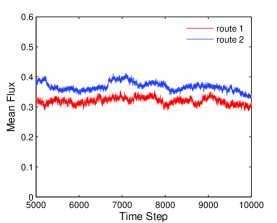
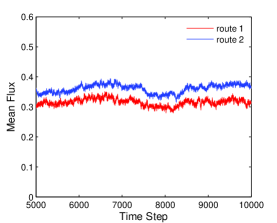
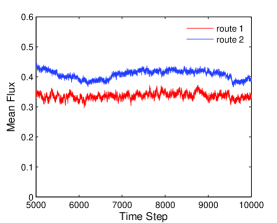
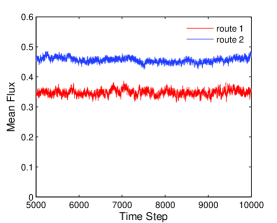
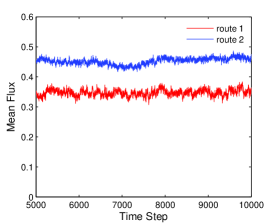
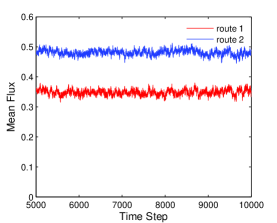
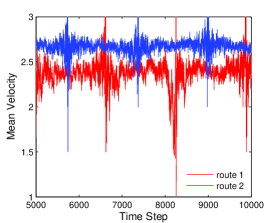
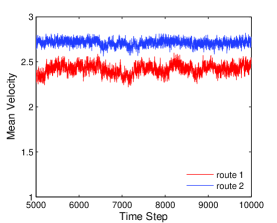
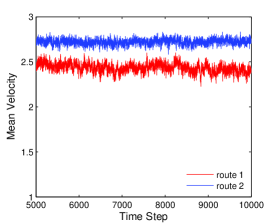
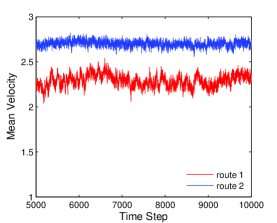
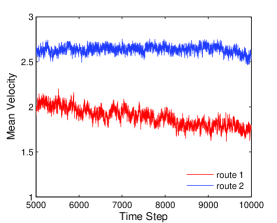
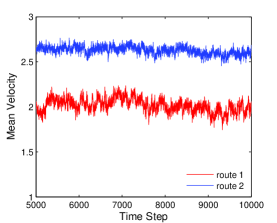
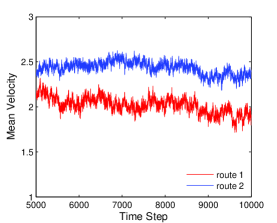
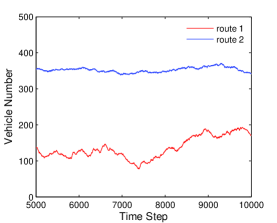
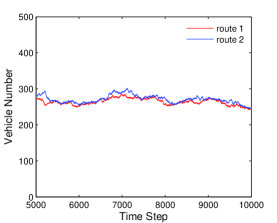
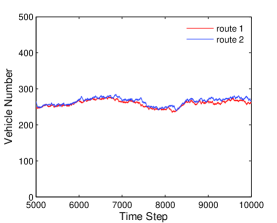
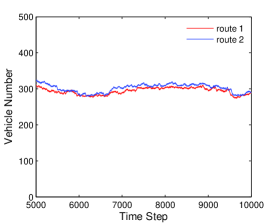
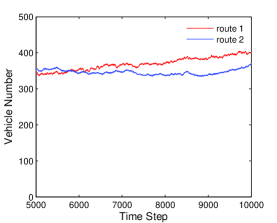
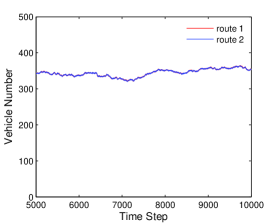
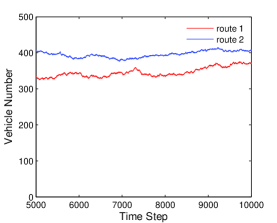
In the section, we apply the existing strategies on a more general asymmetric two-route traffic network, i.e., the alternative routes have different slowdown probability, say and , the traffic conditions on route 1 are worse than those on route 2; the others are unchanged.
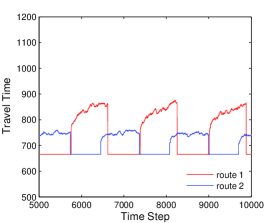
Figure 3 compares the travel times resulted by the eight route guidance strategies on two routes at all time steps. Figure 4, 5 and 6 present the corresponding traffic conditions. It can be seen that only MVFS results in close travel times on two routes, i.e., approximates UO, while the others fail. The reason is straightforward that only mean velocity in MVFS has a close relation with travel time, i.e., close mean velocity leads to close travel time on alternative routes; the congestion coefficient, vehicle number, vacancy length, etc. in the other strategies are unable to reflect the relations in the considered scenario. Thus, only MVFS approximates UO by equalizing mean velocity.
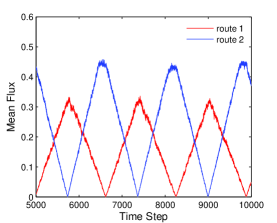
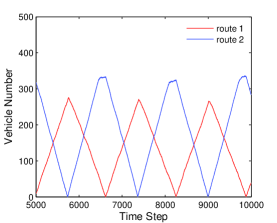
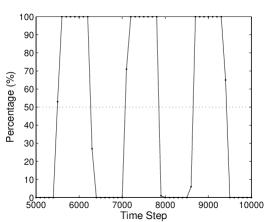
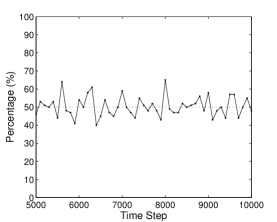
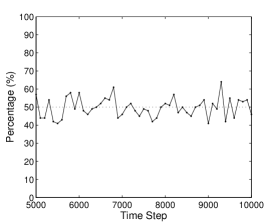
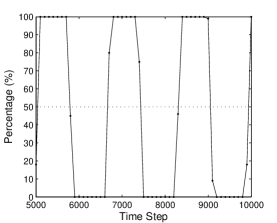
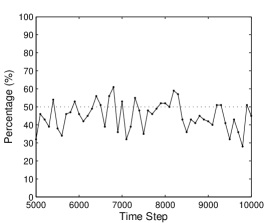
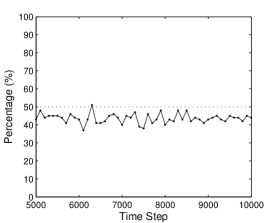
To show the ability of reflecting the difference of slowdown probability, Figure 7 presents the diversion rates of the eight strategies. Except for TTFS and MVFS, all strategies still divert incoming vehicles by around 50%, which are similar with those in the symmetric network; it implies that the strategies are unable to reflect the difference of the slowdown probability. In contrast, MVFS diverts more vehicles on route 2 due to the worse traffic conditions on route 1.
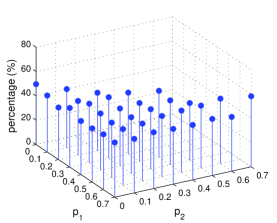
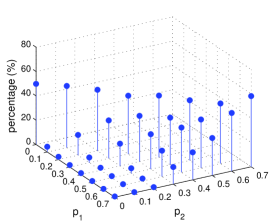
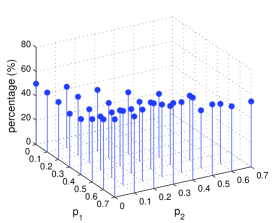
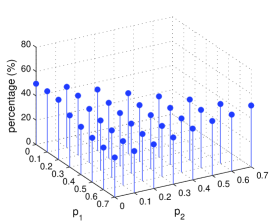
To enhance in the direction, we present mean percentages with different combinations of and in Figure 8. Clearly, all cluster-based strategies perform similarly in all given combinations, and TTFS, VNFS and VLFS also fail to reflect the difference in the asymmetric network. It strengthens that the strategies are unable to reflect the difference of the slowdown probability in the more general asymmetric network.

We lastly revisit the success of the cluster-based strategies in the symmetric network. These strategies work based on measuring the congestion cluster on alternative routes. Although the slowdown probability is involved in the NS model, the number, sizes, locations, etc. of the congestion clusters are basically approximate on the same routes according to the law of large numbers as the routes are quite long (2000 cells); it is just like repeating trials with one probability, and the mean obviously tends to one value when the number of repetition is high. Although various weights are introduced by different strategies, the generated coefficients on the same routes are still close. Therefore, the strategies direct about half of vehicles on route 1 and the other half on route 2 as shown in Figure 2; it is similar with randomly or alternatively diverting. Whereas for a symmetric network, it is obvious that a simple and effective way to achieve balance is randomly or alternatively diverting vehicles. This is the reason that the strategies perform well in the symmetric network.
5 Conclusions
The paper evaluates the following eight prevalent route guidance strategies in an asymmetric traffic system with different slowdown behaviors on two alternative routes: travel time feedback strategy, mean velocity feedback strategy, congestion coefficient feedback strategy, prediction feedback strategy, weighted congestion coefficient feedback strategy, corresponding angle feedback strategy, vehicle number feedback strategy, vacancy length feedback strategy.
The results show that only mean velocity feedback strategy is able to approximate user optimality in the more general asymmetric traffic system, although all strategies except (for travel time feedback strategy) can also make it in the symmetric system. The causes are analyzed, and we finally suggest mean velocity feedback strategy if the authority intends to achieve user optimality in practical traffic systems.
Acknowledgements
The research has been funded by 973 Program (2012CB725403), the National Science Foundation of China (71131001) and the Fundamental Research Funds for the Central Universities (2012JBM064).
References
- van den Berg et al. (2004) van den Berg, M., Schutter, B.D., Hegyi, A., 2004. Model predictive control for mixed urban and freeway networks. Transportation Research Record: Journal of the Transportation Research Board 1748, 55–65.
- Chen et al. (2012) Chen, B., Xie, Y., Tong, W., Dong, C., Shi, D., Wang, B., 2012. A comprehensive study of advanced information feedbacks in real-time intelligent traffic systems. Physica A: Statistical Mechanics and its Applications 391, 2730–2739.
- Chiu and Huynh (2007) Chiu, Y.C., Huynh, N., 2007. Location configuration design for Dynamic Message Signs under stochastic incident and ATIS scenarios. Transportation Research Part C: Emerging Technologies 15, 33–50.
- Deflorio (2000) Deflorio, F., 2000. A routing feedback strategy for urban road networks. Proceedings of 7th World Congress on ITS (Turin), ITS , 1–8.
- Dong and Ma (2010) Dong, C., Ma, X., 2010. Corresponding Angle Feedback in an innovative weighted transportation system. Physics Letters A 374, 2417–2423.
- Dong et al. (2010a) Dong, C., Ma, X., Wang, B., 2010a. Advanced information feedback strategy in intelligent two-route traffic flow systems. Science China Information sciences .
- Dong et al. (2010b) Dong, C.F., Ma, X., Wang, B.H., 2010b. Weighted congestion coefficient feedback in intelligent transportation systems. Physics Letters A 374, 1326–1331.
- Dong et al. (2009) Dong, C.F., Ma, X., Wang, G.W., Sun, X.Y., Wang, B.H., 2009. Prediction feedback in intelligent traffic systems. Physica A: Statistical Mechanics and its Applications 388, 4651–4657.
- Hegyi (2004) Hegyi, A., 2004. Model predictive control for integrating traffic control measures. Ph.D. thesis. Delft University of Technology.
- Lee and Hui (2001) Lee, K., Hui, P., 2001. Effects of announcing global information in a two-route traffic flow model. Journal of the Physical Society Of Japan , 2000–2002.
- Liu and Chang (2011) Liu, Y., Chang, G.l., 2011. An integrated control model for freeway corridor under non-recurrent congestion. IEEE Transactions on Intelligent Transportation Systems 60, 1404–1418.
- Nagatani and Naito (2011) Nagatani, T., Naito, Y., 2011. Tour time in a two-route traffic system controlled by signals. Physica A 390, 4522–4527.
- Nagel and Schreckenberg (1992) Nagel, K., Schreckenberg, M., 1992. A cellular automaton model for freeway traffic. Journal de Physique I , 2221–2229.
- Papageorgiou et al. (2007) Papageorgiou, M., Ben-Akiva, M., Bottom, J., Bovy, P., Hoogendoorn, S., Hounsell, N., Kotsalos, A., McDonald, M., 2007. ITS and traffic management, in: Barnhart, C., Laporte, G. (Eds.), Handbook in OR & MS. Elsevier B.V.. chapter 11.
- Pavlis (1999) Pavlis, Y., 1999. Simple decentralized feedback strategies for route guidance in traffic networks. Transportation science 33, 264–278.
- Tobita and Nagatani (2012) Tobita, K., Nagatani, T., 2012. Effect of signals on two-route traffic system with real-time information. Physica A: Statistical Mechanics and its Applications 391, 6137–6145.
- Wahle and Bazzan (2000) Wahle, J., Bazzan, A., 2000. Decision dynamics in a traffic scenario. Physica A: Statistical … 287, 669–681.
- Wahle et al. (2002) Wahle, J., Bazzan, A.L.C., Klügl, F., Schreckenberg, M., 2002. The impact of real-time information in a two-route scenario using agent-based simulation. Transportation Research Part C: Emerging Technologies 10, 399–417.
- Wang et al. (2005) Wang, W.X., Wang, B.H., Zheng, W.C., Yin, C.Y., Zhou, T., 2005. Advanced information feedback in intelligent traffic systems. Physical Review E 72, 066702.