BROAD BAND X-RAY SPECTRA OF TWO LOW-LUMINOSITY ACTIVE GALACTIC NUCLEI NGC 1566 AND NGC 4941 OBSERVED WITH SUZAKU
Abstract
We report the first broad band X-ray spectra of the low luminosity active galactic nuclei (LLAGN) NGC 1566 (type 1.5) and NGC 4941 (type 2) observed with Suzaku and Swift/BAT covering the 0.5–195 keV band. Both targets have hard X-ray luminosities of ergs s-1 in the 15–55 keV band. The spectra of the nucleus are well reproduced by a sum of partially or fully covered transmitted emission and its reflection from the accretion disk, reprocessed emission from the torus accompanied by a strong narrow iron-K line, and a scattered component (for NGC 4941). We do not significantly detect a broad iron-K line from the inner accretion disk in both targets, and obtain an upper limit on the corresponding solid angle of in NGC 1566. The reflection strength from the torus is moderate, in NGC 1566 and in NGC 4941. Comparison of the equivalent width of the narrow iron-K line with a model prediction based on a simple torus geometry constrains its half-opening angle to be in NGC 4941. These results agree with the obscured AGN fraction obtained from hard X-ray and mid-infrared selected samples at similar luminosities. Our results support the implication that the averaged covering fraction of AGN tori is peaked at ergs s-1 but decreases toward lower luminosities.
Subject headings:
galaxies: active – galaxies: individual (NGC 1566, NGC 4941) – X-rays: galaxies1. INTRODUCTION
X-ray surveys of active galactic nuclei (AGNs) have revealed that the cosmological evolution of AGN luminosity function is well described by the luminosity-dependent density evolution characterized by “down-sizing”, where the low-luminosity AGNs show the peak of their comoving space density at lower redshift than that of high-luminosity ones (e.g., Ueda et al., 2003; Hasinger et al., 2005). It is being confirmed by optical AGN surveys of unobscured AGNs (e.g., Ikeda et al., 2012). This fact suggests that the growth history of supermassive black holes (SMBHs) may fundamentally differ between the low mass and high mass SMBH-galaxy systems in the present-day universe. Thus, it is quite interesting to investigate the nature of low-luminosity AGNs (LLAGNs) in comparison with more luminous populations. Despite their abundance in the space density, however, the detailed study of broad band X-ray spectra of LLAGNs has been limited due to their faint nature (for previous works below 10 keV, see e.g., Terashima et al., 2002; Cappi et al., 2006; Ho, 2008; Emmanoulopoulos et al., 2013).
Observed AGN properties strongly depend on the luminosities in many aspects. In particular, it is known that the obscured (type-2) fraction of AGNs shows strong anti-correlation with luminosity (for X-ray selected samples see e.g., Ueda et al., 2003; Hasinger, 2008), indicating that the covering fraction of obscuring material around a SMBH is smaller in more luminous AGNs. Recent studies based on hard X-ray (keV; Beckman et al. 2009; Burlon et al. 2011) and mid-infrared (Brightman & Nandra, 2011b) selected samples suggest that this relation is more complex when LLAGNs are included. The obscured fraction has a peak of 0.6–0.8 around the 15–55 keV luminosity (hereafter ) of ergs s-1 below which it starts to decrease toward lower luminosity, although the sample size of LLAGNs is quite limited. To understand the AGN phenomena in a unified way over the wide range of luminosity, it is crucial to establish the trend and reveal the origin.
Broad band X-ray data are useful to constrain the geometry of surrounding material around the SMBH as well as physics of the inner accretion disk. The Suzaku satellite (Mitsuda et al., 2007) has unique capability to simultaneously observe X-ray spectra covering the 0.2–700 keV band with good energy resolution below 10 keV. Recent numerical models of X-ray spectra based on Monte Carlo simulations (Ikeda et al., 2009; Murphy & Yaqoob, 2009; Brightman & Nandra, 2011a) are powerful tools to infer the geometry of the torus, such as the opening angle, column density, and inclination angle (e.g., Awaki et al., 2009; Eguchi et al., 2011; Tazaki et al., 2011).
Since the obscured fraction of AGNs should reflect the covering fraction of the absorbing material, we expect the torus structure of LLAGNs with ergs s-1 may be different from that of typical Seyfert galaxies with ergs s-1. In this paper, we present results from the first simultaneous X-ray spectra covering the 0.5–30 keV band of two nearby LLAGNs, NGC 1566 ( = 0.0050) and NGC 4941 ( = 0.0037) observed with Suzaku. These targets have ergs s-1 and were selected from the Swift/BAT AGN catalog (Baumgartner et al., 2012), which ensures sufficiently bright hard X-ray fluxes above 10 keV. Our main aim is to constrain their torus geometry by precise measurements of the reflection component with an iron-K fluorescence line. Swift/BAT spectra in the 14–195 keV band averaged over 70 months are also utilized in the analysis.
| Target Name | NGC 1566 | NGC 4941 |
|---|---|---|
| Start Time (UT) | 2012 May 19 1:36 | 2012 June 22 11:16 |
| End Time (UT) | 2012 May 20 6:34 | 2012 June 24 5:52 |
| Exposure (XIS) (ks) aaBased on the good time interval of XIS-0. | 72.8 | 80.8 |
| Exposure (HXD/PIN) (ks) | 76.0 | 72.0 |
| Target Name | NGC 1566 | NGC 4941 |
|---|---|---|
| SWIFT ID | SWIFT J0420.0-5457 | SWIFT J1304.3-0532 |
| R.A. (J2000)aaThe position of each source is taken from the NASA/IPAC Extragalactic Database. | 04 20 00.42 | 13 04 13.14 |
| Decl. (J2000)aaThe position of each source is taken from the NASA/IPAC Extragalactic Database. | -54 56 16.1 | -05 33 05.8 |
| Redshift | 0.0050 | 0.0037 |
| Classification | Seyfert 1.5 | Seyfert 2 |
NGC 1566 is classified as Seyfert 1.5 (Véron-Cetty & Véron, 2006) and has a morphology of barred spiral, Sb (Sandage & Bedke, 1994; Fisher & Drory, 2008). No good quality X-ray spectra have been obtained up to present even below 10 keV. NGC 1566 was detected in the XMM-Newton slew survey (Saxton et al., 2008), and its 2–10 keV luminosity () was estimated to be ergs s-1 for an assumed photon index of (Levenson et al., 2009). Using archival data of the ROSAT High Resolution Imager, Liu & Bregman (2005) detected four Ultraluminous X-ray sources within NGC 1566, whose summed luminosity is ergs s-1 in the 0.3–8 keV band. Thus, we neglect their contribution in our spectral analysis. The black hole mass is estimated to be log through the empirical – relation (Gültekin et al., 2009) with the velocity dispersion given in the HyperLeda database (Paturel et al., 2003). The Eddington ratio is calculated to be from a 2–10 keV luminosity converted from the Swift/BAT one for (our best-fit). Here we assume a bolometric correction factor of (Ho, 2009; Vasudevan et al., 2009).
NGC 4941 is a Seyfert 2 galaxy (Véron-Cetty & Véron, 2006) with a morphology type of Sa (Fisher & Drory, 2008). In the X-ray band, this source was observed with ASCA in 1996 July and 1997 January (Terashima et al., 2002; Cardamone et al., 2007), with BeppoSAX in 1997 January (Maiolino et al., 1998), and with Chandra in 2011 March (Bottacini et al., 2012). The ASCA and BeppoSAX observations reveal that the spectra are heavily absorbed with a strong iron-K emission line. As the BeppoSAX/PDS data above 10 keV are not usable due to the poor statistics (Maiolino et al., 1998), our Suzaku data provide the first simultaneous broad band X-ray spectra in the 0.5–30 keV band from this source. The black hole mass of NGC 4941 is estimated to be (Asmus et al., 2012), and the Eddington ratio is from the Swift/BAT luminosity with and .
The organization of this paper is as follows. Section 2 describes the observations and data reduction. The analysis and results are presented in Section 3, and discussion is given in Section 4. We summarize our conclusion in Section 5. Throughout the paper, we adopt distances of 16.5 Mpc for NGC 1566 and 19.7 Mpc for NGC 4941 (Theureau et al., 2007) in calculating the luminosities unless otherwise stated. In all spectral analysis, we apply the Galactic absorption fixed at cm-2 for NGC 1566 and cm-2 for NGC 4941, which are estimated from the H I map (Kalberla et al., 2005). The solar abundances by Anders & Grevesse (1989) are assumed in all cases. The errors attached to spectral parameters are given at 90% confidence limits for a single parameter of interest.
2. OBSERVATION AND DATA REDUCTION
2.1. Observations
We observed NGC 1566 and NGC 4941 with Suzaku (Mitsuda et al., 2007) in 2012 May and June, respectively, for a net exposure of 80 ks each. Suzaku is the Japan-US X-ray astronomy satellite. It carries four X-ray CCD cameras called X-ray Imaging Spectrometer (XIS-0, XIS-1, XIS-2 and XIS-3) as focal plane detectors of four X-Ray Telescopes (XRTs), and a collimated hard X-ray instrument called the Hard X-ray Detector (HXD) composed of Si PIN photodiodes and GSO scintillation counters. XIS-0, XIS-2, and XIS-3 are front-side-illuminated CCDs (FI-XISs), while XIS-1 is back-side-illuminated one (BI-XIS). XIS-2 has not been available since 2007 November 7. The XISs cover the energy range of 0.3–12 keV, while the HXD/PIN and HXD/GSO cover 15–70 keV and 50–600 keV, respectively. Our targets were pointed close to the center of the XIS field-of-view (the XIS nominal position). The observation log and basic information are listed in Tables 1 and 2.
2.2. Data Reduction
We analyze the Suzaku data using the HEAsoft version 6.12 package, starting from the unfiltered event data produced by the pipeline processing version 2.7.16.33. The spectral analysis is performed on XSPEC version 12.7.1. To apply the latest energy calibration of XIS, we reprocess the unfiltered data with xispi and @xisrepro on the basis of the calibration database (CALDB) released on 2012 September 12.
The XIS events are extracted from a circular region with a radius of 2.8 arcmin (NGC 1566) or 1.8 arcmin (NGC 4941) around the peak of the point spread function of the XRT. The background is taken from source-free, circular regions within the field-of-view. We only use the PIN data from the HXD, as our targets are too faint in the energy band above 50 keV to be detected with the GSO. We utilize so-called the “tuned” non X-ray background (NXB) model of HXD/PIN produced with the LCFITDT method (Fukazawa et al., 2009). Then, the modelled Cosmic X-ray Background (CXB) spectrum based on the formula of Gruber et al. (1999) is added on that of the NXB. The systematic error of the NXB is estimated to be in the 15–40 keV band for a unit of 40 ks exposure, which does not significantly affect our results.
2.3. Light Curves
Figure 1 shows the background-subtracted light curves of NGC 1566 and NGC 4941 in the 2–10 keV band (XIS0 XIS3; upper panel), , and in the 16–40 keV band (PIN; middle), . The lower panels plot the hardness ratio between the above two energy bands, /. The bin size is set to be 5760 sec (orbital period of Suzaku) to exclude any modulations that depend on orbital phase. As noticed from the figure, the 2–10 keV flux of NGC 1566 slightly increased around 50 ks since the start of the observation, although it is not evident in the 16–40 keV band. We find, however, no differences over statistical errors in the best-fit spectral parameters of NGC 1566 except for the flux normalization between the first and second half of the observation. The XIS and PIN light curves of NGC 4941 suggest only weak flux variation. Thus, we analyze the time-averaged spectra of Suzaku for both targets.


3. ANALYSIS AND RESULTS
3.1. Broad-Band Spectral Analysis
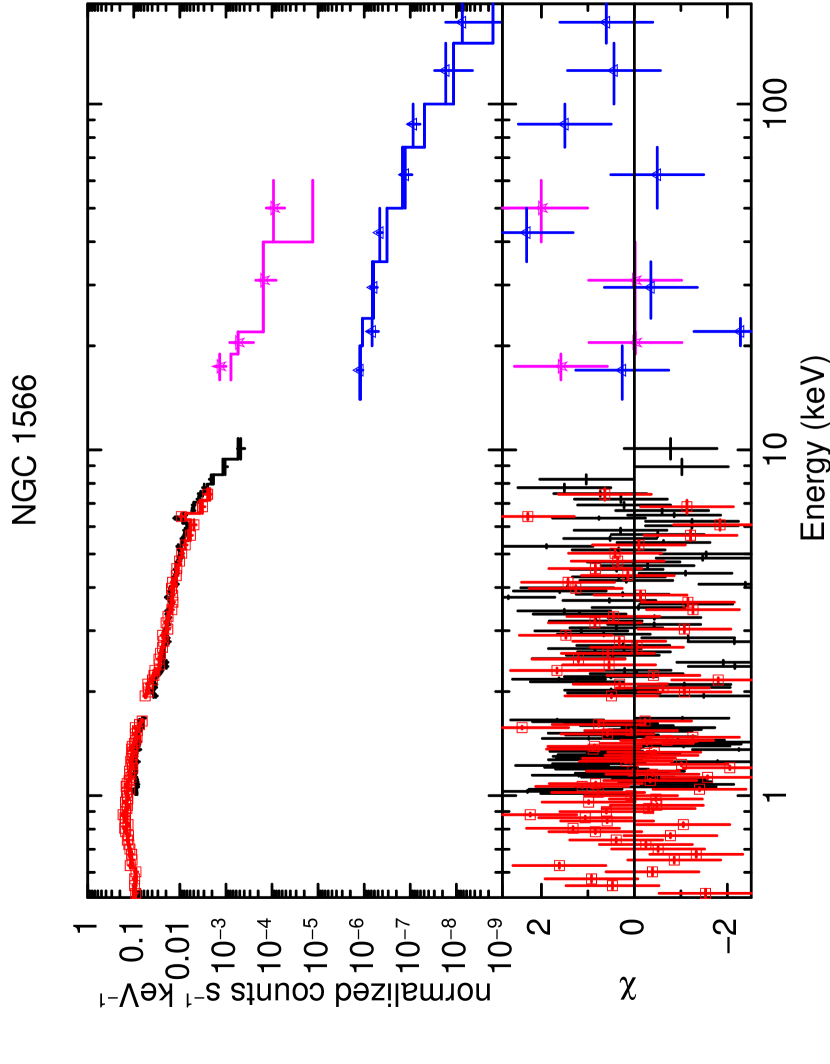
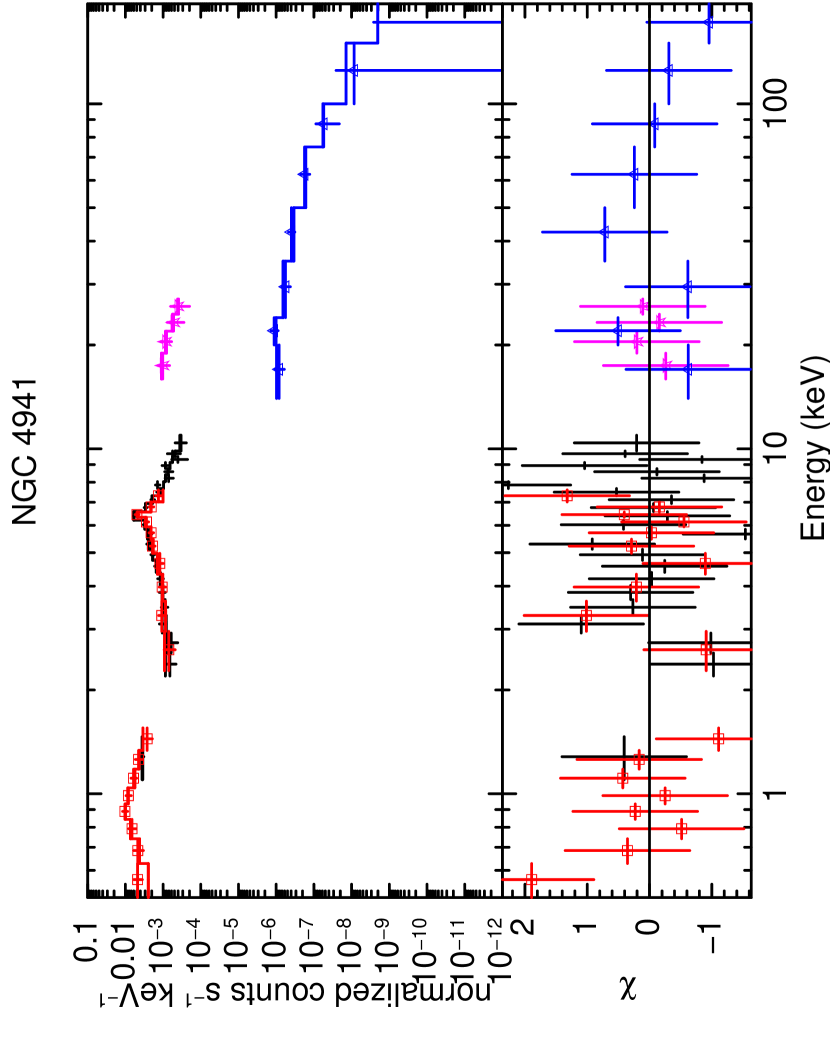
For spectral analysis, we use the data of FI-XISs (XIS0 XIS3), BI-XIS (XIS1), and HXD/PIN in the energy band of 1–12 keV, 0.5–8 keV, and 16–60 keV (16–30 keV for NGC 4941), respectively, where sufficient signal-to-noise ratio is achieved. To obtain better constraint on the hard X-ray spectra, we include the Swift/BAT spectra in the 14–195 keV band averaged over 70 months (Baumgartner et al., 2012). The 1.7–1.9 keV band in the XIS spectra is excluded to avoid systematic uncertainties in the energy response around the Si K-edge region. The Suzaku spectra folded with the responses are plotted in the upper panels of Figure 2. The Swift/BAT spectra in the photon flux unit are also shown there. As noticed, the spectrum of NGC 1566 is essentially unabsorbed, while that of NGC 4941 is subject to heavy absorption. Conspicuous iron-K emission lines are noticed at the rest-frame 6.4 keV in both targets.
We simultaneously fit the Suzaku and Swift/BAT spectra, which cover the wide energy range of 0.5–195 keV altogether. To absorb the cross-calibration error in absolute fluxes between the XISs and the HXD, the relative normalization of the HXD/PIN to FI-XISs is fixed to be 1.16 according to the result based on the Crab Nebula observations (Maeda et al., 2008), while that between BI-XIS and FI-XISs is set free because they cover the similar energy bands and even a small systematic error in their relative flux calibration would affect the fit significantly. We do not apply such correction for instrumental calibration between the Suzaku and Swift/BAT data, although time variability between the two periods is taken into account, as detailed below.
We follow previous work by Tazaki et al. (2013), who constrain the torus structures of two very luminous radio-loud AGNs, 3C 206 and PKS 0707–35, by applying a physically motivated spectral model to the data of Suzaku and Swift/BAT. In this paper we basically adopt the same model as in Tazaki et al. (2013), which is composed of four components for the nucleus emission: (1) the primary transmitted component from the nucleus, (2) reflection component from the accretion disk, (3) that from the torus, and (4) scattered component from surrounding gas in the case of absorbed AGN (NGC 4941). In addition, we also consider emission from an optically-thin thermal plasma in the host galaxy, which is often observed from LLAGNs as “soft excess” below 1 keV (Terashima et al., 2002). It is modelled with the apec model (Smith et al., 2001) on XSPEC. We approximate the shape of the primary continuum with an exponential cutoff power law model, . Since it is not possible to set a meaningful limit on from our data, we fix it at 360 keV for consistency with the torus model by Ikeda et al. (2009). Even if we instead set at 300 keV, an averaged value in nearby AGNs reported by Dadina (2008), the results of our spectral fits are little affected.
Time variability of the direct component flux is expected between the short (2 days) Suzaku observation and the long (70 months) Swift/BAT observations. To reflect it, we introduce a normalization factor of Suzaku (FI-XISs) relative to the Swift/BAT, , as a free parameter, assuming that the continuum shapes (i.e., and ) are constant. The same factor is also applied to the reflection component from the accretion disk, while we do not apply it to that from the torus, the scattered component, and the thin thermal emission, assuming that their fluxes do not change over years because of their large spatial scales.
For calculation of the reflection components, we utilize the pexmon model (Nandra et al., 2007), which consists of the continuum of the pexrav model (Magdziarz & Zdziarski, 1995) from cold matter and fluorescence lines of iron-K, iron-K, and nickel-K self-consistently calculated with the continuum. The only free parameter of the model is the reflection strength , where is the solid angle of the reflector covering the X-ray source. As for the reflection component from the accretion disk, we apply blurring due to Kepler motion and relativistic effects around a non-rotating black hole with the convolution model rdblur.
One important goal is to constrain the torus structure through its reflection component . Since the two reflection components from the torus and accretion disk are strongly coupled with each other in spectral fit, we need to fix the reflection strength from the accretion disk on the basis of reasonable assumptions. Following Tazaki et al. (2013), we estimate a value of from the disk () by combining a theoretical equivalent width of an iron-K line given by George & Fabian (1991) and the pexmon reflection code. George & Fabian (1991) calculates the iron-K equivalent width from an optically thick plane irradiated by a primary X-ray source above it for three parameters, (i) ratio between the height of the source () and the inner radius of the disk () , (ii) inclination, and (iii) photon index. We assume ( is the gravitational radius where , , and is the gravitational constant, black hole mass, and light velocity, respectively). Some works suggest that the accretion disk of LLAGNs with ergs s-1 is not extending down to the innermost stable circular orbit, but likely to be truncated at much larger radii, (e.g., Quataert et al. 1999 for M81 and NGC 4579, Ptak et al. 2004 for NGC 3998, Nemmen et al. 2006 for NGC 1097). We thus adopt the inner radius to be in our models. The inclination is assumed to be 30∘ for NGC 1566 (unobscured AGN) and 70∘ for NGC 4941 (obscured AGN). We consider a range of photon index of 1.9–2.1 as obtained from our data. The expected equivalent width of the iron-K line is then calculated to be 15–21 eV (NGC 1566) and 14–16 eV (NGC 4941). We find that the corresponding reflection strength of the pexmon model that produces these values becomes in both targets. We confirm that the spectral parameters obtained from the broad band fits are not changed over the 90% confidence errors even if we assume different inclination angles within a range of 20∘-60∘ for NGC 1566 and 30∘-80∘ for NGC 4941. Effects by changing or (and hence ) will be examined in the following subsections, which do not affect our conclusions, either.
3.1.1 NGC 1566
We first apply a simple model without any intrinsic absorption composed of the transmitted emission and torus reflection component to the spectra of NGC 1566, which is optically classified as a type 1.5 AGN. The latter is required to explain the strong narrow iron-K line. The model is represented as
-
•
constant*zpowerlw*zhighect+pexmon
in XSPEC terminology. The constant term takes into account flux variability of the direct component between the observation epochs of Suzaku and Swift/BAT, and the power law normalizations in the two terms are tied together. The inclination angle in the pexmon model is set to 60∘ as a representative value, since the code assumes reflection from a half-infinite plane, which is too simple to be applied for a complex torus-like geometry. Changing it to 30∘, however, does not affect our fitting results within the errors. Since a majority of the torus reflection in type-1 AGNs can arise from its inner wall without self obscuration (see e.g., Ikeda et al. 2009 for an example of torus geometry), we do not apply any absorption to this component. The resultant chi-squared value is not acceptable, .
To improve the fit, we add a partial covering model to the first component, which is known to sometimes give a good description of AGN spectra. The likely interpretation is that there is patchy material in the line of sight. This model composition is represented as
-
•
constant*zpcfabs*zpowerlw*zhighect+pexmon,
where zpcfabs represents an absorption by cold matter with a column density and a covering fraction of . The addition of zpcfabs significantly improves the fit, yielding a chi-squared value of . Note that the fit is considerably worse when a full covering model (i.e., ) is applied (). Next, we add emission from an optically-thin thermal plasma. This model, represented as
-
•
constant*zpcfabs*zpowerlw*zhighect+pexmon+apec,
better explains the spectra with , and the improvement is confirmed at confidence level on the basis of an F-test. We obtain , , and the variability factor (constant) .
Finally, as a physically motivated model introduced by Tazaki et al. (2013), we further include the reflection component from the accretion disk into the above model. This “final” model is expressed as
-
•
constant*zpcfabs*(zpowerlw*zhighect+rdblur*pexmon)
+pexmon+apec,
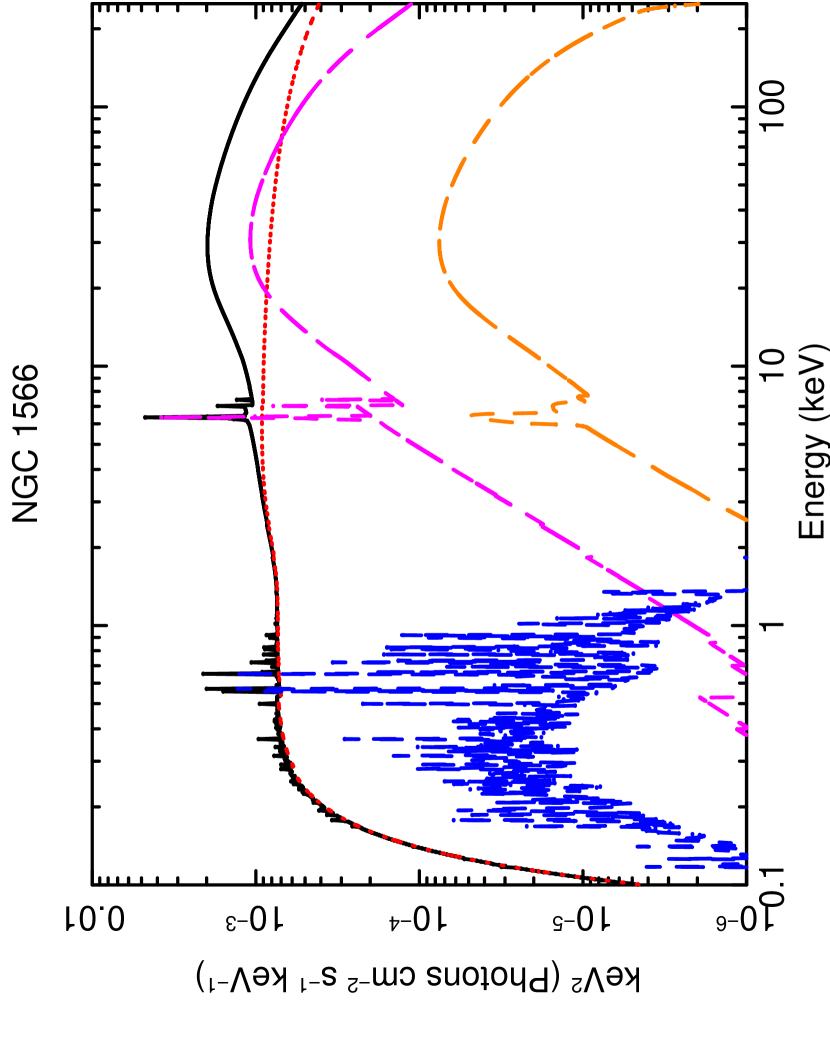
where the second term represents the disk reflection component whose intensity is synchronized with that of the direct component (the first term). The reflection strength from the accretion disk is fixed at (see above), while that from the torus is still left to be a free parameter. Note that, unlike , is defined relative to the flux determined with Swift/BAT, not to that of Suzaku. The inclination in the pexmon model is set to be 30∘ for the disk reflection. In the rdblur model, we fix the inner and outer radii at and , respectively, with an emissivity index of . This outer radius is appropriate if the disk is connected to the pc scale torus, although the choice of does not affect the fit at all. The index is based on a simple assumption of an irradiated disk by a source with a scale height above it (see e.g., Reynolds & Begelman, 1997). This model results in a chi-squared value of . The fitted parameters are summarized in Table 3. We obtain the photon index and the reflection strength from the torus . The variability factor (constant) becomes , indicating the flux of the direct component during the Suzaku observation was much lower compared with the averaged level as determined with Swift/BAT. The best-fit model folded with the responses is overplotted to the data in the upper panels of Figure 2, and the residuals in units of are shown in the lower panels. Figure 3 shows the unfolded spectrum in units of ( is the energy flux at ), where different components are plotted separately.
| NGC 1566 | NGC 4941 | ||
|---|---|---|---|
| (1) | |||
| (2) | |||
| (3) | - | ||
| (4) | - | ||
| (5) | |||
| (6) | |||
| (7) | |||
| (8) | NormXIS | ||
| (9) | |||
| (10) | - | ||
| (11) | |||
| (12) | |||
| (13) | |||
| (14) | |||
| (15) | |||
| (16) | |||
| (17) | |||
Note. — (1) The hydrogen column density of Galactic absorption along the line of sight by Kalberla et al. (2005).
(2) The hydrogen column density for the partial covering model in the fraction of (4) in NGC 1566 and for the direct component in NGC 4941.
(3) The hydrogen column density for the reflection component from the dust torus.
(4) The covering fraction with the hydrogen column density of (2) in NGC 1566.
(5) The inclination angle to the accretion disk.
(6) The inner truncated radius of the accretion disk.
(7) The relative reflection strength () of the accretion disk to the flux measured with Swift/BAT.
(8) The normalization ratio of the flux measured with Suzaku relative to the one with Swift/BAT.
(9) The photon index of the powerlaw model.
(10) The scattering fraction relative to the flux measured with Swift/BAT.
(11) The relative reflection strength () of the dust torus to the flux measured with Swift/BAT.
(12) The temperature (keV) of the apec model.
(13) The observed flux with BI-XIS of Suzaku in the 0.5–2 keV band.
(14) The observed flux with FI-XISs of Suzaku in the 2–10 keV band.
(15) The observed flux with HXD/PIN of Suzaku in the 10–50 keV band.
(16) The flux of the apec model with the correction for the absorption with BI-XIS of Suzaku in the 0.5–2 keV band.
(17) The intrinsic luminosity obtained with FI-XISs of Suzaku corrected for the absorption in the 2–10 keV band.
We note that the presence of the disk reflection component is neither required nor rejected at 90% confidence limits from our data, by comparison with the model without it, which gives a slightly better chi-squared value (214.0). Nevertheless, we adopt it in our paper as the best physically-motived model, because the reflection component from a truncated standard disk at , as suggested from previous studies of LLAGNs (Quataert et al. 1999, Ptak et al. 2004), should be expected even though it is weak. Here we derive an upper limit for the strength of the disk reflection from the data. By adopting different values for the inner radius of , , and , which corresponds to , 0.3, and 0.2 for the source scale height of (see section 3.1), we obtain chi-squared values of 224.5, 219.5, 217.5, respectively, from the broad band spectral fit. Thus, the data constrain at a 90% confidence limit, which is well consistent with our best model, . If we instead assume , then is expected for and the fit results in a worse chi-squared value of 224.3. This implies that the smaller scale height, , is more reasonable unless the disk is truncated at a very large radius like . In any case, we confirm that our conclusion on the torus structure based on the iron-K line analysis described in section 4.3 is not affected by these uncertainties on the disk-reflection component, whose contribution to the total spectrum is rather small.
3.1.2 NGC 4941
We first apply the following model for the broad band spectra of NGC 4941, which is a type-2 AGN and shows clear evidence for an intrinsic absorption:
-
•
constant*zphabs*zhighect*zpowerlw+zphabs*pexmon
+constant*zhighect*zpowerlw
The first and second terms are the transmitted and disk reflection components, respectively. Here we consider absorptions separately for the two components, with for the former and with for the latter, because the torus reflection comes from a large volume and hence could well be subject to a different absorption in average from that for the transmitted emission. The third term represents a scattering component by a gas surrounding the nucleus. It is assumed to have the same photon index as the transmitted component with a relative normalization of (to the Swift/BAT flux). Even though the chi-squared is already acceptable with this model (), we add emission from a thin thermal plasma to the above model, which is often observed in type-2 AGNs (e.g., Turner et al., 1997) including LLAGNs (Terashima et al., 2002). The model composition is then expressed as
-
•
constant*zphabs*zhighect*zpowerlw+zphabs*pexmon
+constant*zhighect*zpowerlw+apec.
The addition of the thin thermal emission significantly improves the fit, reducing the chi-squared value to . We obtain , cm-2, cm-2, , %, and .
In the same way as the spectral analysis of NGC 1566, we finally fit the spectra with the model including the disk reflection component:
-
•
constant*zphabs(zhighect*zpowerlw+rdblur*pexmon)
+zphabs*pexmon+constant*zhighect*zpowerlw+apec.
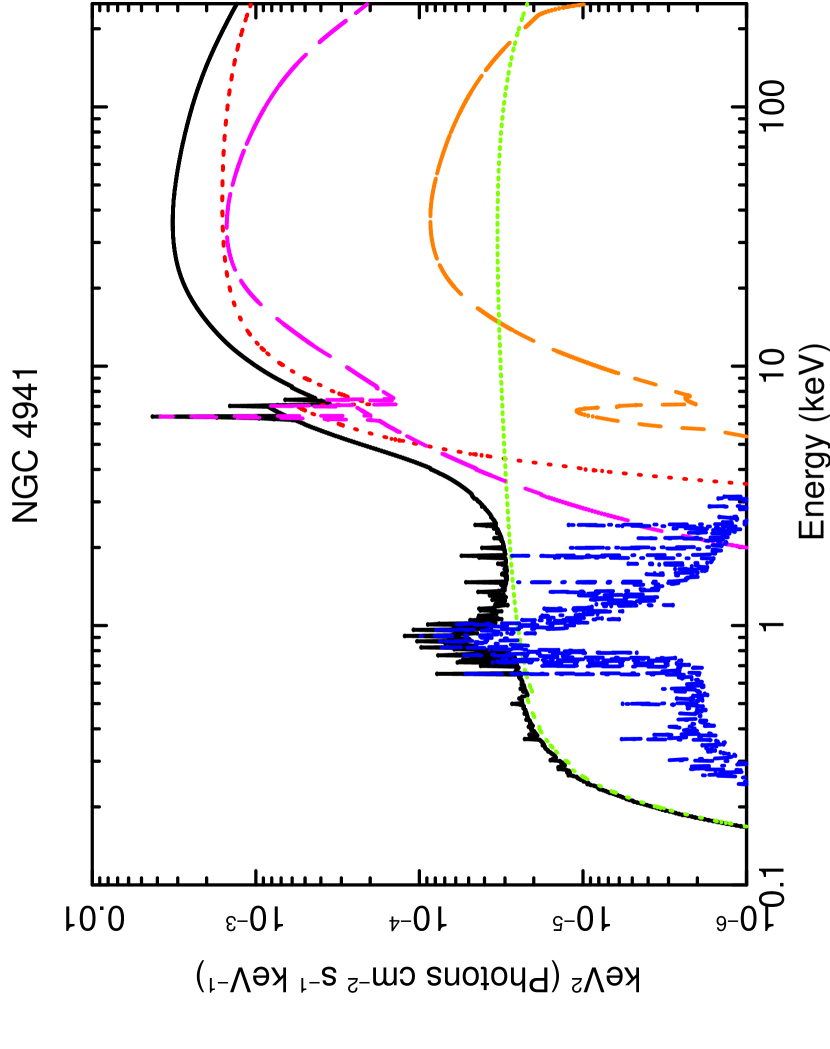
The reflection strength from the accretion disk is fixed at with an inclination of 70∘ (see section 3.1), while that from the torus, , is a free parameter defined relative to the Swift/BAT flux. Again, an inclination of 60∘ is assumed for the torus reflection component as a representative value so that we can more directly compare the result of NGC 1566; the best-fit parameters are not significantly changed even if when an inclination of 30∘ is adopted instead. We find this model describes the observed spectra well () with the best-fit parameters of , cm-2, cm-2, , and %. We obtain , which indicates that the direct component flux was weaker by 52% during the Suzaku observation than the 70-month average observed with Swift/BAT. Unlike the case of NGC 1566, we cannot constrain the strength of the disk reflection from our data, mainly due to the heavy obscuration of the direct and disk-reflection components. We obtain a similar chi-squared value of even when we assume corresponding to for , and when and corresponding to are adopted. Nevertheless, with the same argument for NGC 1566, we adopt this model that includes the disk reflection with as the best physical model for NGC 4941. All the parameters are listed in Table 3. The best-fit folded model is plotted in Figure 2 with fitting residuals (lower panel), and the unfolded spectra in units of are shown in Figure 3.
3.2. Analysis of Iron-K Line in Narrow Band Spectra
| NGC 1566 | NGC 4941 | ||
|---|---|---|---|
| (1) | (keV) | ||
| (2) | (keV) | ||
| (3) | |||
| (4) | |||
| (5) | |||
| (6) | |||
| (7) | |||
| (8) | |||
| (9) | |||
| (10) |
Note. — (1) The line energy of iron-K line in the zgauss model.
(2) The line energy of iron-K line at the rest frame in the model diskline.
(3) The inner truncated radius of the accretion disk.
(4) The inclination angle to the accretion disk.
(5) The photon flux of the model zgauss at the line energy of (1).
(6) The observed equivalent width of the narrow iron-K line relative to the total continuum observed with Suzaku.
(7) The equivalent width of the narrow iron-K line relative to the continuum summed over the direct component and the reflection component from the dust torus.
(8) The photon flux of the model diskline at the line energy of (2).
(9) The observed equivalent width of the broad iron-K line relative to the total continuum observed with Suzaku.
(10) The equivalent width of the broad iron-K line derived from the photon flux of (9) relative to the continuum summed over the direct component and the reflection component from the accretion disk.
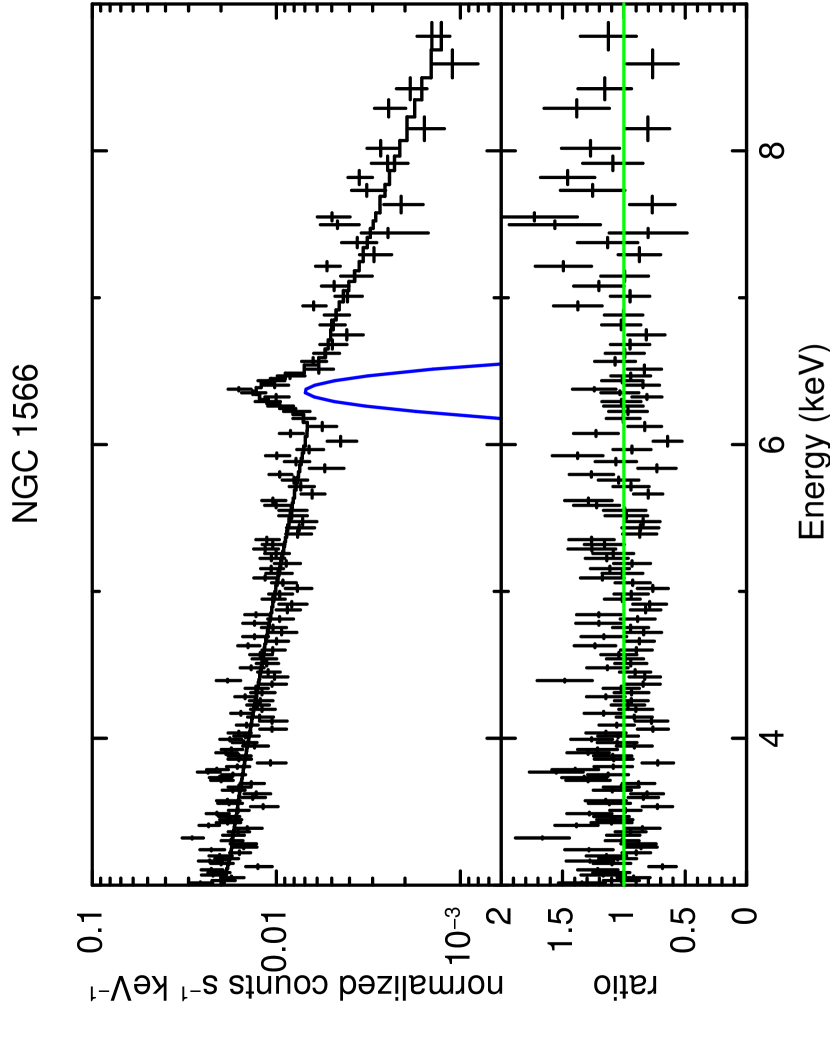
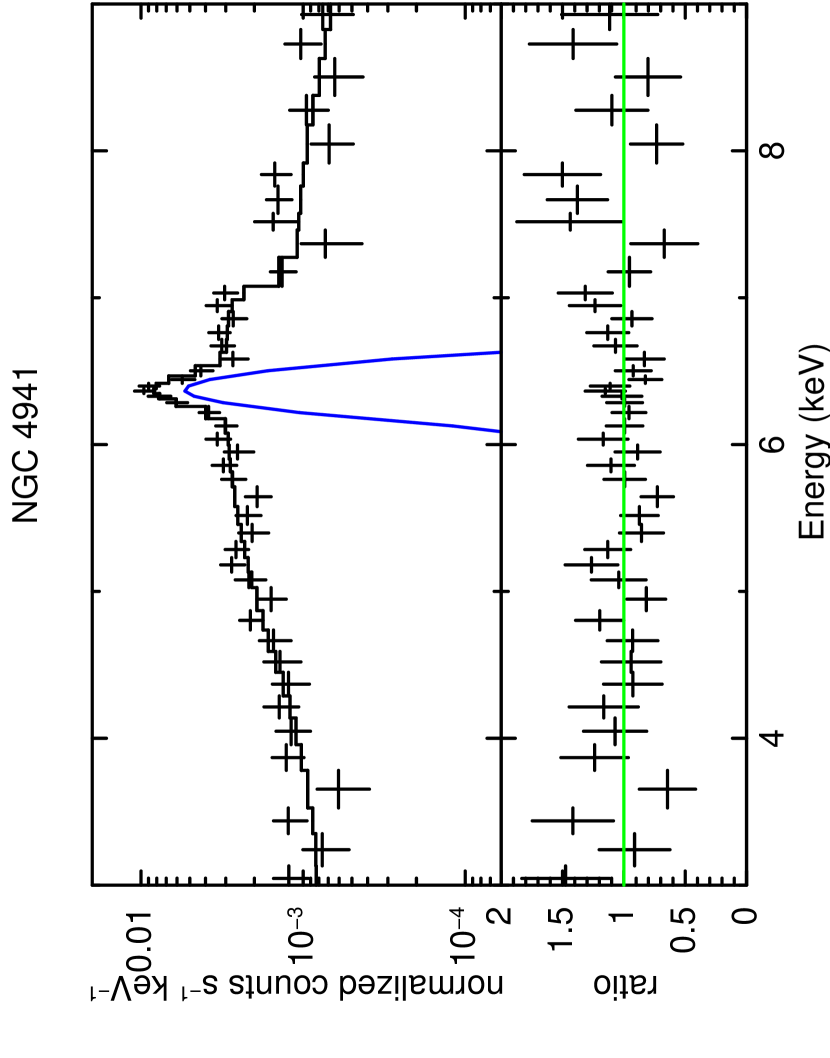
To verify that the above broad-band fit results, we also perform spectral analysis in the narrow 3–9 keV band, focusing on the iron-K line features. This procedure enables us to derive observed equivalent widths (or their upper limits) most directly from the data, independently of the assumption of the reflection model. Here we use the spectra of the FI-XISs in the 3–9 keV band and those of BI-XIS in the 3–8 keV band. Basically, the best-fit continuum model obtained by the broad-band fit is adopted by replacing the pexmon components with the pexrav model, which does not contain fluorescence lines. Instead, we add a diskline component (Fabian et al., 1989) as the iron-K emission line from the accretion disk, and zgauss as that from the torus. The line energies for both components are fixed at 6.4 keV in the rest frame, and the 1 line width of zgauss is set to be 0.1 eV, which is unresolved with the XIS. The line profile parameters in the diskline model are fixed at the same values as those in the rdblur component. Thus, only the normalizations of diskline, zgauss, and zpowerlw are set free, while the other parameters are all fixed at their best fit values determined from the broad-band spectra. Figure 4 shows the FI-XISs spectra in the 3–9 keV band folded with the energy response, where the best-fit models of zgauss are shown.
In both targets, the diskline components are not significantly detected with 90% confidence upper limits on “observed” equivalent widths with respect to the total continuum eV (NGC 1566) and eV (NGC 4941). The error for NGC 4941 is larger than that for NGC 1566 because of the fainter continuum flux due to the heavy absorption and the large inclination assumed () that produces a broader iron-K line profile. To compare these upper limits with the theoretical predictions, we need to subtract the contribution of the torus-reflection and scattered components from the total continuum. Thus we obtain “corrected” equivalent widths of eV (NGC 1566) and eV (NGC 4941). These upper limits are consistent with the calculation by George & Fabian (1991) under our assumptions on the geometry between the primary source and disk () and the inclination, 15–21 eV for NGC 1566 and 14–16 eV for NGC 4941 (see section 3). Hence, adopting the disk-reflection strength of in the broad-band spectral analysis is justified. Note that even when we adopt a smaller inner radius of in the diskline and rdblur models, the broad iron-K line is not significant detected; for = , , or we obtain an upper limit of eV in NGC 1566, although the constraint is weaker in NGC 4941.
We find that the equivalent widths of zgauss relative to the total continuum are eV and eV for NGC 1566 and NGC 4941, respectively. The observed equivalent width of a narrow iron-K line from the torus with respect to the total continuum is subject to variability of the transmitted component, however. From the broad band spectral analysis, we know that the fluxes during the Suzaku observations were much fainter than those of Swift/BAT in both targets. This leads to an overestimate of the true (i.e., time averaged) equivalent widths of the iron-K line. On the basis of our assumption that the long-term Swift/BAT data give the averaged continuum flux that determines the torus reflection strength and narrow iron-K line flux observed with Suzaku, we calculate the true continuum level at 6.4 keV by increasing the transmitted and disk-reflection components by a factor of , and then derive “corrected” equivalent width values, eV for NGC 1566 and eV for NGC 4941.
4. SUMMARY AND DISCUSSION
4.1. Summary of Results
With Suzaku and Swift/BAT, we have obtained the broad-band X-ray spectra covering the 0.5–195 keV band of the two LLAGNs NGC 1566 (type 1.5) and NGG 4941 (type 2) for the first time. The spectrum of NGC 1566 is found to be essentially unobscured, while that of NGC 4941 is subject to heavy absorption. Strong iron-K emission lines at the rest-frame 6.4 keV are detected in both targets. Their spectra are well reproduced by a physically motivated model consisting of a partially or fully absorbed transmitted component with its reflection from the accretion disk, a reflection component from the torus, a scattered component (in NGC 4941), and optically-thin thermal plasma emission. The physical parameters of the thin thermal components (temperature of 0.2–0.9 keV and luminosities in the 0.3–2 keV band of diffuse X-ray emission) are consistent with the origins from star-forming activities in the host galaxies (e.g., Tüllmann et al., 2006), although it may be partially contaminated by line emission from a photoionized plasma powered by the AGN. In fact, the far-infrared luminosities calculated from the IRAS 60 m and 100 m fluxes by using the formula of David et al. (1992) are ergs s-1 (NGC 1566) and ergs s-1 (NGC 4941), suggesting the presence of significant star-forming activities. In the analysis, we carefully take into account time variability of the transmitted plus disk reflection components between the Suzaku and Swift/BAT observations, while it is assumed that the last three components are constant. During the Suzaku observations, the flux levels of both objects were significantly fainter than their 70 months average obtained by Swift/BAT.
An important result is that both NGC 1566 and NGC 4941 show moderate mount of the torus reflection, and , respectively, relative to the time-averaged flux of the direct component measured by Swift/BAT. They are slightly smaller as a typical total reflection strength observed in Seyfert galaxies, (e.g., Dadina, 2008). The torus structure inferred from this result is quantitatively discussed in subsection 4.3.
We compare our results on NGC 4941 with previous results obtained by ASCA in 1996 July and 1997 January (Terashima et al., 2002) and BeppoSAX in 1997 January (Maiolino et al., 1998), although much simpler spectral models are adopted there due to the limited statistics in the spectra. The equivalent width of the narrow iron-K line is reported to be eV (ASCA) and eV (BeppoSAX). The Suzaku result of eV may be slightly smaller than these. If we compare the iron-K line flux instead of equivalent width, however, we find they are all consistent within the statistical errors; , , and photons cm-2 s-1 in the ASCA, BeppoSAX, and Suzaku observations, respectively. This supports our hypothesis that the absolute flux of the reflection component originating from the torus is nearly constant as its variability is smeared out. The column density for the transmitted component ( cm-2) is consistent with both that suggested by Terashima et al. (2002) and by Maiolino et al. (1998) within the statistical error. We obtain the photon index , which is consistent with a canonical value of AGNs (Nandra & Pounds, 1994; Dadina, 2008). Terashima et al. (2002) report a little smaller photon index () but this may be affected by the reflection component that is ignored in their model.
4.2. Reflection Component from the Accretion Disk
The XIS spectra in the 3–9 keV band suggest that a broad iron-K line feature arising from the inner accretion disk is very weak in NGC 1566, although it is more difficult to constrain its intensity in NGC 4941 due to the heavy absorption and high inclination. Applying a relativistic line profile with an inner radius of , we obtain an upper limit on the corrected equivalent width of 42 eV for NGC 1566. This result constrains the reflection strength from a cold accretion disk to be as defined in the pexmon model. In fact, when we adopt a larger value of expected from the case of (where is the height of the irradiating source) according to George & Fabian (1991), the broad band fit of NGC 1566 becomes significantly worse () compared with that for (). The small reflection suggests that the inner disk is likely to be truncated at relatively large radius, although it is difficult to unambiguously determine the truncation radius, which depends on the assumed corona geometry. The weak disk reflection is consistent with the result by Ptak et al. (2004), who found for the LLAGN NGC 3998 ( ergs s-1) from the X-ray spectrum. We do not rule out, however, the possibility that there is a very highly ionized disk that produces almost featureless continuum around the iron-K band.
4.3. Torus Structure
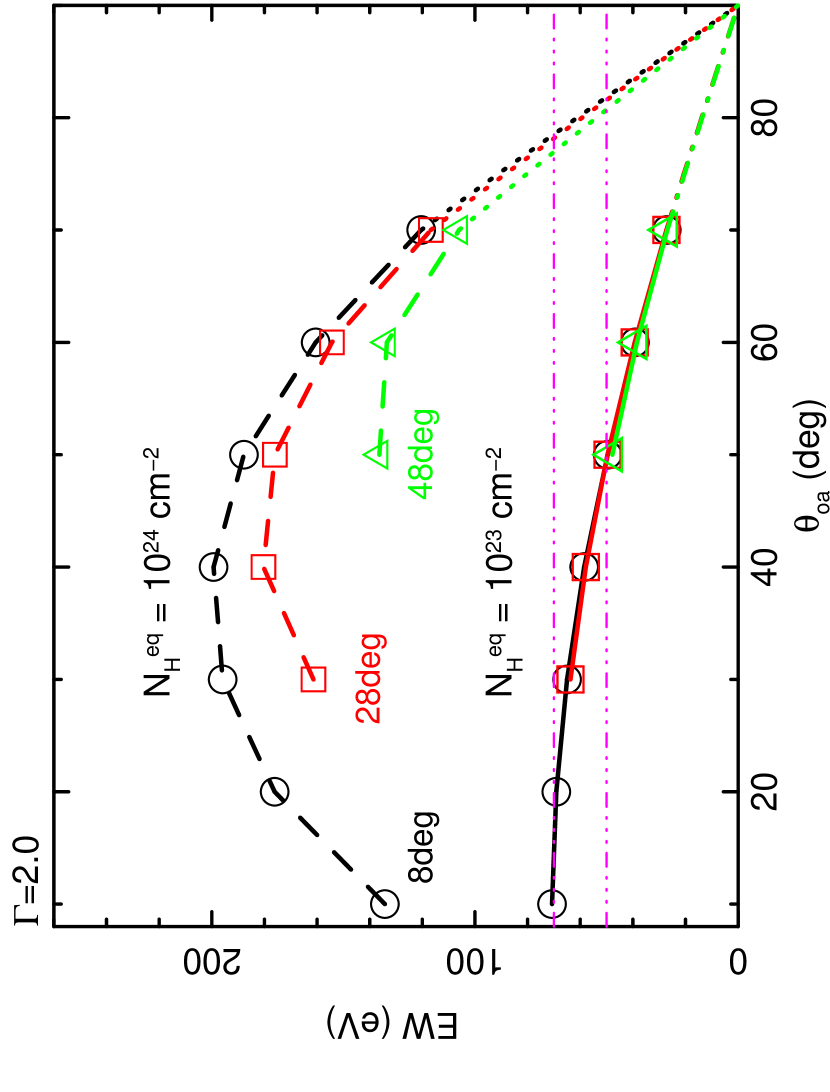
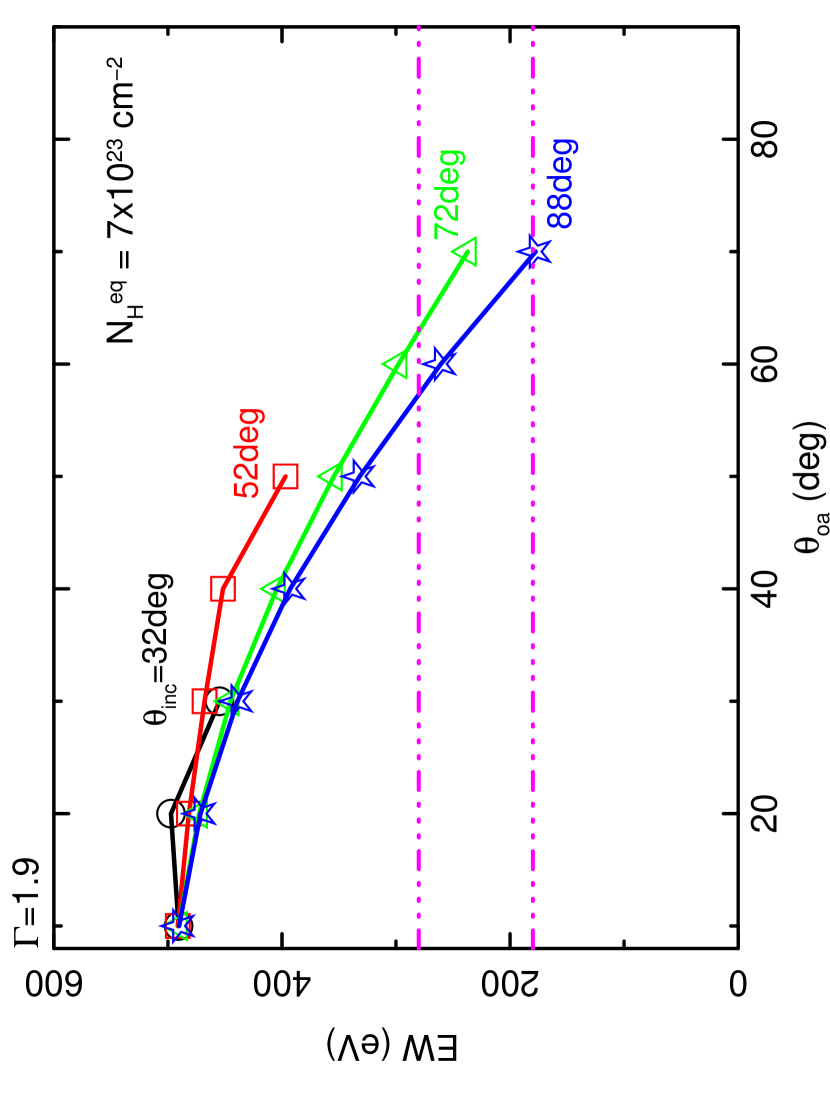
The equivalent width of narrow iron-K line from an AGN is very useful to constrain the torus structure such as the opening angle. For this purpose, we utilize the Monte-Carlo based numerical model by Ikeda et al. (2009), which calculates absorbed direct component and the reflected continuum with fluorescence lines from an AGN surrounded by a torus. In this model, the geometry of the torus is close to be a spherical shape defined by three parameters (for details see Figure 2 of Ikeda et al. 2009): hydrogen column density at the equatorial plane , half opening angle , and inclination . Hence, for type 1 AGN and for type 2 AGN. The incident spectrum is assumed to be a power law with an exponential cutoff at 360 keV. As done in Tazaki et al. (2013), we plot the predicted equivalent width of the iron-K line as a function of half opening angle with several different inclinations in Figures 5 for type-1 AGNs and Figures 6 for type-2 AGNs. We consider two cases of cm-2 or cm-2 with (the best fit value of NGC 1566) in Figure 5, while cm-2 and , the best fit line-of-sight column density and photon index of NGC 4941, are assumed in Figure 6. Above where the Ikeda model is not available, we extrapolate the data by assuming that the equivalent width is proportional to the volume of the torus.
The dashed horizontal lines (magenta) in Figures 5 and 6 represent the error region of the corrected equivalent width for NGC 1566 and NGC 4941, respectively. Although the result of NGC 1566 does not constrain the half opening angle within the range of cm-2, the reflection strength implies by assuming . For NGC 4941, the half opening angle is estimated to be from the iron-K equivalent width, which is consistent with . Thus, in both targets, modest covering factors of the tori are suggested.
According to the unified scheme, the torus covering fraction determines the fraction of obscured AGNs. Thus, it is quite interesting to compare with the result on the type-2 fraction derived from unbiased AGN surveys. On the basis of the Swift/BAT survey performed in the 15–55 keV band, Burlon et al. (2011) suggest that the fraction has a peak of 0.6–0.8 around ergs s-1 and decreases toward both higher and lower luminosity ranges. At ergs s-1, the fraction is estimated to be (see e.g., their Figure 16), although the error is still quite large due to a limited number of LLAGNs detected in the hard X-ray survey. Similar results are also obtained from X-ray follow-up observations of IRAS 12 m selected galaxies (Brightman & Nandra, 2011b). Based on the best-fit model, the 15–55 keV luminosity of NGC 1566 and NGC 4941 are ergs s-1 and ergs s-1. Our result on the torus half-opening angle of these sources, , can be converted into an obscured fraction of 0.34–0.64, which is fully consistent with the above survey results at a similar luminosity range.
Near infrared reverberation mapping observations of nearby AGNs clearly show that the inner radius of AGN tori scales as (e.g., Suganuma et al., 2006), which can be physically explained by dust sublimation by AGN irradiation. This means that tori in LLAGNs have a much smaller scale-height at the innermost radius compared with more luminous AGNs, in order to explain the observed small covering fraction (i.e., small ). The physical reason is not clear, in particular if it is ultimately related to the low mass-accretion rates or just a consequence of radiation effects. For a hydrostatic disk where the central gravity by the SMBH dominates over its self-gravity, the ratio between “thermal” energy (including kinetic energy of turbulent motion) and gravitational potential determines the height to radius ratio. For simplicity, let us assume that LLAGNs in the local universe have similar black hole masses as normal AGNs but their Eddington ratios are smaller. In fact, our objects have (see Section 1), which are small compared with a majority of Swift/BAT AGNs (Winter et al., 2009). Then, for the same thermal energy inside the torus, the ratio becomes smaller in LLAGNs, which could explain the observed trend. Further studies of a larger sample of LLAGNs covering a wide range of luminosity and Eddington ratio would be useful to confirm our results and to understand the origin.
References
- Anders & Grevesse (1989) Anders, E., & Grevesse, N. 1989, Geochim. Cosmochim. Acta, 53, 197
- Asmus et al. (2012) Asmus, D., Hönig, S. F., Gandhi, P., Smette, A., & Duschl, W. J. 2012, Journal of Physics Conference Series, 372, 012034
- Awaki et al. (2009) Awaki, H., Terashima, Y., Higaki, Y., & Fukazawa, Y. 2009, PASJ, 61, 317
- Baumgartner et al. (2012) Baumgartner, W. H., Tueller, J., Markwardt, C. B., et al. 2012, arXiv:1212.3336
- Beckman et al. (2009) Beckmann, V. et al. 2009, A&A, 505, 417
- Bottacini et al. (2012) Bottacini, E., Ajello, M., & Greiner, J. 2012, ApJS, 201, 34
- Brightman & Nandra (2011a) Brightman, M., & Nandra, K. 2011a, MNRAS, 413, 1206
- Brightman & Nandra (2011b) Brightman, M., & Nandra, K. 2011b, MNRAS, 414, 3084
- Burlon et al. (2011) Burlon, D., Ajello, M., Greiner, J., et al. 2011, ApJ, 728, 58
- Cappi et al. (2006) Cappi, M., Panessa, F., Bassani, L., et al. 2006, A&A, 446, 459
- Cardamone et al. (2007) Cardamone, C. N., Moran, E. C., & Kay, L. E. 2007, AJ, 134, 1263
- Dadina (2008) Dadina, M. 2008, A&A, 485, 417
- David et al. (1992) David, L. P., Jones, C., & Forman, W. 1992, ApJ, 388, 82
- Eguchi et al. (2011) Eguchi, S., Ueda, Y., Awaki, H., Aird, J., Terashima, Y., Mushotzky, R. 2011, ApJ, 729, 31
- Emmanoulopoulos et al. (2013) Emmanoulopoulos, D., Papadakis, I. E., Nicastro, F., & McHardy, I. M. 2013, MNRAS, in press
- Fabian et al. (1989) Fabian, A. C., Rees, M. J., Stella, L., & White, N. E. 1989, MNRAS, 238, 729
- Fisher & Drory (2008) Fisher, D. B., & Drory, N. 2008, AJ, 136, 773
- Fukazawa et al. (2009) Fukazawa, Y., Mizuno, T., Watanabe, S., et al. 2009, PASJ, 61, 17
- George & Fabian (1991) George, I. M., & Fabian, A. C. 1991, MNRAS, 249, 352
- Gruber et al. (1999) Gruber, D. E., Matteson, J. L., Peterson, L. E., & Jung, G. V. 1999, ApJ, 520, 124
- Gültekin et al. (2009) Gültekin, K., Richstone, D. O., Gebhardt, K., et al. 2009, ApJ, 698, 198
- Hasinger et al. (2005) Hasinger, G., Miyaji, T., & Schmidt, M. 2005, A&A, 441, 417
- Hasinger (2008) Hasinger, G., 2008, A&A, 490, 905
- Ho (2008) Ho, L. C. 2008, ARA&A, 46, 475
- Ho (2009) Ho, L. C. 2009, ApJ, 699, 626
- Ikeda et al. (2012) Ikeda, H., Nagao, T., Matsuoka, K., et al. 2012, ApJ, 756, 160
- Ikeda et al. (2009) Ikeda, S., Awaki, H., & Terashima, Y. 2009, ApJ, 692, 608
- Kalberla et al. (2005) Kalberla, P. M. W., Burton, W. B., Hartmann, D., et al. 2005, A&A, 440, 775
- Levenson et al. (2009) Levenson, N. A., Radomski, J. T., Packham, C., et al. 2009, ApJ, 703, 390
- Liu & Bregman (2005) Liu, J.-F., & Bregman, J. N. 2005, ApJS, 157, 59
- Maeda et al. (2008) Maeda, Y., et al. 2008, JX-ISAS-SUZAKU-MEMO-2008-06
- Magdziarz & Zdziarski (1995) Magdziarz, P., & Zdziarski, A. A. 1995, MNRAS, 273, 837
- Maiolino et al. (1998) Maiolino, R., Salvati, M., Bassani, L., et al. 1998, A&A, 338, 781
- Mitsuda et al. (2007) Mitsuda, K., Bautz, M., Inoue, H., et al. 2007, PASJ, 59, 1
- Murphy & Yaqoob (2009) Murphy, K. D., & Yaqoob, T. 2009, MNRAS, 397, 1549
- Nandra & Pounds (1994) Nandra, K. & Pounds, K. 1994, MNRAS, 268, 405
- Nandra et al. (2007) Nandra, K., O’Neill, P. M., George, I. M., & Reeves, J. N. 2007, MNRAS, 382, 194
- Nemmen et al. (2006) Nemmen, R. S., Storchi-Bergmann, T., Yuan, F., et al. 2006, ApJ, 643, 652
- Paturel et al. (2003) Paturel G., Petit C., Prugniel P., Theureau G., Rousseau J., Brouty M., Dubois P., Cambrésy L., 2003, A&A, 412, 45
- Ptak et al. (2004) Ptak, A., Terashima, Y., Ho, L. C., & Quataert, E. 2004, ApJ, 606, 173
- Quataert et al. (1999) Quataert, E., Di Matteo, T., Narayan, R., & Ho, L. C. 1999, ApJ, 525, L89
- Reynolds & Begelman (1997) Reynolds, C. S., & Begelman, M. C. 1997, ApJ, 488, 109
- Sandage & Bedke (1994) Sandage, A., & Bedke, J. 1994, The Carnegie Atlas of Galaxies. Volumes I, II., by Sandage, A.; Bedke, J.. Carnegie Institution of Washington Publ., No. 638,,
- Saxton et al. (2008) Saxton, R. D., Read, A. M., Esquej, P., et al. 2008, A&A, 480, 611
- Smith et al. (2001) Smith, R. K., Brickhouse, N. S., Liedahl, D. A., & Raymond, J. C. 2001, ApJ, 556, L91
- Suganuma et al. (2006) Suganuma, M., Yoshii, Y., Kobayashi, Y., et al. 2006, ApJ, 639, 46
- Tazaki et al. (2011) Tazaki, F., Ueda, Y., Terashima, Y., & Mushotzky, R. F. 2011, ApJ, 738, 70
- Tazaki et al. (2013) Tazaki, F., Ueda, Y., Terashima, Y., & Mushotzky, R. F., Tombesi, F. 2013, submitted to ApJ
- Terashima et al. (2002) Terashima, Y., Iyomoto, N., Ho, L. C., & Ptak, A. F. 2002, ApJS, 139, 1
- Theureau et al. (2007) Theureau, G., Hanski, M. O., Coudreau, N., Hallet, N., & Martin, J.-M. 2007, A&A, 465, 71
- Tüllmann et al. (2006) Tüllmann, R., Pietsch, W., Rossa, J., Breitschwerdt, D., & Dettmar, R.-J. 2006, A&A, 448, 43
- Turner et al. (1997) Turner, T. J., George, I. M., Nandra, K., & Mushotzky, R. F. 1997, ApJS, 113, 23
- Ueda et al. (2003) Ueda, Y., Akiyama, M., Ohta, K., & Miyaji, T. 2003, ApJ, 598, 886
- Vasudevan et al. (2009) Vasudevan, R. V., Mushotzky, R. F., Winter, L. M., & Fabian, A. C. 2009, MNRAS, 399, 1553
- Véron-Cetty & Véron (2006) Véron-Cetty, M.-P., & Véron, P. 2006, A&A, 455, 773
- Winter et al. (2009) Winter, L. M., Mushotzky, R. F., Reynolds, C. S., & Tueller, J. 2009, ApJ, 690, 1322