Distance matters: the impact of gene proximity in bacterial gene regulation
Abstract
Following recent discoveries of colocalization of downstream-regulating genes in living cells, the impact of the spatial distance between such genes on the kinetics of gene product formation is increasingly recognized. We here show from analytical and numerical analysis that the distance between a transcription factor (TF) gene and its target gene drastically affects the speed and reliability of transcriptional regulation in bacterial cells. For an explicit model system we develop a general theory for the interactions between a TF and a transcription unit. The observed variations in regulation efficiency are linked to the magnitude of the variation of the TF concentration peaks as a function of the binding site distance from the signal source. Our results support the role of rapid binding site search for gene colocalization and emphasize the role of local concentration differences.
pacs:
87.16.-b,87.10.-e,05.40.-aSuppose you live in a small town and start spreading a rumor. The time after which the rumor reaches a specific person depends on your mutual distance, either the physical distance due to word-of-mouth in the pre-telecommunications era or the topological distance in modern social networks kitsak . This distance dependence is immediately intuitive for random propagation in large systems. Conversely, diffusion of signaling molecules on the microscopic scales of biological cells was observed to be fast ElfLiXie , so one might assume that spatial aspects can be neglected. Yet recent studies strongly suggest that even in relatively small bacterial cells distances matter with respect to both speed and reliability of genetic regulation by DNA-binding proteins, so-called transcription factors (TFs) Kuhlman ; wunderlich . Thus, the distance-dependence of the search time of a given TF for its target binding site on a downstream gene was proposed to affect the ordering of genes on the DNA, in particular, promote gene colocalization, i.e., the tendency of genes interacting via TFs to be close together along the chromosome kolesov .
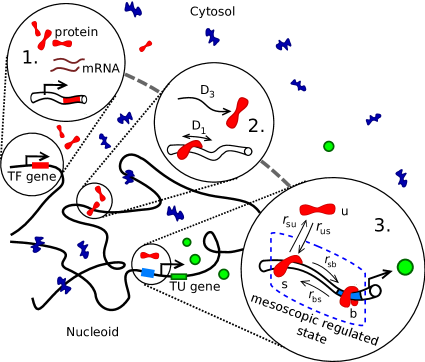
Transcriptional regulation, the change in gene transcription rate caused by binding of regulatory proteins such as TFs, is the most prominent form of gene regulation in bacteria Alberts . Since TFs are proteins themselves, their production consists of the inherently stochastic processes of transcription (conversion of the TF gene’s code to RNA) and translation (conversion of the RNA code to proteins). Although a certain averaging of noise occurs due to long protein lifetimes, the noise in the TF production propagates to downstream genes regulated by this TF EldarElowitz:2010 . The contributions of individual stochastic steps to the total noise in protein production (magnifying glass 1 in Fig. 1) were characterized Paulsson:2005 , and accurate theoretical models for TF-regulated expression exist in the case of known TF density at the regulatory site KeplerElston:2001 ; Friedman:2006 .
Recently, considerably effort has been invested on explaining the efficiency of transcriptional regulation, especially the remarkable measured speed at which TFs find their binding sites ElfLiXie ; elf ; gijs ; riggs . This speed is due to facilitated diffusion bvh ; mirny ; coppey ; bauer ; klenin ; marenduzzo ; koslover , in which free TF diffusion in three dimensions is interspersed by periods of one-dimensional sliding along the DNA (Fig. 1, magnifying glass 2). Facilitated diffusion of lac repressor molecules has indeed been observed in living E. coli cells elf . In this context, the colocalization hypothesis certainly makes sense: a shorter search time effects more efficient regulation wunderlich . Concurrently, the importance of increased local protein concentration due to binding to DNA, occurrence of multiple binding sites, formation of protein complexes, and cellular compartmentalization for prokaryotic and eukaryotic gene regulation has been emphasized Droge:2001 .
Here we show that high local TF concentrations due to gene proximity alone is sufficient for efficient gene regulation. Specifically, we extend the viewpoint of TF search time optimization due to colocalization to effects on the entire cascade of TF and TU gene expression, including the noise in TF production, facilitated diffusion of TF, and TF binding at TU by first binding non-specifically to the DNA and then sliding to its specific binding site (magnifying glass 3 in Fig. 1). To our knowledge, this is the first complete, quantitative approach including all relevant subprocesses in TF-mediated gene interaction.
The time-dependent intracellular concentration of a protein may be modeled by stationary shot-noise Friedman:2006 ; Berg:1978 , where is a compound Poisson process of protein production with combined transcription and translation rate , exponentially distributed translational burst sizes , of mean REM_BURST , and a combined degradation and dilution rate . is the (average) cell volume. The intermediate translation step is excluded because of short mRNA lifetimes. Under the typical fast mixing assumption of molecules in the cell, the number of proteins in a subdomain of relative volume , at given time , is therefore a Poisson random variable of intensity , with Laplace transform
| (1) | |||||
This is but the negative binomial distribution with parameters and . In particular, the mean and the variance of the number of proteins are
| (2) |
Bursty protein production (large ) clearly effects a greater variance than a simple Poissonian production of individual molecules. We note that the negative binomial distribution (1) has been previously found for the number of proteins in a two-stage model of stationary expression in the fast translation limit Shahrezaei:2008 .
To study the expression of a gene controlled by a constitutive TF, we expand the mathematical model in two ways: (i) we introduce a position dependent kernel in the shot noise , to include time delays in transcription, translation, protein folding, and, notably, facilitated diffusion of TFs to their target site. The coordinate is the point of observation, namely, a point in the neighborhood of the target site (blue operator near gene b in Fig. 1, 3). (ii) We allow a time-dependent transcription rate , such that the mean number of protein production events in a time interval equals . The corresponding, time-inhomogeneous compound Poisson process will be denoted by . In particular, the rate may be chosen to be a random process, to model fluctuations of the promoter Paulsson:2005 ; Kaufmann:2007 or operator state Zon:2006 , leading to transcriptional bursts Golding-So , see below. The resulting process reads . Moreover, following Berg Berg:1978 instead of a continuous exponential distribution, we will also include a discrete, geometric distribution for the burst sizes .
Even if the time evolution of the protein density is no longer Markovian, we can write down its Laplace transform because, for a given protocol , protein production is still a time-inhomogeneous Poisson process:
| (3) |
The corresponding formula for the protein number is obtained by substituting and . In particular, the average of the protein number and its variance can be immediately calculated from the Laplace transform, yielding
| (4a) | |||
| (4b) | |||
with . Eqs. (2) follow as a special case of (4a) and (4b) with a constant transcription rate, large burst size, and infinitely fast mixing of molecules in a homogeneous cell volume, i.e., .
Let us now consider the effect of a TF (here, a repressor) to the transcription rate of a transcription unit (TU) gene under control of the TF. We first assume a given density of unbound TF within the sliding distance along the DNA from the operator site, and study the local kinetics of the TF. We explicitly describe the local kinetics of the repressor molecules through facilitated diffusion bvh ; Zon:2006 near the binding site by considering three states of the operator (magnifying glass 3 in Fig. 1): transcription occurs at a constant rate whenever there is no repressor bound to the DNA at the target. Then, the repressor is either performing a local search by sliding in the vicinity of the target without binding to it specifically, or TF molecules, the mean number of which is determined by the given density, are just hovering in the surrounding space. The gene is considered silent when a repressor is bound at the operator. The linear Markov dynamics of TF binding can be explicitly solved by standard methods (see Supplementary Material (SM) sm ). For example, the stationary protein level is obtained by averaging over in Eq. (4a), but its variance will consist of three terms instead of the two in Eq. (4b) because of time correlations in the transcription rate .
Introducing the equilibrium constant for specific TF binding to the operator and assuming fast binding and unbinding, we integrate out the fast local search state in the three-state model.This leads to a simpler model with telegraph noise at the operator, i.e., the gene is either silent or being transcribed at some effective rate . The transitions between these two states occur without intermediates at rate from silent to active and vice versa with rate . Matching the stationary mean and the variance of the protein numbers in both processes, we relate the parameters of the telegraph model to the ones depicted in the magnifying glass 3 of Fig. 1 sm . This is the description of a mesoscopic repressed state discussed in Ref. Zon:2006 , where it is argued that this choice of retaining the completely silent state in the coarse-grained theory is justified by the separation of timescales in local search dynamics and RNA polymerase (RNAP) binding; the rebinding of repressor is extremely fast, thus leaving hardly any time for RNAP to intervene Zon:2006 . Of course, there exists another telegraph scenario that would leave the original transcription rate for the completely unbound state untouched, but would introduce an effective, leaky transcription rate for the combined repressed state consisting of nonspecifically and specifically bound states. This alternative scenario is certainly plausible. For example, the leaky expression of lac genes Yu:2006 , has been associated with DNA looping Choi:2008 . We do not consider this point further here.
We now address the interaction of TF and TU genes via repression and study the transient response of the TU gene to a change in the transcription rate of the TF gene when the latter is turned on at and then constitutively expressed. We study the dynamics of the moments of the TU gene transcription rate as functions of the distance between the genes. From simulated trajectories (Fig. S1 sm ) of suitably normalized repressor concentrations (see below) within a binding distance from the target and the resulting expression levels of the gene under control, the TF shows distinct concentration peaks for a pair of vicinal genes, and a fast decrement in expression level of the TU gene due to TF binding.
To analytically model the TF searching its binding site, we assume a linear dependence of the nonspecific binding rate on the repressor concentration near the target and introduce the equilibrium non-specific binding constant . If the basal rate, in absence of repressors, of expression of the TU gene is , the mean and variance of the transcription rate under repression become
| (5a) | |||
| (5b) | |||
| where we use the probability that the TU gene is actively transcribed at time when the gene-gene distance is , | |||
| (5c) | |||
As a typical example, is a tube surrounding the sliding region around the target. Its length is 34 nm (100 base pairs), its diameter is that of DNA (2.4 nm) plus 30 nm (e.g., the length of lac repressor is 14 nm). With Eq. (3),
| (6) |
where and . The lower limit of the inner integral can be set to zero in our scenario ().
Eq. (6) is a central result of this study. It is general and allows quantitative analyses of various transcriptional and translational repression scenarios in any cellular structure and geometry. In particular, it takes into account the transciptional pulsing Golding-So of the TU gene induced by the binding of the repressor. Eq. (6) even allows us to model RNAP binding and mRNA degradation by setting and introducing, as the TF production rate, a new stochastic process with a constant translation rate , and the number of transcripts given by an immigration-death process (equivalently an queue) with mRNA production rate and mRNA degradation rate . Since is of the same order as typical TF search times in E. coli ElfLiXie ; elf , inclusion of TF mRNA dynamics may be necessary in some cases. The scenario can be even further extended to include TF transcriptional pulsing by modulating the immigration-death process with telegraph noise Kaufmann:2007 . However, the expectation of Eq. (6) is yet to be solved for these Crawford . In the examples below, we use an approximation with a constant transcription and translation rate yielding on average 500 TF molecules per cell under stationary conditions. This number is in the ballpark of TF abundances for various levels of E. coli regulation networks Janga:2009 . Special cases with low and high TF abundances will be studied separately.
We assume the TF gene to be in the center of a spherical nucleoid and the TU gene at a radial distance from it. There is recent evidence Kuhlman that the spatial distribution of TFs is highly inhomogenous. TFs bind to the DNA nonspecifically, hence under many growth conditions the TF concentration is higher in the nucleoid than in the surrounding volume. Inhomogeneities were also observed to affect fold repression. We thus assume that the diffusion constant within the nucleoid is much smaller than in the surrounding cytosol due to crowding and nonspecific binding to the DNA (see SM sm for comparison with the model in Ref. Kuhlman ). The nucleoid is surrounded by the volume , where and are the cell and nucleoid volumes. The density is subject to the radial diffusion equation. In Eq. (6), obeys
| (7) |
with a dilution rate due to cell growth and with the condition that the TFs are initially uniformly distributed in the close vicinity (say, within a radius nm) of the TF gene. This is justified from the observed localization of transcripts near their transcription site in bacteria Llopis:2010 . The explicit solution of Eqs. (7) for our spherical geometry is CarslawJaeger:Book
| (8) | |||||
where , and , and the are the positive solutions of . Eq. (8) is our other central result.
Fig. 2 shows the probabilities (6) as function of time for short and long distances between the TF and TU genes. Accordingly, the distance impacts vastly the regulation efficiency: the response is significantly stronger and faster for short distances, this difference persisting for minutes. Fig. 2 also demonstrates that it is necessary to consider this exact expression instead of a mean field approximation obtained by taking expectations of the density separately in the numerator and denominator in Eq. (5c). The mean field approximation would overestimate the spatial differences in regulation. Therefore, it is of importance to use the exact formula (6) instead.
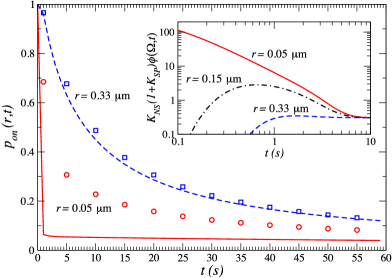
The inset of Fig. 2 shows the reason for the difference between exact and mean field approaches: as already suggested by the simulated trajectories in Fig. S1, the amplitude variation of the TF concentration contributing to nonspecific binding at the target depends heavily on the separation of TF and TU genes. The TU genes far away from the TF gene receive a more diluted signal than those close-by. Specifically, both Fig. S1 and the inset of Fig. 2 show , characterizing both the availability of TF and its binding affinity to the target. Its values should be compared to 1, the scale set by the first term in the exponential of Eq. (6). The truncation of the peak observed at short distances causes the mean field theory to fail. Note that smaller TF copy numbers than used here lead to a similar spatial effect in ; e.g., the same set of parameters but with a stationary mean number of 100 TFs leads to a roughly constant difference of the order between with and m in a window of 1 min. The magnitude of the effect depends naturally on the TF binding affinity at the target. Both the expression levels and binding specificity are known to depend on whether the TF is a local or global regulator Lozada-Chavez:2008 ; Janga:2009 .
With Eq. (5b), we assess the noise propagation in the TF-TU system, in particular, the variance of the transcription rate of the TU gene. Since the variances are proportional to the product , we see from Fig. 2 that they peak at a few seconds and at ten seconds for and m, respectively. The probability grows with distance to the TU gene, and the same hence applies to the variance after the initial transient peak. The total time-integrated variance is greater for the distant gene, and its transcription is therefore more susceptible to stochastic variation in TF production. However, the effect in Eq. (5b) is small for small , and the situation may be different under stationary conditions. Fig. 2 shows that the distance variation in expression levels in the long time limit can be small, even if the transient response shows considerable variation. The same applies to expression fluctuations. Experimental observations Salman-Taniguchi show that the protein level fluctuations are, in general, determined by the mean expression level, and are independent of system details. The dependence of protein number fluctuations on the TF-TU distance under stationary conditions needs to be explored further.
Concluding, we established a quantitative model for the distance dependence of gene regulation efficiency and stochasticity in bacteria. Intracellular structure and nonspecific binding to the DNA are taken into account in terms of an inhomogeneous diffusion rate. The binding at the target is facilitated by a local search process, which was modeled by an intermediate fast degree of freedom. Significant spatial effects in the regulation efficiency was demonstrated, strongly supporting the regulation hypothesis for gene colocalization. We note that more precise models, for instance, with multiple TFs sliding simultaneously near the target can be solved, as well. The expressions are more elaborate (except for infinite numbers) but the binding probabilities show roughly the same behavior as above. It will be of interest to compare transient response to internal and external signals, as the gene location is known to depend on the type of signal Janga:2007 .
We acknowledge funding from the Academy of Finland (FiDiPro scheme).
References
- (1) M. Kitsak, L. K. Gallos, S. Havlin, F. Liljeros, L. Muchnik, H. E. Stanley, and H. A. Makse, Nature Physics 6, 888 (2010); C. Castellano, S. Fortunato, and V. Loretto, Rev. Mod. Phys. 81, 591 (2009).
- (2) J. Elf, G.-W. Li, and X. S. Xie, Science 316, 1191 (2007);
- (3) T. E. Kuhlman and E. C. Cox, Mol. Syst. Biol. 8, 610 (2012).
- (4) Z. Wunderlich and L. A. Mirny, Nucleic Acids Res. 36, 3570 (2008).
- (5) B. Alberts , A. Johnson, J. Lewis, M. Raff, K. Roberts, and P Walter, Molecular Biology of the Cell, 5th ed., (Garland Science, New York, 2008).
- (6) G. Kolesov, Z. Wunderlich, O. N. Laikova, M. S. Gelfand, and L. A. Mirny, Proc. Natl. Acad. Sci. USA 104, 13948 (2007); M. di Stefano, A. Rosa, V. Belcastro, D. di Bernardo, and C. Micheletti, PLoS Comp. Biol. (at press).
- (7) A. Eldar and M. B. Elowitz, Nature 467, 167 (2010).
- (8) J. Paulsson, Phys. Life Rev. 2, 157 (2005). See also References therein.
- (9) T. B. Kepler and T. C. Elston, Biophys. J. 81, 3116 (2001).
- (10) N. Friedman, L. Cai, and X. S. Xie, Phys. Rev. Lett. 97, 168302 (2006).
- (11) O. G. Berg, J. Theor. Biol. 71, 587 (1978).
- (12) A translational burst refers to the number of times the transcripts (mRNA) are translated into proteins.
- (13) P. Hammar, P. Leroy, A. Mahmutovic, E. G. Marklund, O. G. Berg, and J. Elf, Science 336, 1595 (2012); X. S. Xie, P. J. Choi, G. Li, N. K. Lie, and G. Lia, Ann. Rev. Biophys. 37, 417 (2008).
- (14) B. van den Broek, M. A. Lomholt, S.-M. J. Kalisch, R. Metzler, and G. J. L. Wuite, Proc. Natl. Acad. Sci. USA 105, 15738 (2008)
- (15) A. D. Riggs, S. Bourgeois, and M. Cohn, J. Mol. Biol. 53, 401 (1970).
- (16) P. H. von Hippel and O. G. Berg, J. Biol. Chem. 264, 675 (1989).
- (17) L. Mirny, M. Slutsky, Z. Wunderlich, A. Tafvizi, J. Leith, and A. Kosmrlj, J. Phys. A 42, 434013 (2009); M. Sheinman, O. Bénichou, Y. Kafri, and R. Voituriez, Rep. Prog. Phys. 75, 026601 (2012).
- (18) M. Coppey, O. Bénichou, R. Voituriez, and M. Moreau, Biophys. J. 87, 1640 (2004); M. Slutsky and L. A. Mirny, Biophys. J. 87, 4021 (2004); T. Hu, A. Y. Grosberg, and B. I. Shklovskii, Biophys. J. 90, 2731 (2006); S. E. Halford and J. F. Marko, NucleicAcids Res. 32, 3040 (2004); A. B. Kolomeisky, Phys. Chem. Chem. Phys. 13, 2088 (2011).
- (19) M. Bauer and R. Metzler, Biophys. J. 102, 2321 (2012); J. Reingruber and D. Holcman, Phys. Rev. E 84, 020901 (2011).
- (20) K. V. Klenin, H. Merlitz, J. Langowski, and C. X. Wu, Phys. Rev. Lett. 96, 018104 (2006); M. Sheinman and Y. Kafri, Phys. Biol. 6, 0160033 (2009).
- (21) G. Foffano, D. Marenduzzo, and E. Orlandini, Phys. Rev. E 85, 021919 (2012); M. A. Lomholt, B. v. d. Broek, S.-M. J. Kalisch, G. J. L. Wuite, and R. Metzler, Proc. Natl. Acad. Sci. USA 106, 8204 (2009).
- (22) C. Loverdo, O. Bénichou, R. Voituriez, A. Biebricher, I. Bonnet, and P. Desbiolles, Phys. Rev. Lett. 102, 188101 (2009); Y. Meroz, I. Eliazar, and J. Klafter, J. Phys. A 42, 434012 (2009). E. F. Koslover, M. A. Diáz de la Rosa, and A. J. Spakowitz, Biophys J. 101, 856 (2011); C. A. Brackley, M. E. Cates, and D. Marenduzzo, Phys. Rev. Lett. 109, 168103 (2012); M. Bauer and R. Metzler, PLoS ONE 8, e53956 (2013).
- (23) P. Dröge and B. Müller-Hill, Bioessays 23, 179 (2001).
- (24) V. Shahrezaei and P. S. Swain, Proc. Natl. Acad. Sci. USA 105, 17256 (2008).
- (25) B. Kaufmann and A. van Oudenaarden, Curr. Opin. Genetics Dev. 17, 107 (2007).
- (26) J. S. van Zon, M. J Morelli, and P. R. ten Wolde, Biophys. J. 91, 4350 (2006).
- (27) I. Golding, J. Paulsson, S. M. Zawilski, and E. C. Cox, Cell 123, 1025 (2005); L.-h. So, A. Ghosh, C. Zong, L. A. Sepúvelda, R. Segev, and I. Golding, Nat. Genet. 43, 554 (2011).
- (28) Supplementary Material.
- (29) F. W. Crawford and M. A. Suchard, J. Math. Biol. 65, 553 (2012); F. W. Crawford, E-print arXiv:1301.1305. See also Refs. therein.
- (30) J. Yu, J. Xiao, X. Ren, K. Lao, and X. S. Xie, Science 311, 1600 (2006).
- (31) P. J. Choi, L. Cai, K. Frieda, and X. S. Xie, Science 322, 442 (2008).
- (32) H. S. Carslaw and J. C. Jaeger, Conduction of Heat in Solids, Oxford University Press, Oxford (1959).
- (33) P. M Llopis, A. F. Jackson, O. Sliusarenko, I. Surovtsev, J. Heinritz, T. Emonet, and C. Jacobs-Wagner, Nature 466, 77 (2010).
- (34) I. Lozada-Chávez, V. E. Angarica, J. Collado-Vides, and B. Contreras-Moreira, J. Mol Biol. 6, 627 (2008).
- (35) S. C. Janga, H. Salgado, and A. Martinez-Antonio, Nucleic. Acids Res. 37, 3680 (2009).
- (36) H. Salman, N. Brenner, C.-k. Tung, N. Elyahu, E. Stolovicki, L. Moore, A. Libchaber, and E. Braun, PRL 108, 238105 (2012); Y. Taniguchi, P. J. Choi, G.-W, Li, H. Chen, M. Babu, J. Hearn, A. Emili, X. S. Xie, Science 329, 533 (2010).
- (37) S. C. Janga, H. Salgado, J. Collado-Vides, and A. Martinez-Antonio, J. Mol. Biol. 368, 263 (2007).