The C-flame Quenching by Convective Boundary Mixing in Super-AGB Stars and the Formation of Hybrid C/O/Ne White Dwarfs and SN Progenitors
Abstract
After off-center C ignition in the cores of super-AGB stars the C flame propagates all the way down to the center, trailing behind it the C-shell convective zone, and thus building a degenerate ONe core. This standard picture is obtained in stellar evolution simulations if the bottom C-shell convection boundary is assumed to be a discontinuity associated with a strict interpretation of the Schwarzschild condition for convective instability. However, this boundary is prone to additional mixing processes, such as thermohaline convection and convective boundary mixing. Using hydrodynamic simulations we show that, contrary to previous results, thermohaline mixing is too inefficient to interfere with the C-flame propagation. However, even a small amount of convective boundary mixing removes the physical conditions required for the C-flame propagation all the way to the center. This result holds even if we allow for some turbulent heat transport in the CBM region. As a result, super AGB stars build in their interiors hybrid C-O-Ne degenerate cores composed of a relatively large CO core () surrounded by a thick ONe zone () with another thin CO layer above. If exposed by mass loss, these cores will become hybrid C-O-Ne white dwarfs. Otherwise, the ignition of C-rich material in the central core, surrounded by the thick ONe zone, may trigger a thermonuclear supernova explosion. The quenching of the C-flame may have implications for the ignition mechanism of SN Ia in the double-degenerate merger scenario.
1 Introduction
The evolution of a single star is determined by its initial chemical composition and mass. In this paper, we consider models of super asymptotic giant branch (SAGB) stars of compositions close to solar. By definition, the initial masses of SAGB stars have to be sufficiently high () to burn C in their hydrogen and helium exhausted cores, while being too low () to ignite neon afterwards (Garcia-Berro & Iben, 1994). The main products of C burning are oxygen and neon, therefore the SAGB stars build ONe degenerate cores in their interiors. What will eventually happen with the ONe core depends on the ratio of its growth rate and the stellar mass-loss rate (Poelarends et al., 2008). Like in their less massive AGB counterparts, the cores of SAGB stars can increase in mass because they are surrounded by H and He burning shells. The latter intermittently experiences thermal pulses, possibly followed by dredge-up, after having accumulated a certain amount of fresh He from the overlying H shell. One of the major uncertainties in the core growth rate comes from the poorly constrained depth of the He shell that is reached by the base of the surface convection zone immediately after a He thermal pulse, during the third dredge-up. The details of the cumulative core-growth depend on the convective boundary mixing assumptions for the bottom boundary of the convective envelope that may or may not trigger the third-dredge up. If the core mass reaches the Chandrasekhar limit before the star has lost its H-rich envelope then electron-capture reactions, starting on Mg and Ne, will trigger its collapse leading to an electron-capture supernova (Miyaji et al., 1980). Otherwise, an ONe white dwarf will be born (Pumo et al., 2009).
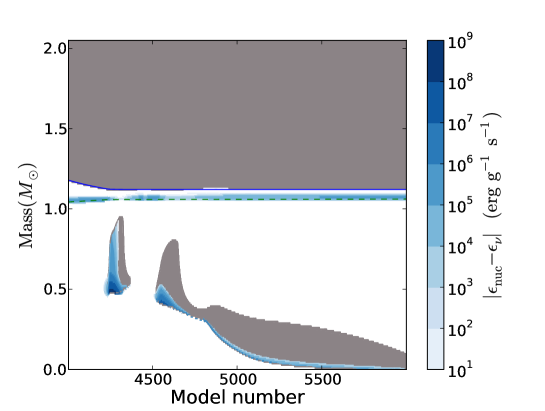
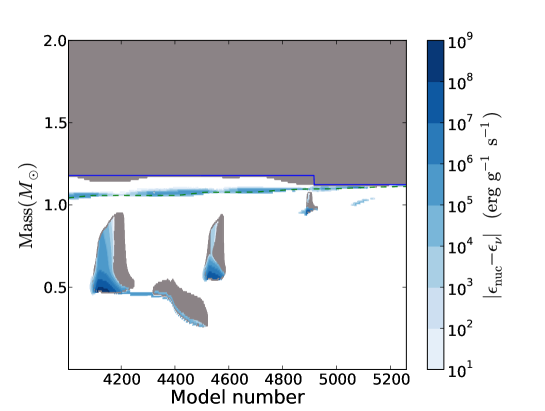
The neutrino energy losses in high-density CO degenerate cores, predominantly via the photo and plasma neutrinos, cause a temperature inversion with the maximum located some distance from the center. Therefore, just as the He-core flash, C burning in SAGB stars starts off-center if the initial mass is not too close to . Because of the degenerate conditions, the first episode of C ignition takes the form of a thermal flash that slightly reduces C abundance in the C-shell convective zone and eventually dies out. The following phase of C burning occurs near the bottom of the extinct convective zone under less degenerate conditions. This time, the C flame propagates all the way toward the center in the form of deflagration, pulling along the convective zone (Fig. 1). However, this is true only for the case when all other possible mixing processes, except convection operating within Schwarzschild boundaries, are neglected (Siess, 2006). The situation radically changes when thermohaline mixing is added below the bottom of the C-shell convective zone, where the mean molecular weight increases with the radius as a result of the off-center C burning. Siess (2009) has shown that the C flame stops propagating toward the center in this case because thermohaline mixing deprives the C-flame precursor of fuel. We can reproduce this behaviour (Fig. 2) when making the same assumption on the efficiency of thermohaline mixing (see below). In that case, by the end of C burning as much as 2 – 5% of unburnt C (in mass fraction) remains inside the ONe core which, according to Siess (2009), may modify its electron-capture induced collapse later on.
However, the efficiency of thermohaline mixing has been since investigated in more detail. When it starts, thermohaline mixing has a pattern of rising and sinking fluid parcels that resemble fingers. The latter are often called “salt fingers” because it is an unstable salinity distribution that causes their growth in the ocean. In one-dimensional computations, the efficiency of thermohaline mixing can be parameterized using the salt-finger aspect ratio , where and are finger’s length and diameter (Denissenkov, 2010). In his simulations, Siess (2009) has actually used a value of needed to explain the observed evolutionary declines of the surface C abundance and 12C/13C ratio in low-mass stars on the red giant branch (RGB) above the bump luminosity, as proposed by Charbonnel & Zahn (2007). However, the recent two- and three-dimensional numerical simulations of thermohaline convection in a low-mass RGB star have independently produced an estimate of (Denissenkov, 2010; Traxler et al., 2011; Denissenkov & Merryfield, 2011). We will show that this estimate is still valid for the CO cores of SAGB stars and that it renders thermohaline mixing too inefficient to prevent the C flame from reaching the center.
Does this leave us where we were before the work of Siess (2009)? Our answer is no, because another mixing process relevant to the convective C-shell burning in the cores of SAGB stars has yet to be accounted for. Indeed, it is known that at the boundaries of shell-flash convection, such as those in classical novae or in AGB stars, shear motion induced by convective flows and internal gravity waves lead to mixing beyond the Schwarzschild convective boundaries, in which the Kelvin-Helmholtz instability plays an important role (Glasner et al., 1997; Herwig et al., 2006; Casanova et al., 2011). The most relevant, because similar, case is such convective boundary mixing (hereafter, CBM) at the bottom of the He-shell flash (or pulse-driven) convection zone in AGB stars (e.g. Herwig et al., 1999; Miller Bertolami et al., 2006; Weiss & Ferguson, 2009). The consequences include larger and abundances in the intershell, in agreement with observations of H-deficient post-AGB stars (Werner & Herwig, 2006). We have included CBM in our simulations of C burning in the cores of SAGB stars using a prescription that is supported by the recent multi-dimensional hydrodynamic simulations of He-shell flash convection (Herwig et al., 2006, 2007). We have found that CBM, like thermohaline convection with and , forces the C flame to stop propagating toward the center. The main difference between the two mixing processes is that CBM is present only in the vicinity of convective boundaries, therefore C is left unburnt in the entire core below a narrow region adjacent to the bottom of the convective zone. This leads to a new evolutionary path in which the SAGB stars, at least those with the initial masses not too close to , build in their interiors degenerate cores composed of a relatively large CO core surrounded by a thick ONe zone with a thin CO layer on the top. Such hybrid C-O-Ne degenerate cores will behave differently when the C-rich material in their central parts, surrounded by thick ONe zones, eventually ignites, or when they become white dwarfs and begin cooling down.
In Section 2, we analyze the physics of C-flame propagation toward the center in the absence of extra mixing processes and identify its most important driving mechanism. In Section 3, we explain why this mechanism does not work when CBM is taken into account. In Section 4, we present the results of our hydrodynamic simulations of thermohaline convection in a region below the C-flame convection zone and apply them to simulate the C-flame propagation in an SAGB star. The effect of heat transport in the CBM algorithm is investigated in Section 5, while Section 6 contains discussion and conclusions.
2 The C-flame propagation in the absence of extra mixing
We have computed the evolution of a star with the initial mass and metallicity from the pre-main sequence to C ignition in its degenerate CO core using the state-of-the-art stellar evolution code of MESA revision 4631 (Paxton et al., 2011, 2013). Thus, our first SAGB model has the same initial parameters as the corresponding model of Siess (2006) with which we compare our results. We have used the MESA equation of state (EOS). It adopts the 2005 update of the OPAL EOS tables (Rogers & Nayfonov, 2002) supplemented for lower temperatures and densities by the SCVH EOS that accounts for partial dissociation and ionization caused by pressure and temperature (Saumon et al., 1995). Additionally, the HELM (Timmes & Swesty 2000) and PC (Potekhin & Chabrier, 2010) EOSs cover the regions where the first two EOSs are not applicable. There are smooth transitions between the four EOS tables. We have used the OPAL opacities (Iglesias & Rogers, 1993, 1996) supplemented by the low temperature opacities of Ferguson et al. (2005), and by the electron conduction opacities of Cassisi et al. (2007). The nuclear network consists of 31 isotopes from H to 28Si coupled by 60 reactions that account for H burning in pp chains, CNO-, NeNa-, and MgAl-cycles, as well as He, C, and Ne burning. By default, MESA uses reaction rates from Caughlan & Fowler (1988) and Angulo et al. (1999), with preference given to the second source (NACRE). It includes updates to the NACRE rates for 14N(p,O (Imbriani et al. 2005), the triple- reaction (Fynbo et al., 2005), 14NF (Görres et al., 2000), and 12CO (Kunz et al., 2002).
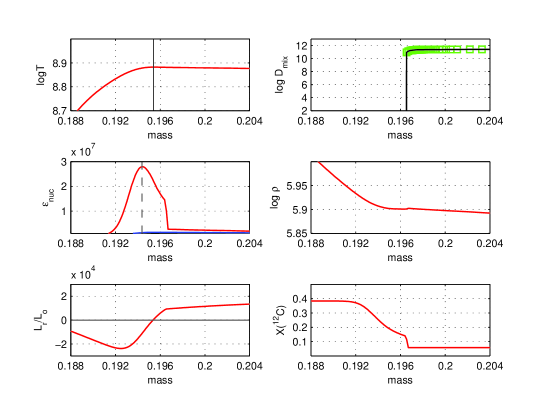
Fig. 3 shows profiles of various stellar structure variables at and near the bottom of the C-flame convection zone in the Schwarzschild-only convective boundary model 4900 from Fig. 1. Siess (2006) has demonstrated that, for the C flame to continue propagating all the way toward the center, the maximum of the nuclear energy generation rate should precede the maximum on the curve. The relative positions of the vertical solid and dashed lines in the upper- and middle-left panels in Fig. 3 confirm that this is true for our simulation. In this case, the energy of C burning released at the maximum of pre-heats plasma in front of the maximum of , thus facilitating its advancement. Siess (2006) has also noted that the location of the bottom of the C-flame convection zone is tightly bound with the location of the maximum of . Indeed, the former is determined by the Schwarzschild criterion, , where
| (1) |
and are the radiative and adiabatic temperature gradients (logarithmic and with respect to pressure), is the opacity, other quantities having their usual meanings. Given that at the location of the maximum of because there, the Schwarzschild criterion is satisfied at some small distance above it, where
| (2) |
The increase of the luminosity from its zero value at the point , where , to its critical value at the convective boundary at , where , is provided by the generation of C-burning nuclear energy in this mass interval,
| (3) |
For the maximum of to precede that of , the derivative must be negative immediately below , where is decreasing (, while should be increasing () with depth (the upper- and middle-left panels in Fig. 3). For C burning at , its energy generation rate can be approximated as , where . Therefore,
| (4) |
From the last equation, it is seen that, in order to get , the other two derivatives have to be negative with relatively large absolute magnitudes to compensate the positive term . A numerical evaluation of the derivatives on the right-hand side of this equation for the profiles presented in Fig. 3 gives the following estimates: and . Therefore, we conclude that it is the steep rise of the mass fraction in the direction toward the center immediately below the point (the lower-right panel in Fig. 3) that secures and maintains the required relative positions of the maxima of and in the model without extra mixing processes. In such a case, the C flame propagates all the way down to the center and, as a result, an ONe degenerate core is formed.
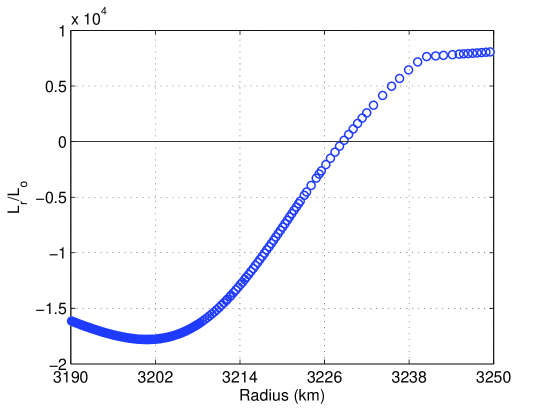
Timmes et al. (1994) have pointed out that a physically consistent simulation of the C flame requires a very fine spatial resolution with mass zones thinner than km in the burning region. To comply with this requirement, Siess (2006) used as many as grid points to describe the precursor flame between the bottom of the C-shell convection zone and the minimum in the luminosity profile below it. In our simulations of the C-flame propagation, the resolution in the region of the C-flame precursor is even better (Fig. 5). Here, we have more than 100 mass zones separated by distances less than 1 km. Moreover, our calculated C-flame speed is in a very good agreement with the value of interpolated from Tables 1 and 2 of Timmes et al. (1994) using the bounding values of and from the model shown in Fig. 5. Note that in our model increases from to in the region of the C-flame precursor, and Timmes et al. (1994) assumed the initial abundances and in their Tables 1 and 2.
3 The C-flame propagation in the presence of CBM
In our one-dimensional simulations of CBM, we use a MESA standard option that allows to take this mixing into account as a diffusion process. The corresponding diffusion coefficient in radiative layers adjacent to a convective boundary is
| (5) |
where is the pressure scale height and is a convective diffusion coefficient calculated using a mixing-length theory (MLT). The MESA mlt module assumes that , where is the mixing length (we used the value of ) and is the convective velocity. The radius is located at the distance from the Schwarzschild boundary inside the convective zone. The free parameter should be calibrated through observations, or through hydrodynamic simulations. The exponentially decaying diffusion coefficient (5) has succesfully been used to model CBM at the bottom of the He-shell flash convection zone in AGB stars (Herwig et al., 1999) and, more recently, to simulate the interface mixing between a white dwarf and its accreted H-rich enevelope during thermonuclear runaway of CO nova (Denissenkov et al., 2013). In the first case, using a value of produced larger 12C and 16O intershell abundances that were in a better agreement with those observed in the H-deficient post-AGB stars (Werner & Herwig, 2006), while in the second case resulted in the heavy-element enrichment of nova envelope comparable to those found in multi-dimensional hydrodynamic simulations as well as to the spectroscopic measurements of in nova ejecta. For more information on our motivation to use prescription (5) and on the choice of appropriate values of for specific cases, the interested reader is referred to the work of Denissenkov et al. (2013).
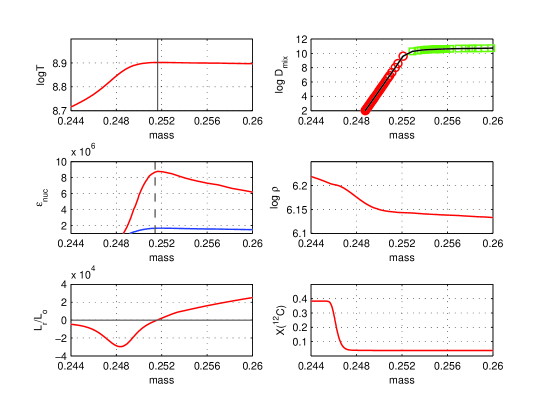
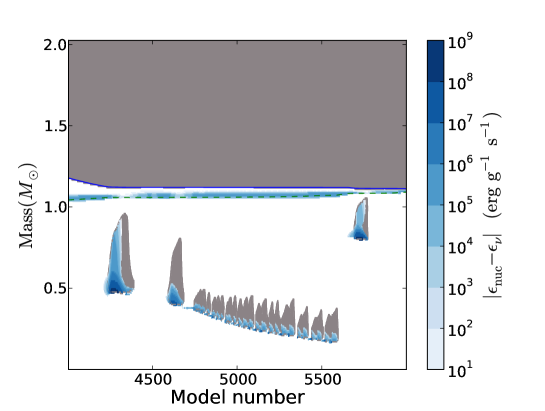
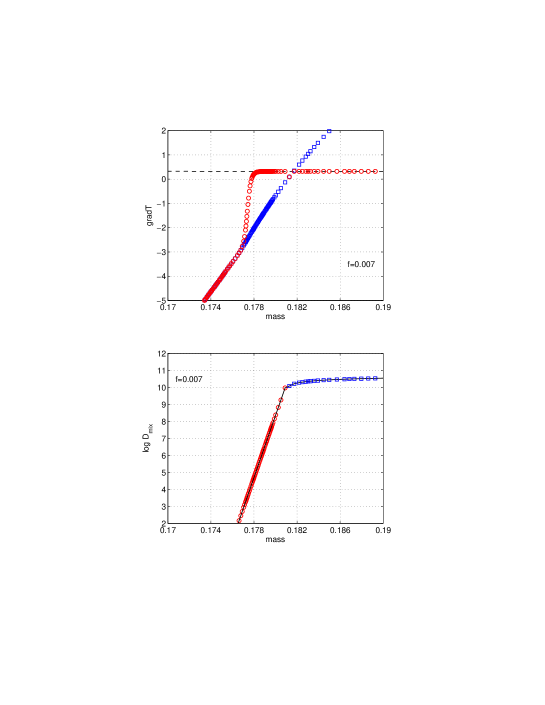
Fig. 4 shows the same profiles as Fig. 3, but for the case when CBM with has been included in our computations. The location of the bottom of the C-shell convective zone is still tightly bound to that of the maximum, as explained in the previous section, but now CBM penetrates into the convectively stable layers below and homogenizes the distribution, making it almost flat, in these layers. As a result, the steep rise of is moved away from , therefore a decrease of immediately below this point cannot be compensated by a sufficiently strong increase of the 12C mass fraction necessary to place the maximum of at a sufficient distance in front of the maximum of . In this situation, C ignites on the inner slope of its profile left from the preceding phase of convective C burning but, instead of advancing toward the center, the C flame is quenched soon after its ignition, when the C abundance is decreasing in the narrowing convective zone. Fig. 4 gives a snapshot of such a moment of the C-flame quenching. Although the maximum of is located slightly below in this figure, this is simply because of the fact that the plasma has not cooled down here yet after the C flame has passed through it. Therefore, the profile is flatter immediately below its maximum in this figure than in Fig. 3, and for nearly constant and even a small increment of with depth increases . The described phase of C ignition followed by the C-flame quenching is repeated many times (Fig. 6) until the C abundance behind the C flame is reduced to a such low level that its further ignition becomes impossible. In the end, the C-shell burning with CBM leaves an unburnt CO core (), and the final outcomer is a hybrid C-O-Ne degenerate core (Fig. 6).
4 Thermohaline mixing in the CO cores of SAGB stars
Thermohaline mixing develops in situations when the temperature distribution is convectively stable but the distribution of chemical composition is unstable, provided that heat diffuses faster than the destabilizing chemical component. This can occur in the ocean when warm salty water lies on top of cold fresh water (Stern, 1960; Kunze, 2003) and in stellar radiative zones when the mean molecular weight increases with the radius (e.g. Ulrich, 1972; Denissenkov, 2010). In the oceanic case, thermohaline mixing usually takes the form of vertically elongated fluid parcels that are called “salt fingers”.
For the stellar case, a linear stability analysis gives the following estimate for a thermohaline diffusion coefficient:
| (6) |
where (Denissenkov, 2010). Unfortunately, it is proportional to the square of the aspect ratio, , that measures the ratio of the finger’s length and diameter. In his work on the C-flame quenching by thermohaline mixing Siess (2009) used the diffusion coefficient (6) with corresponding to because that value was known to reproduce the evolutionary decline of the surface C abundance in low-mass red giants above the bump luminosity (Charbonnel & Zahn, 2007). However, the two- and three-dimensional numerical simulations of the 3He-driven thermohaline mixing that Charbonnel & Zahn (2007) proposed to lead to the observed C anomaly all resulted in (Denissenkov, 2010; Denissenkov & Merryfield, 2011; Traxler et al., 2011). Denissenkov (2010) has explained the low values by the very low viscosity in the radiative zones of RGB stars which facilitates the development of secondary shear instabilities that destroy salt fingers (Radko, 2010).
The linear-theory expression (6) is valid only for an ideal gas, which is a good approximation for the H-shell burning in an RGB star. However, the C burning in the cores of SAGB stars occurs under degenerate conditions, in which case the diffusion coefficient (6) has to be multiplied by the ratio , where and (e.g., Charbonnel & Zahn, 2007). In the CO cores of SAGB stars, the radiation pressure contributes only a few percent to the total one, therefore it can be neglected. On the other hand, the pressure of the electron-degenerate gas exceeds that of the nearly ideal gas of ions by a factor of immediately below the C flame and by as much as an order of magnitude in the center. When the electron degeneracy increases, the dependence of on weakens. However, retains a dependence on and similar to that for the ideal gas: , where , the second term on the right-hand side, the inverse atomic mass averaged over the distribution of isotopes in mass fractions, representing less than 16% of the first term in the CO cores. Under the circumstances, we expect that will remain close to one, while will become very small. Indeed, from the MESA EOS it follows that decreases from to between the C flame and the center.
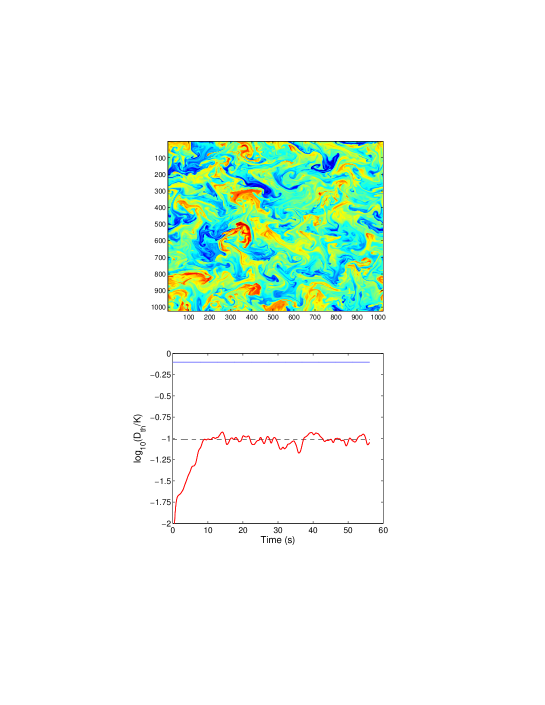
Traxler et al. (2011) and Denissenkov & Merryfield (2011) have shown that 2D and 3D numerical simulations of thermohaline convection for the RGB case give almost identical estimates of the diffusion coefficient. Therefore, we present here only the results of 2D numerical simulations of thermohaline convection in the CO core of our solar-metallicity SAGB model star for parameters extracted from a radiative layer immediately below the C flame. When comparing the simulation parameters for the RGB and CO-core cases, the biggest difference is the one between the values of the density ratio , which are 1700 and 25, respectively. In the CO-core case, the smaller value of is caused by the much larger absolute magnitude of the -gradient and also by . We have used the same code and resolution as in the work of Denissenkov (2010), to which the interested reader is referred for details. The results are presented in Fig. 8, where the red curve in the lower panel plots the ratio estimated from the numerical simulations, while the dashed black and solid blue lines show the same ratio from Eq. (6) calculated for and .
Fig. 8 shows that the 2D thermohaline diffusion coefficient in the CO core is very well approximated by the linear-theory one with , much like in the RGB case. In our computations of the C-shell convection we have used the values of and . The first value is taken a little larger than the one predicted by our numerical simulations to partly compensate for the decrease of with depth. The second value is needed, according to our MESA calculations, to reproduce the evolutionary decline of the surface C abundance above the bump luminosity in the metal-poor field and globular-cluster red giants (e.g., Gratton et al., 2000; Shetrone et al., 2010), assuming that the observed pattern is produced by the 3He-driven thermohaline convection. Note that the uncertainty factor used by Charbonnel & Zahn (2007) for this purpose is equivalent to . When we insert into Eq. (6), we obtain the results similar to those of Siess (2009). In this case, as well as in the case of , the C flame stops propagating toward the center by the reason explained in that paper. The main difference with the CBM case is that the C flame does not die out soon after being stopped because its life is supported by the fuel from the underlying CO core supplied by thermohaline convection, which is not depicted in Fig. 2. As a result, only a few percent of C is left unburnt inside the formed ONe core. On the contrary, in the case with CBM, the C burning leaves a completely untouched CO core below the final position of the quenched C-flame (Fig. 6). Finally, when we use the finger aspect ratio that is close to derived from our hydrodynamic simulations111We take a larger to partly compensate the factor absent in Eq. (6)., thermohaline mixing becomes so inefficient that it does not interfere with the C-flame propagation toward the center (Fig. 7).
5 Accounting for CBM heat transport
In deep stellar interiors, the large convective efficiency, , renders the temperature gradient almost adiabatic in convective zones, , while remains close to in radiative zones. However, this is true only if there are no other mixing processes in the radiative zones, or if such extra mixing is present, but it cannot compete with radiation and conduction in heat transport. From the mixing length theory (MLT, e.g. Weiss et al., 2004), we estimate , where is a diffusion coefficient describing heat transport by extra mixing, and is the thermal diffusivity. For a given value of , the MLT gives , where
| (7) |
In the above equations, and are factors of the order of one that depend on the geometry of fluid elements.
In the case of thermohaline convection, considered in Section 4, our hydrodynamic simulations give which results in . Therefore, thermohaline convection should not affect the temperature profile below the C-shell convective zone. On the contrary, if the prescription (5) is used to also estimate a diffusion coefficient for CBM heat transport then it will obviously modify immediately below the C-shell convection zone. This non-radiative CBM will make almost adiabatic in the vicinity of the convective boundary, where , but it will restore its radiative value at a larger distance, where the exponential factor reduces below the thermal diffusivity.
To see how strongly non-radiative CBM may affect the C-flame propagation, we have computed the evolution of a star with from the main sequence to the C ignition. To produce a more realistic SAGB model, we have included CBM across the boundaries of the H and He convective cores and across the bottom of the surface convection zone. For these CBM processes, we have used Eq. (5) with the value of that is close to the one constrained by fitting the terminal-age main sequence for a large number of stellar clusters and associations (Herwig, 2000). In the case when CBM is included at all evolutionary phases, both the lower and upper limits for the initial masses of SAGB stars shift to lower values. To simulate the C-flame propagation with CBM in the CO core of this SAGB model, we have used the same value of , as in our model. The CBM heat transport at each convective boundary has been modeled using the above MLT equations, some of which are already incorporated into MESA, while others can easily be added. For the fluid element geometry, we have assumed the following parameters: and (Weiss et al., 2004).
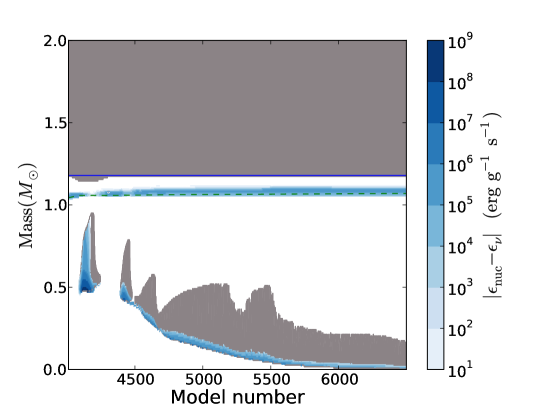
Fig. 9 shows the modification of the temperature gradient immediately below the C-shell convection zone produced by the CBM heat transport with the diffusion coefficient shown in the lower panel. The change of the temperature stratification occurs only in the immediate vicinity of the convective boundary because of the short length scale of the exponential decay of . Our computations show that this does not prevent the C-flame quenching, and again in this case an unburnt CO core remains in the center (Fig. 10).
6 Discussion and conclusions
We have obtained the following two main results:
-
1.
Convective boundary mixing (CBM) creates conditions in which the C-flame is inhibited from propagating toward the center in the CO cores of SAGB stars.
-
2.
Thermohaline mixing driven by the mean molecular weight inversion caused by the off-center C burning does not affect the C-flame inward propagation when one uses a thermohaline diffusion coefficient estimated via hydrodynamic simulations.
6.1 Implications for supernova and white dwarf models
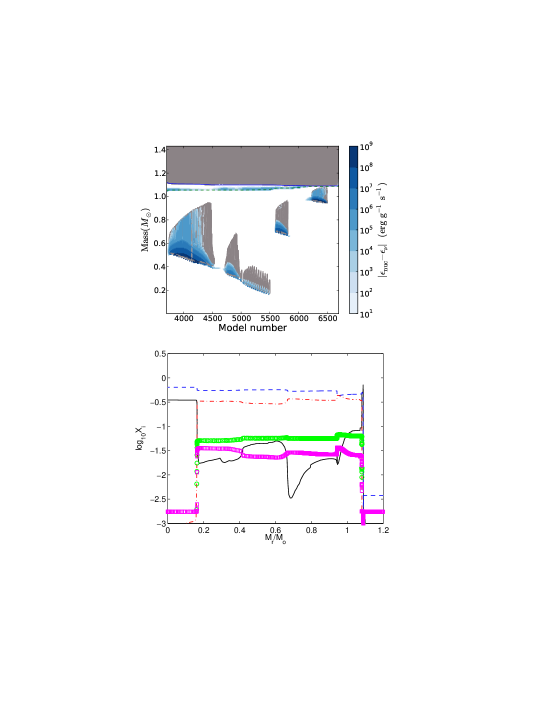
SAGB stars with off-center C ignition develop hybrid C-O-Ne degenerate cores in their interiors, rather than ONe cores, because the quenched C flame leaves an unburnt CO core () in the center, which is surrounded by a thick ONe zone ( by the end of C burning). The mass of the unburnt core depends not only on the CBM assumptions, but also on the initial mass as well as on the + reaction rate. We have carried out a parameter study in which we varied the initial mass, the value in Eq. (5), and the + reaction rate to see how those variations affected the masses and chemical structures (pure CO, ONe, or hybrid C-O-Ne compositions) of the degenerate cores of SAGB stars (Chen et al., in prep.). It shows that the unburnt CO mass in the hybrid core can be as large as for different parameters. In addition, in some hybrid models not only the unburnt core but also the outer C-shell burning layers contain varying amounts of . In Fig. 10 we show the abundance profiles after the C-flame has quenched for the case with the heat-transport CBM model. The C-shell experienced some intermittent burning which has led to abundances in the remaining ONe layer between and in the inner region (). Throughout the core the electron fraction remains in a narrow range .
The hybrid cores may have peculiar properties, compared to CO and ONe cores, when they evolve subsequently toward a supernova explosion through one of several possible channels. If an SAGB star with hybrid core were able to increase the core mass to the Chandrasekhar limit during the thermal pulse phase (the conditions under which this is possible for SAGB stars, according to the analysis of models without CBM explored by Poelarends et al. (2008), apply equally to SAGB stars with hybrid cores) this could result in a single-star thermonuclear supernova.
If the remaining C in hybrid cores were indeed sufficient to ignite a thermonuclear supernova this would have implications for the SN Ia progenitor models. In the single-degenerate scenario the mass range of potential progenitors would increase to include those SAGB stars that generate hybrid cores. This would decrease the minimum delay time of the appearance of the first SN Ia after a star formation burst. It would also provide a larger pool of progenitor initial masses. Since hybrid cores have larger masses than CO cores, less mass has to be accreted to reach the Chandrasekhar mass, compared to model predictions without CBM.
For the double-degenerate scenario we may expect that the ignition of a C-shell during the merger process may similarly not lead to complete burning of the core of the primary because in this case the C-flame may also be quenched.
If an SAGB star loses its H-rich envelope before its degenerate core reaches the Chandrasekhar limit, then a hybrid C-O-Ne WD will result. Due to the different internal composition, the cooling-down time scale may be different compared to CO and ONe models. This should be taken into account when using a WD luminosity function as an age indicator (Garcia-Berro et al., 1997).
6.2 Uncertainties
Our main result seems to be robust, at least in the framework of one-dimensional simulations. Indeed, the properties of CBM in environments similar to those at the bottom of the C-shell convective zone have independently been inferred for the nova case and for He-shell flash convection in AGB stars, based on both observational data and results of multi-dimensional hydrodynamic simulations (Werner & Herwig, 2006; Herwig et al., 2006, 2007; Gehrz et al., 1998; Glasner et al., 1997; Herwig et al., 2006; Casanova et al., 2011).
Furthermore, we have considered three different values, namely , , and , for the parameter in Eq. (5), and found the C-flame quenching in all the cases. We have also tried an experimental two-zone model of CBM that was motivated by hydrodynamic simulations (Herwig et al., 2007). The C-flame behaviour is still very similar to that obtained with Eq. (5).
Including CBM during the SAGB progenitor evolution does not change the results. We have simulated non-radiative CBM (i.e. accounting for heat transport in the CBM zone) at the boundaries of the H and He convective cores and at the bottom of the surface convection zone using Eq. (5) with the value of that is close to the one constrained by fitting the terminal-age main sequence for a large number of stellar clusters and associations (Herwig, 2000). In this case, both the lower and upper limits, and , for the initial masses of SAGB stars shift to lower values (Poelarends et al., 2008). In particular, the evolution of a model star with and CBM at the boundaries of its H and He convective cores ends up with a hybrid C-O-Ne degenerate core very similar to that in our model star with in which such CBM was not taken into account.
The inclusion of heat transport in the CBM does not have a significant effect on the pre-SAGB evolution compared to CBM without heat transport. Likewise, adding heat-transport to CBM at convective boundaries does not prevent the C-flame quenching, and also in this case an unburnt CO core remains inside the SAGB star.
We believe that we have explored all possible effects concerning species and heat transport by CBM at convective boundaries for two types of mixing, dynamically induced CBM and secular thermohaline mixing. However, our investigation is inherently limited by the assumption of spherical symmetry. The dynamic-timescale mixing processes discussed here can not be simulated ab-initio in one-dimensional simulations, but are only approximated with simple models. It would be important to explore the implications of hybrid white dwarfs for the question of how the progenitors of low-mass supernova, especially those of type Ia, evolve. If the hybrid nature of super-AGB cores is found to be an important ingredient of promising progenitor scenarios it would be necessary to further investigate the physics of the C flame with realistic three-dimensional hydrodynamic convection and nuclear burning simulations.
References
- Angulo et al. (1999) Angulo, C., Arnould, M., Rayet, M., & et al.,. 1999, Nuclear Physics A, 656, 3
- Casanova et al. (2011) Casanova, J., José, J., García-Berro, E., Shore, S. N., & Calder, A. C. 2011, Nature, 478, 490
- Cassisi et al. (2007) Cassisi, S., Potekhin, A. Y., Pietrinferni, A., Catelan, M., & Salaris, M. 2007, ApJ, 661, 1094
- Caughlan & Fowler (1988) Caughlan, G. R. & Fowler, W. A. 1988, Atomic Data and Nuclear Data Tables, 40, 283
- Charbonnel & Zahn (2007) Charbonnel, C. & Zahn, J.-P. 2007, A&A, 467, L15
- Denissenkov (2010) Denissenkov, P. A. 2010, ApJ, 723, 563
- Denissenkov et al. (2013) Denissenkov, P. A., Herwig, F., Bildsten, L., & Paxton, B. 2013, ApJ, 762, 8
- Denissenkov & Merryfield (2011) Denissenkov, P. A. & Merryfield, W. J. 2011, ApJ, 727, L8
- Ferguson et al. (2005) Ferguson, J. W., Alexander, D. R., Allard, F., Barman, T., Bodnarik, J. G., Hauschildt, P. H., Heffner-Wong, A., & Tamanai, A. 2005, ApJ, 623, 585
- Fynbo et al. (2005) Fynbo, H. O. U., Diget, C. A., Bergmann, U. C., et al.,, & ISOLDE Collaboration,. 2005, Nature, 433, 136
- Garcia-Berro & Iben (1994) Garcia-Berro, E. & Iben, I. 1994, ApJ, 434, 306
- Garcia-Berro et al. (1997) Garcia-Berro, E., Isern, J., & Hernanz, M. 1997, MNRAS, 289, 973
- Gehrz et al. (1998) Gehrz, R. D., Truran, J. W., Williams, R. E., & Starrfield, S. 1998, PASP, 110, 3
- Glasner et al. (1997) Glasner, S. A., Livne, E., & Truran, J. W. 1997, ApJ, 475, 754
- Görres et al. (2000) Görres, J., Arlandini, C., Giesen, U., Heil, M., Käppeler, F., Leiste, H., Stech, E., & Wiescher, M. 2000, Phys. Rev. C, 62, 055801
- Gratton et al. (2000) Gratton, R. G., Sneden, C., Carretta, E., & Bragaglia, A. 2000, A&A, 354, 169
- Herwig (2000) Herwig, F. 2000, A&A, 360, 952
- Herwig et al. (1999) Herwig, F., Blöcker, T., Langer, N., & Driebe, T. 1999, A&A, 349, L5
- Herwig et al. (2007) Herwig, F., Freytag, B., Fuchs, T., Hansen, J. P., Hueckstaedt, R. M., Porter, D. H., Timmes, F. X., & Woodward, P. R. 2007, in Astronomical Society of the Pacific Conference Series, Vol. 378, Why Galaxies Care About AGB Stars: Their Importance as Actors and Probes, ed. F. Kerschbaum, C. Charbonnel, & R. F. Wing, 43
- Herwig et al. (2006) Herwig, F., Freytag, B., Hueckstaedt, R. M., & Timmes, F. X. 2006, ApJ, 642, 1057
- Iglesias & Rogers (1993) Iglesias, C. A. & Rogers, F. J. 1993, ApJ, 412, 752
- Iglesias & Rogers (1996) —. 1996, ApJ, 464, 943
- Imbriani et al. (2005) Imbriani, G., Costantini, H., Formicola, A., & et al.,. 2005, European Physical Journal A, 25, 455
- Kunz et al. (2002) Kunz, R., Fey, M., Jaeger, M., Mayer, A., Hammer, J. W., Staudt, G., Harissopulos, S., & Paradellis, T. 2002, ApJ, 567, 643
- Kunze (2003) Kunze, E. 2003, Progress in Oceanography, 56, 399
- Miller Bertolami et al. (2006) Miller Bertolami, M. M., Althaus, L. G., Serenelli, A. M., & Panei, J. A. 2006, A&A, 449, 313
- Miyaji et al. (1980) Miyaji, S., Nomoto, K., Yokoi, K., & Sugimoto, D. 1980, PASJ, 32, 303
- Paxton et al. (2011) Paxton, B., Bildsten, L., Dotter, A., Herwig, F., Lesaffre, P., & Timmes, F. 2011, ApJS, 192, 3
- Paxton et al. (2013) Paxton, B., Cantiello, M., Arras, P., Bildsten, L., Brown, E. F., Dotter, A., Mankovich, C., Montgomery, M. H., Stello, D., Timmes, F. X., & Townsend, R. 2013, ArXiv e-prints
- Poelarends et al. (2008) Poelarends, A. J. T., Herwig, F., Langer, N., & Heger, A. 2008, ApJ, 675, 614
- Potekhin & Chabrier (2010) Potekhin, A. Y. & Chabrier, G. 2010, Contributions to Plasma Physics, 50, 82
- Pumo et al. (2009) Pumo, M. L., Turatto, M., Botticella, M. T., Pastorello, A., Valenti, S., Zampieri, L., Benetti, S., Cappellaro, E., & Patat, F. 2009, ApJ, 705, L138
- Radko (2010) Radko, T. 2010, Journal of Fluid Mechanics, 645, 121
- Rogers & Nayfonov (2002) Rogers, F. J. & Nayfonov, A. 2002, ApJ, 576, 1064
- Saumon et al. (1995) Saumon, D., Chabrier, G., & van Horn, H. M. 1995, ApJS, 99, 713
- Shetrone et al. (2010) Shetrone, M., Martell, S. L., Wilkerson, R., Adams, J., Siegel, M. H., Smith, G. H., & Bond, H. E. 2010, AJ, 140, 1119
- Siess (2006) Siess, L. 2006, A&A, 448, 717
- Siess (2009) —. 2009, A&A, 497, 463
- Stern (1960) Stern, M. E. 1960, Tellus, 12, 172
- Timmes & Swesty (2000) Timmes, F. X. & Swesty, F. D. 2000, ApJS, 126, 501
- Timmes et al. (1994) Timmes, F. X., Woosley, S. E., & Taam, R. E. 1994, ApJ, 420, 348
- Traxler et al. (2011) Traxler, A., Garaud, P., & Stellmach, S. 2011, ApJ, 728, L29
- Ulrich (1972) Ulrich, R. K. 1972, ApJ, 172, 165
- Weiss & Ferguson (2009) Weiss, A. & Ferguson, J. W. 2009, A&A, 508, 1343
- Weiss et al. (2004) Weiss, A., Hillebrandt, W., Thomas, H.-C., & Ritter, H. 2004, Cox and Giuli’s Principles of Stellar Structure
- Werner & Herwig (2006) Werner, K. & Herwig, F. 2006, PASP, 118, 183