New search for correlated pairs in the decay of 241Am
R. Bernabei1,2, P. Belli1,2, F. Cappella3,4, V. Caracciolo5, S. Castellano5, R. Cerulli5, C.J. Dai6, A. d’Angelo3,4, A. Di Marco1,2, H.L. He6, A. Incicchitti3,4, M. Laubenstein5, X.H. Ma6, F. Montecchia1,7, X.D. Sheng6, V.I. Tretyak8, R.G. Wang6, Z.P. Ye6,9
1INFN sezione Roma “Tor Vergata”, I-00133 Rome, Italy
2Dipartimento di Fisica, Università di Roma “Tor Vergata”, I-00133 Rome, Italy
3INFN sezione Roma, I-00185 Rome, Italy
4Dipartimento di Fisica, Università di Roma “La Sapienza”, I-00185 Rome, Italy
5INFN, Laboratori Nazionali del Gran Sasso, I-67100 Assergi (AQ), Italy
6IHEP, Chinese Academy, P.O. Box 918/3, Beijing 100039, China
7Dipartimento di Ingegneria Civile e Ingegneria Informatica, Università di Roma “Tor Vergata”, Italy
8Institute for Nuclear Research, MSP 03680 Kyiv, Ukraine
9University of Jing Gangshan, Jiangxi, China
Abstract
A new search for production of correlated pairs in the decay of 241Am has been carried out deep underground at the Gran Sasso National Laboratory of the I.N.F.N. by using pairs of NaI(Tl) detectors of the DAMA/LIBRA set-up. The experimental data show an excess of double coincidences of events with energy around 511 keV in faced pairs of detectors, which are not explained by known side reactions. This measured excess gives a relative activity for the Internal Pair Production (IPP) with respect to alpha decay of 241Am; this value is of the same order of magnitude as previous determinations. In a conservative approach the upper limit (90% C.L.) can be derived. It is worth noting that this is the first result on IPP obtained in an underground experiment, and that the value obtained in the present work is independent on the live-time estimate.
PACS: 23.20.Ra, Internal pair production – 27.90.+b, – 23.60.+e, Alpha decay – 29.40.Mc, Scintillation detectors
1 Introduction
In the seventies experimental and theoretical investigations of weak interactions in nuclei suggested the presence of various electromagnetic phenomena, which modify the basic decay processes. In the conventional perturbation treatment of the weak interactions these phenomena are attributed to higher-order terms. These higher-order terms, accompanying decay and shell-electron capture, are [1, 2]: (i) internal bremsstrahlung; (ii) ionization and excitation of the electron cloud; (iii) internal pair production (IPP). These higher-order effects are much less intense than the first-order processes; for example, in the case of the internal bremsstrahlung about one photon is produced per 100 decays, and the internal ionization process only occurs about once per 104 decays. The first estimate of the contribution of the IPP process in the decay was performed by Arley and Moller [3] and, independently, by Tisza [4]; these studies were refined in the following years, and experimentally tested by Greenberg and Deutsch [5].
In 1973 [2] and in the following years, the IPP process was also investigated in the decay, where this effect could give additional information on the higher-order phenomena accompanying nuclear transformations. In Ref. [2], a theoretical estimate of the production due to bremsstrahlung emitted by particles in the 241Am decay was given: , where and are the and activities, respectively. This estimate was in reasonable agreement with the experimental result, obtained in the same work by investigating double coincidences of the two 511 keV quanta produced by the positron annihilation; the set-up did not allow the detection of the emitted pairs. In particular, a source of 241AmO2 (deposited on top of Pt backing and covered with thin Au layer) was mounted between Ge(Li) 40 cm3 and NaI(Tl) 80 cm3 detectors. The mechanical support of the source was made of a stainless steel backing (without direct access of ’s to the stainless steel); Pb and V foils were used to stop the emitted particles. The observation of two 511 keV quanta in coincidence between the Ge(Li) and NaI(Tl) gave for the probability of the emission the value: . The authors excluded (or took into account) various background processes which could imitate the observation, such as: i) pair creation by cosmic rays and high energy ’s from natural radioactivity; ii) high energy external bremsstrahlung from ’s; iii) (,n), (,p) reactions on Pt, Pb, V, O; iv) excitation of high energy nuclear levels in (,’) scattering; v) presence of 65Zn and other long lived emitters; vi) decay of 241Am to high energy levels of 237Np.
In 1978 the theoretical value of the probability of the process in 241Am was re-estimated to be [6]: . Further theoretical studies have also been carried out; in fact, while the theory of the IPP in the decay seemed to be clear, in the decay it required more attention [2, 6, 7, 8, 9]. Essentially two modes have been suggested for the IPP process in decay: (i) the particles are accelerated in the Coulomb field of the daughter nucleus and emit bremsstrahlung ’s, with energy above , giving rise to pairs; (ii) the daughter nucleus originates in an excited state, and the resulting quantum (real or virtual) is converted to a pair. Both processes are possible, as pointed out in Ref. [9]; the process (i) proposed in Refs. [2, 6] gives a theoretical estimate111For completeness we recall that in [7, 8] the value for this process was estimated to be , but [9] has shown that this value was incorrect because it didn’t take into account the full transition energy of the particles. (as forementioned), whereas the process (ii) discussed in Refs. [7, 8] gives . Therefore, according to Ref. [9] the dominant contribution to the IPP in the decay of 241Am arises from the mode (i).
In 1986 a new dedicated experiment [10] was performed in order to investigate the result of Ref. [2]. In this experiment, three emitters were studied: 210Po, 239Pu, 241Am. Pb and Cu absorbers were used to stop and particles; the 511 keV double coincidences between a Ge(Li) 70 cm3 and a NaI(Tl) 785 cm3 detectors, placed in a low background shield, were observed. For all the sources, the process was observed with probabilities: Po, Pu, Am, respectively. Pollution of the 241Am source by 152Eu and 154Eu, and pollution of the 239Pu by 241Am, 234mPa, 214Bi, 208Tl, 137Cs were measured, while in the 210Po source radioactive impurities were not identified. Moreover, any decay of 241Am to the high energy ( keV) excited states of 237Np was excluded (intensity ). The obtained results were in agreement with the refined theoretical expectations of Ref. [6] (see Table 1), and in particular the previous positive result [2] on 241Am was confirmed.
In the late eighties, some anomalous phenomena were observed in collision of heavy ions at GSI and in collision of heavy ions with [11], and it was suggested the possible existence of an hypothetical neutral particle, whose decay in pair may give rise to the observed peaks in the measured and spectra. In particular, in Ref. [12] it was proposed a new model where the pair production would be due to a QED strong coupling phase: heavy nuclei have a surface region with a strong static electric field that can be perturbed by the passage of charged particles (e.g. and ). The perturbation causes a fluctuation in the electric field, that would produce a strong non-static electromagnetic field which may be source of strong coupling vacuum; the vacuum bubbles can decay in positronium states, which are bound states. In Ref. [12] some experimental tests were suggested for this model; one of them is the search for double coincidence events produced by positron annihilation. Thus, in this scenario the production of positronium states in decay of heavy nuclei may be a concurrent process with respect to the IPP one. However, since the IPP process is better stated, in the following we will mainly refer the results to it.
In 1990 an experiment was performed [13] with the aim to test the model of Ref. [12]. Two thin plastic scintillators registered pairs emitted from an 241Am source, and two Ge detectors of 198 cm3 each registered two 511 keV quanta. The 241Am source was sandwiched by a pair of 10 m Ti foils followed by two aluminized mylar foils of 30 m; two plastic scintillators were placed after them. During 541.7 h live time, the coicidences between 511 keV events in the two Ge detectors were 466, most of them were explained as due to background from decay of 26mAl produced by 23Na(,n)26mAl from Sodium contamination; the presence of Sodium in the vicinity of 241Am source was also confirmed by the observation of the lines at 1809 and 1130 keV emitted by the 26Mg∗ produced in the process: 23Na(,p)26Mg∗. When requiring energy releases in two plastics: and greater than 30 keV, just 6 coincidences survive. Finally, only one event remains when the last requirement – as expected by the model of Ref. [12] – is adopted; hence, an upper limit on the probability of the production of a hypothetical neutral particle with mass above 1.4 MeV/c2 decaying in , was set: (95% confidence level, C.L.). The previous experimental results regarding the IPP process [2, 10] (and also the theoretical estimates) were missed in this work. However, in case the IPP process is instead considered, the requirement should be released, and thus the useful number of 511 keV double coincidences from Ref. [13] is 6 events; considering this fact, one can derive a value: , compatible with previous observations. It should be, however, noted that – since the efficiency in [10] was calculated by simulating the decay with mass of 1.4 MeV – the derived value of has to be considered approximate.
Thus, considering the present situation (see Table 1), a new search for pairs in the 241Am decay has been carried out deep underground. The obtained results are described in the following.
2 The experimental set-up and the data taking conditions
The results presented in the following have been obtained through dedicated measurements with some pairs of the NaI(Tl) detectors of the DAMA/LIBRA set-up [14, 15, 16, 17, 18, 19], whose description, radiopurity and main features are discussed in details in Refs. [14, 16, 19]. We just recall that the sensitive part of this set-up is made of 25 highly radiopure NaI(Tl) crystal scintillators (5-rows by 5-columns matrix); each NaI(Tl) detector has 9.70 kg mass and a size of () cm3. The bare crystals are enveloped in Tetratec-teflon foils and encapsulated in radiopure OFHC Cu housings. In each detector two 10 cm long special quartz light guides also act as optical windows on the two end faces of the crystal and are coupled to two low background photomultipliers working in coincidence at single photoelectron threshold. The data taking considered here has been performed in the new DAMA/LIBRA configuration after the upgrading occurred in fall 2010 when all the PMTs were replaced by new ones with higher quantum efficiency, specially developed by HAMAMATSU; details can be found in Ref. [19]. The light response in this experimental configuration is typically 6–10 ph.e./keV depending on the detector. The detectors are housed in a sealed low radioactivity copper box installed in the center of a low radioactivity Cu/Pb/Cd-foils/polyethylene/paraffin shield; moreover, about 1 m concrete (made from the Gran Sasso rock material) almost fully surrounds (mostly outside the barrack) this passive shield, acting as a further neutron moderator. The copper box is maintained in HP Nitrogen atmosphere in slightly overpressure with respect to the external environment; it is part of the threefold-level sealing system which excludes the detectors from environmental air. For more details see e.g. Refs. [14, 16, 19].
In the particular measurements dedicated to the present study an 241Am source was placed in the middle of each used NaI(Tl) pair for a total of 6 sources used. The sources have been produced by CEA-DAMRI (nowadays called CERCA-LEA) and are identified as AM241-EGSA15. These sources are made of a thin circular layer of active AmO2 ( 3 mm) heat sealed by two thin mylar foils. They have been stored deep underground for 10 yr; their present mean activity is 35 kBq.
The detailed decay scheme of 241Am can be found in Ref. [20]. The energy spectrum measured by the DAMA/LIBRA detectors, when irradiated by the 241Am sources, has been accurately reproduced by a suitable MonteCarlo simulation, which takes into account the decay scheme of 241Am [20] and the activities of the sources. It is worth noting that about 99.91% of the 241Am total rate is due to events below 90 keV. Thus, in order to reduce the acquisition dead-time in our measurements the energy threshold for each detector has been set at 90 keV to exclude most of the events from the 241Am which are out of the region of interest for the present investigation. The accuracy of the MonteCarlo simulation allows us to be confident with the standard procedures used for the determination of the data acquisition live time. The electronic chain was modified with respect to the usual one [14] by excluding the 500 s blocking time and by using either twelve detectors (six pairs) in the first running period or six detectors (three pairs) in the second one. An improvement of a factor has been achieved as regards the ratio of the live time over elapsed one in the second dedicated run, where just three pairs have been used (those with the lower number of coincidences in the first run).
In both running periods each pair has the detectors of the other used pairs as anti-coincidences; this implies two different coincidence backgrounds for a same pair in the two different running periods (see Tables 2 and 3). Finally, the energies of the acquired events were read out from the ADCs (see e.g. Ref. [14]).
3 Experimental results
The experimental procedure is based on the detection of the two ’s from the positron annihilation through the study of double coincidences in pairs of faced highly radiopure NaI(Tl) detectors.
3.1 The first dedicated run
As mentioned above, for practical reasons in this data taking six pairs of faced highly radiopure NaI(Tl) detectors (i.e. 12 of the 25 available) of the DAMA/LIBRA set-up have been used. The activity, , of each used 241Am source is given in Table 2; the total live time was 1.29 d.
In the data analysis an energy window (465–557) keV – practically around 511 keV – has been considered for the coincidences for both the detectors of a pair. Since no decay of 241Am to an excited level of 237Np with energy larger than 0.8 MeV has been observed, to our knowledge and in the decay scheme of 241Am [20]222One should note that in the list of 241Am quanta [21] there are unplaced ’s with low intensity and higher energies; however, even the most energetic one, having keV (intensity ), has not enough energy to create pair., a contribution of 241Am decay in the applied coincidence energy windows is not expected. Hence, a possible excess with respect to the data obtained when running without sources is due to the sources but not directly to the known 241Am decay scheme [20].
The obtained results are summarized in Table 2, where
| (kBq) | (=1.29 d) | (=24.6 d) | (counts/day) | |
|---|---|---|---|---|
| 1-2 | 34.8 | 5 | 23 | 2.9 |
| 6-7 | 40.8 | 14 | 26 | 9.8 |
| 9-10 | 31.7 | 10 | 25 | 6.7 |
| 11-12 | 34.6 | 1 | 28 | |
| 16-17 | 29.5 | 5 | 22 | 3.0 |
| 19-20 | 29.4 | 10 | 17 | 7.0 |
| Total | 200.8 | 45 | 141 | 29.2 |
the number of the double coincidences () measured in the (465–557) keV energy window during 1.29 d of live time () in presence of the 241Am sources are compared with those () recorded in the same energy window during 24.6 d live time () without any source.
Either the estimate of the coincidence excess rate in the considered energy window, , or the limit (90% C.L.) value have been calculated according to the statistical procedure described in the Appendix. The obtained values are compatible; therefore, a cumulative analysis has been performed (last row of Table 2). The cumulative data give the result: counts/day, that is counts/day/pair.
3.2 The second dedicated run
The second dedicated run has been performed using the three detectors pairs/sources which had, in the first dedicated run, the lowest values of ; these pairs are: 1-2, 11-12 and 16-17 (see Table 2). The experimental live time in this second dedicated run was 2.63 d.
The results are summarized in Table 3.
| (kBq) | (=2.63 d) | (=24.6 d) | (counts/day) | |
|---|---|---|---|---|
| 1-2 | 34.8 | 19 | 29 | 6.0 |
| 11-12 | 34.6 | 15 | 33 | 4.3 |
| 16-17 | 29.5 | 17 | 29 | 5.3 |
| Total | 98.9 | 51 | 91 | 15.7 |
Also in this case, the obtained values are well compatible; thus, the cumulative analysis is performed obtaining: counts/day, that is counts/day/pair.
3.3 The cumulative results
The excess rates per pair in the region of interest during the two running periods are compatible. Thus, the compatibility and the independence between the first and the second dedicated runs allow us to perform a combined analysis of the two data sets.
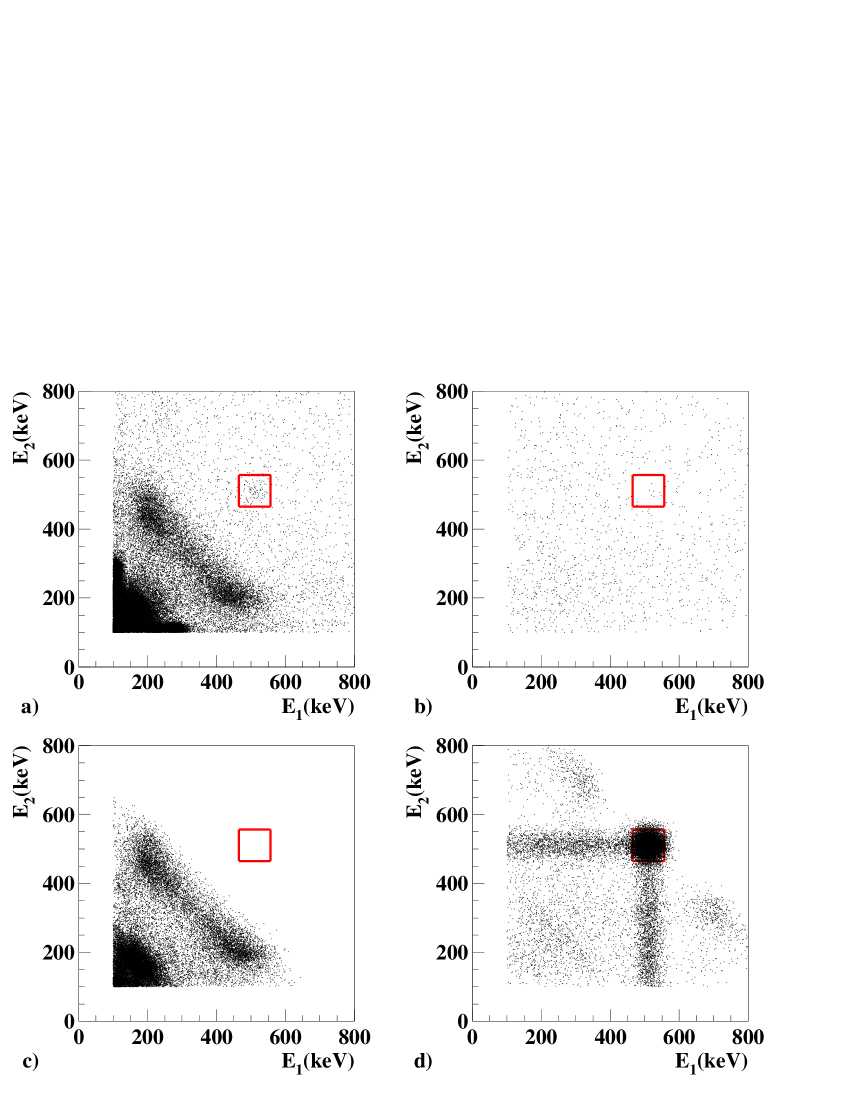
In Fig. 1a) the coincidence scatter plot of the considered pairs of faced NaI(Tl) detectors is shown for the cumulative data collected in presence of the 241Am sources during 3.92 d live time. The red box defines the region with and in the energy window (465–557) keV ( around 511 keV); the spot at 511–511 keV can be recognized. This excess is not present in the data measured in absence of the sources, Fig. 1b), and in the model of the 241Am decay according to the scheme of Ref. [20], Fig. 1c). Most of the other coincidence events outside the red box of Fig. 1a) are instead well described by the scatter plots in Fig. 1b) and 1c). Finally, Fig. 1d) shows the model scatter plot for the case of positrons annihilations within the sources; the 27% of the positrons annihilations give events that are contained in the red box. The scatter plots in Fig. 1b), c) and d) are suitably normalized (see the respective captions).
The analysis of the double coincidences allows us to point out the presence of 243Am (alpha decaying with half-life 7370 yr) and of 154Eu (mainly beta decaying with half-life 8.601 yr) isotopes in the sources. Their presence can be justified by side reactions in the production procedures of the 241Am sources. In fact: i) the 241Am is produced bombarding 239Pu nuclides with neutrons; ii) the 243Am is produced by neutron captures on 241Am; iii) the 154Eu is produced by induced fissions of 239Pu. Moreover, from the study of the experimental cumulative energy spectrum with multiplicity shown in the following, the presence of 233Pa isotope can be pointed out; it belongs to the 241Am chain and it is the only daughter of 241Am able to produce a not negligible contribution of ’s above 100 keV.
The 154Eu can be mainly identified by the detection of a of 123 keV in coincidence with ’s of 1005 keV (this occurs in the 8.2% of the 154Eu decays), 1274 keV (15.8%), 1596 keV (0.8%). Hence, selecting a slice in the double coincidence scatter plot of Fig. 1a) with in the 100–150 keV energy window, the spectrum of is produced and reported in Fig. 2a). The best fit333The contribution from 241Am decay is negligible in this energy window., which includes the contributions of the set-up and of the 154Eu decay model (also see Fig. 2b)), provides 154Eu decays. This corresponds to an average activity of 154Eu equal to mBq in each source; thus, the expected number of coincidences with and in the energy window (465–557) keV ( around 511 keV) during 3.92 d live time is events, rather low compared with the 96 measured events (see Tables 2 and 3).
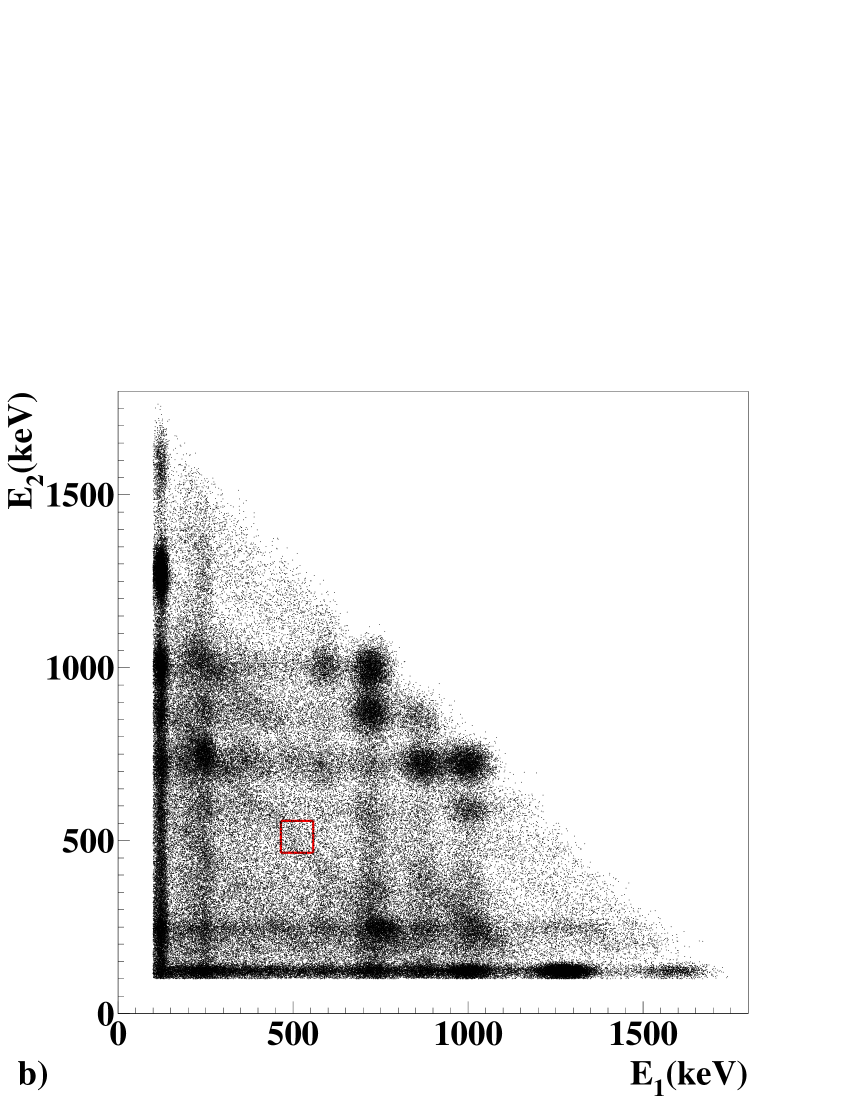
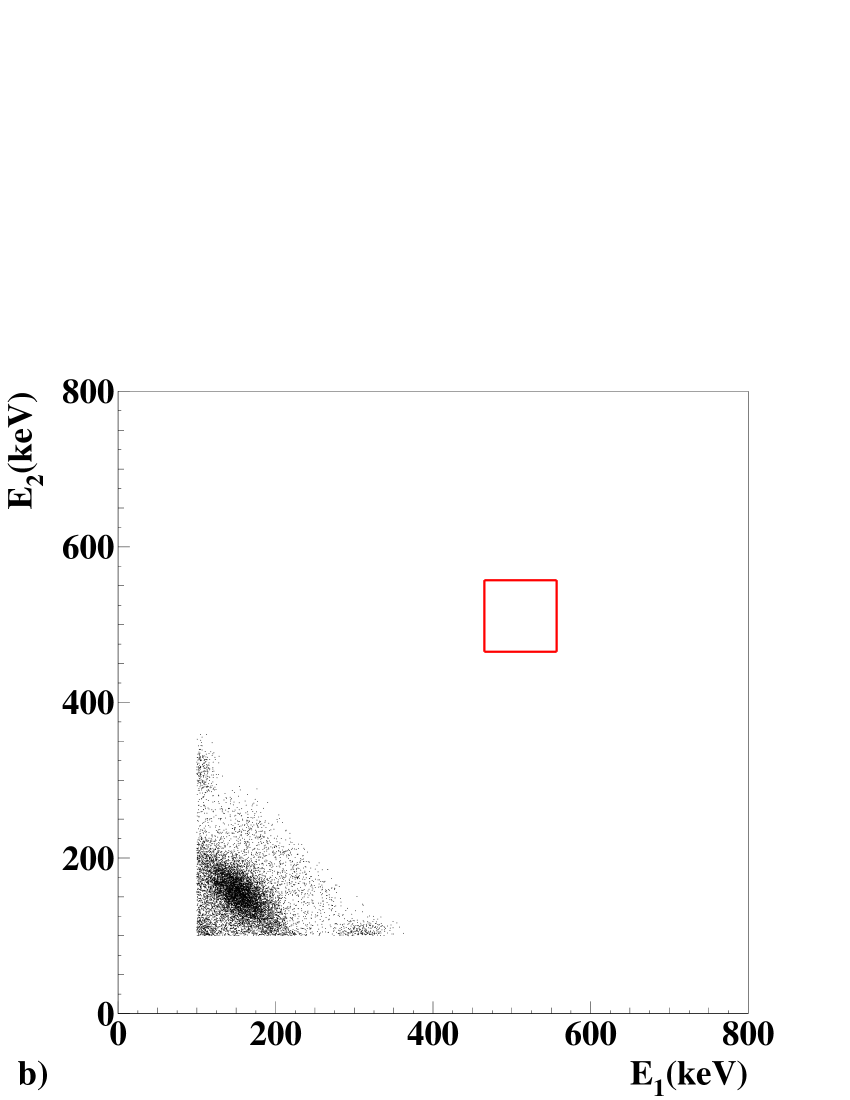
As concerns the 243Am contribution, it decays into 239Np, which decays with half-life 2.36 d in the long living isotope 239Pu. The model scatter plots of the 239Np and of the 233Pa decays are depicted in Fig. 3. The former can explain the structures at keV in coincidence with and keV, present in the experimental data shown in Fig. 1a). From the decay schemes of these two isotopes, one can see that no coincidence is expected in the region of interest for the present study.

In order to estimate the amount of the aforementioned nuclides, Fig. 4 shows the cumulative experimental energy spectrum (black histogram) with multiplicity measured during 3.92 d live time, after the subtraction of the contribution of the set-up derived from the measurements without the 241Am sources. This energy spectrum is fitted in the energy interval (195–770) keV by the model given by the sum of the mentioned components: 241Am, 239Np, 233Pa, and 154Eu. The latter contribution is fixed to 154Eu decays, as previously estimated. For completeness we note that the contribution of the 511 keV events, observed in the coincidence scatter plot of Fig. 1a), is negligible and is not included in the fit. The result of the fit is shown in Fig. 4 together with the four mentioned components. A slight excess remains around 900 keV; it may be ascribed for example to a possible trace contamination (of order of 3.4 10-2 ppt) of 234mPa belonging to the 238U chain.
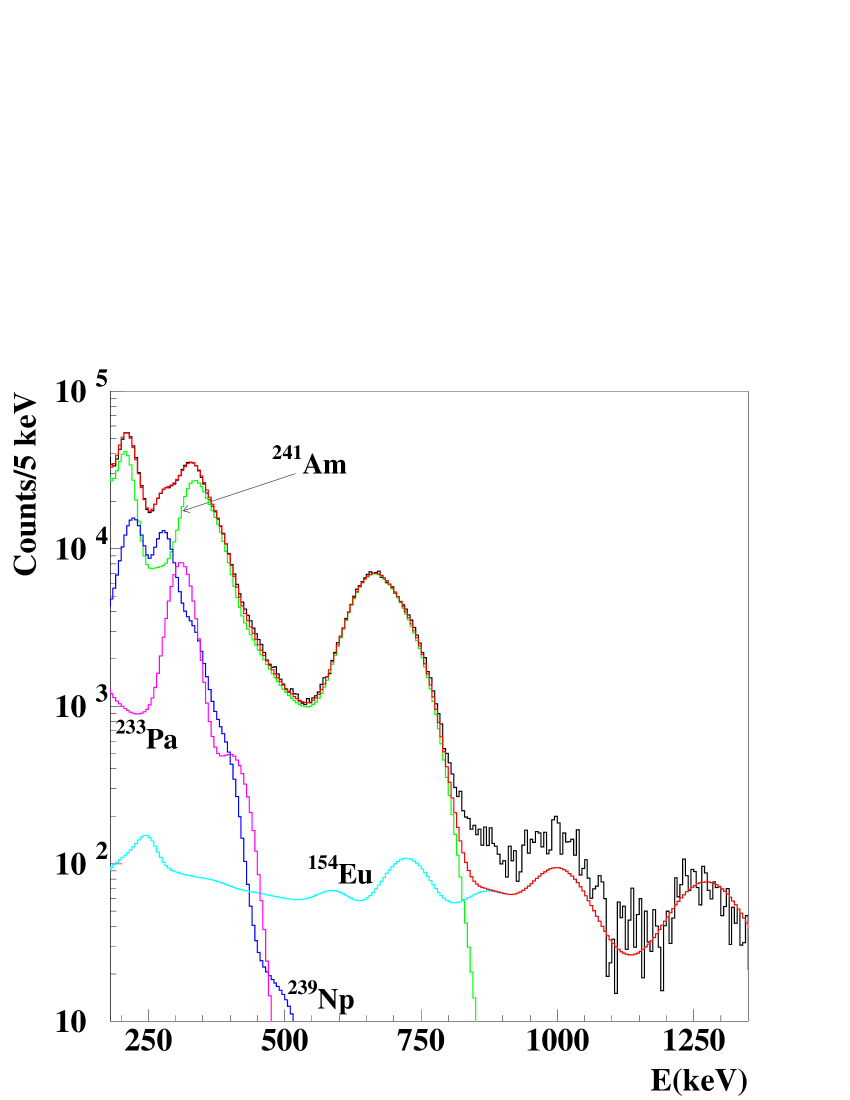
The best fit values for the total number of decays of 241Am, 239Np, and 233Pa are , , and , respectively; thus the average activity of 241Am in each source is kBq, compatible with the nominal activities of the sources444A small discrepancy (%) between measured and nominal values of the activity can be explained taking into account the error given by the producer (3.5%) and the uncertainty on the estimated live time (few percent). Anyway, the results in the following are largely independent on the live time (see later). reported in Tables 2 and 3. Since the 243Am – 239Np system is at equilibrium, the estimated average activities of 243Am and 239Np in each source are both equal to mBq; this corresponds to ppm of 243Am contamination in the sources. The 233Pa has instead an average activity in each source equal to mBq; this value allows us to estimate the age of the sources, , from their production. In fact, assuming that all the sources were produced at the same time and only 241Am isotopes ( nuclides) were present, at the present time one can write: and , where: i) is the present number of 241Am nuclides, given by the best fit value of the average activity multiplied by ; ii) is the present number of 237Np daughters, given by its activity (at equilibrium with 233Pa) multiplied by the mean-life of 237Np; iii) yr is the mean-life of 241Am [21]. By using these data, the age of the sources can be estimated as: yr, well in agreement with the specifications of the sources, also considering the production time of the sources material.
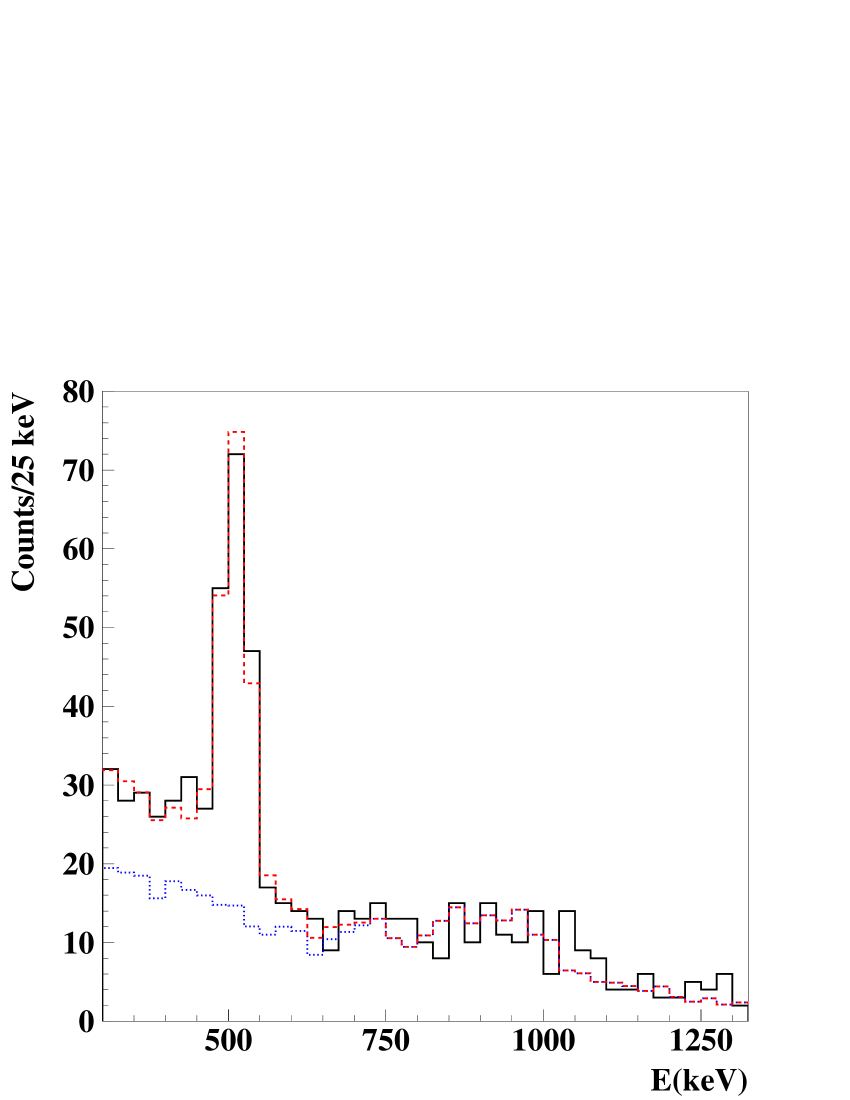
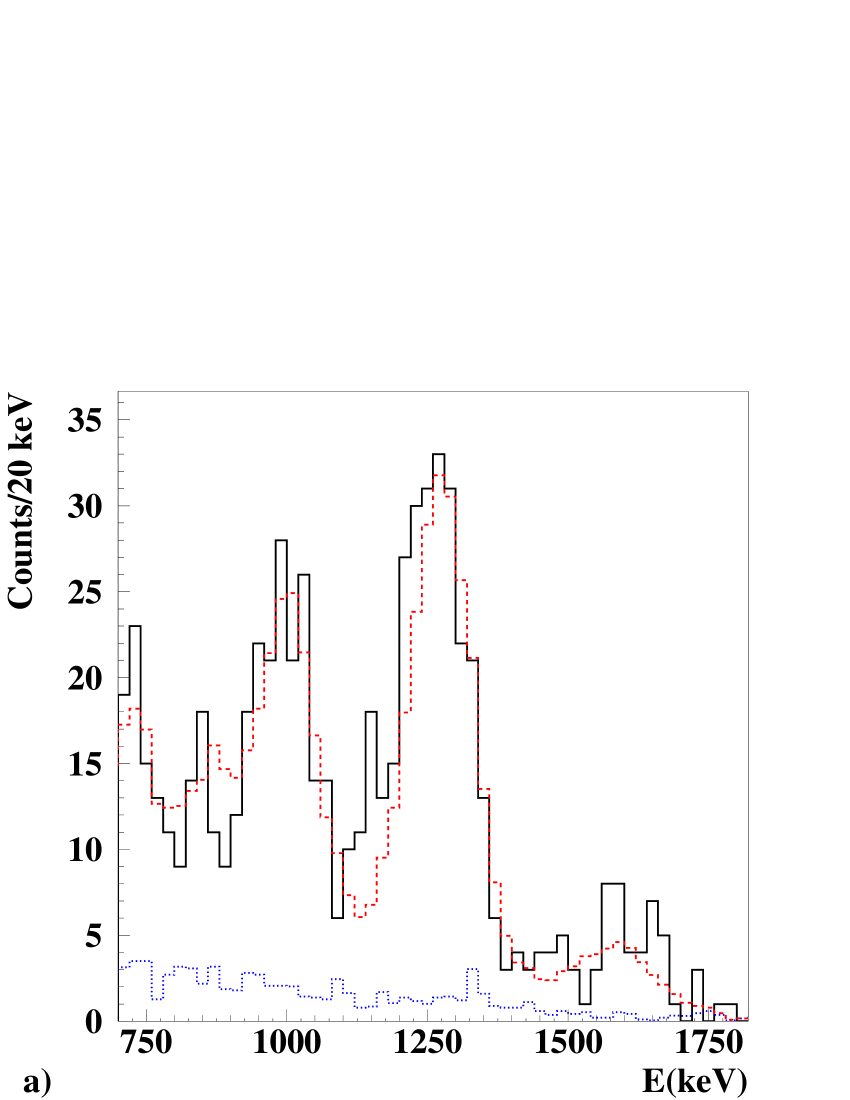
The excess of double coincidence events with energy around 511 keV in faced pairs of detectors seen in Fig. 1a) can be analyzed to quantify the effect searched for. For this purpose, Fig. 5 shows the cumulative energy distribution (solid histogram) measured by one detector of the pair when a coincident event with energy in the window (465–557) keV ( around 511 keV) is collected in the faced detector; obviously, both the detectors of the pair and all the used pairs contribute to the histogram. As mentioned, the cumulative live time in presence of 241Am sources is 3.92 d. In the same plot the dotted histogram represents the expected background obtained by summing the contributions of the set-up (derived applying the same data selection to the data acquired in absence of the 241Am sources) and of the 154Eu decays. The presence of a peak at 511 keV is clearly evident. Thus, a fit of the spectrum has been performed in the region 300–750 keV by including555The 239Np and 233Pa decays give no contribution in this bidimensional energy window, as forementioned.: i) the measured coincidences rate of the set-up in absence of the sources; ii) the determined coincidences rate of 154Eu decays; iii) the known contribution from the 241Am decay, which is however negligible, as the decay scheme is known [20]; iv) a model of the background described by a straight line (this includes other possible contributions in the region of interest due to the sources, as e.g. possible 234mPa); v) the simulated spectrum due to positrons annihilations within the sources. Thus the only free parameters are the straight line and the number of positrons annihilations within the sources. The fit (/d.o.f. = 3.7/14 = 0.26, where d.o.f. is the number of degrees of freedom) confirms the excess of double coincidences from 511 keV rays due to positrons annihilations. The obtained number of positrons generated within the sources is: .
Considering the positrons generated within the sources as related to IPP process, the value can be derived according to the relation:
| (1) |
where is the total number of 241Am decays during the running periods, whose best fit value is as previously estimated; it is worth noting that the value is independent from the precise evaluation of the live time of the data taking. Hence, the best estimate of is , substantially compatible with the previous observations and with the theoretical expectations (see Table 1). The coincidence excess in the energy region of interest is at 7.4 C.L.
With the obtained estimate counts, we could derive also the cautious limit for the IPP process: (90% C.L.).
In the following, we have performed an investigation on the possible processes, other than pair production in 241Am decay, which – totally or partially – might account for the observed coincidence events.
4 Investigation on possible coincidence background from the sources
Let us summarize some relevant arguments:
-
•
Any possible contribution to double coincidences from the used detectors (as e.g. from high energy ’s interactions) has been taken into account in the adopted procedure (see above).
-
•
In the decay chain 241Am Bi, emitters are absent [21].
-
•
In the decay chain 241Am Bi, the contribution of high energy ’s (with energies larger than 1.022 MeV, that is able to produce pairs) is negligible. In particular, from the best fit values of the 241Am and 233Pa activities given above, one can obtain for the daughters’ activities: 208 mBq for 237Np, 8.1 Bq for 233U and 4.6 nBq for 229Th and its daughters. Taking into account these activities and safely assuming that each is converted in a pair, the contribution to from high energy ’s in the 241Am decay chain can be estimated as in the following: i) 1110 keV in 233U decay [22] can provide ; ii) lines at 1046, 1100, 1119 and 1328 keV in 213Bi decay [23] can provide , , and , respectively; iii) lines at 1239 and 1567 keV in 209Tl decay [24] can provide and , respectively.
- •
Thus, no direct contribution from the 241Am decay scheme [20] to double coincidences in the energy windows of interest is expected.
Remaining possible side processes are discussed in the following.
4.1 Possible induced reactions
We recall that the used sources are made of a thin layer of active AmO2 ( 3 mm) heat sealed by two thin mylar foils, and have been stored underground for 10 yr.
Thus, the elements that can give rise to (,n) or to (,p) reactions are the stable or long-lived isotopes of C, O (that are present in the source materials) and, if particles may survive to the mylar foils, also N (gas surrounding the sources when they are inserted in the set-up) and Cu (housing of the NaI(Tl) detectors).
Considering the energy of the particles emitted by the 241Am, the possible (,n) reactions are: 13C(,n)16O, 17O(,n)20Ne, 18O(,n)21Ne; none of the produced isotopes is a emitter. On the other hand, possible (,n) reactions on Ne produced by the O isotopes (,n) reactions: 20Ne(,n)23Mg, can give emission but the energy threshold is 8.7 MeV, that is higher than the energy of the particles emitted by 241Am.
Moreover, considering the energy threshold, the only possible (,p) reactions are: 14N(,p)17O and 15N(,p)18O, both giving stable isotopes of O, and 63Cu(,p)66Zn and 65Cu(,p)68Zn both giving stable isotopes of Zn.
A further source of background could be due to pairs produced by photons from (,n) and (,) reactions on the stable nuclei of C and O; considering the measured cross sections [25, 26], a cautious upper limit on this contribution can be derived: .
In conclusion, possible significant contribution of emitters and of high energy ’s from interactions on known materials can be excluded; a similar study was performed in Ref. [2] where such possibilities were also excluded.
4.2 241Am fission fragments and possible cluster decays
The spontaneous fission of 241Am has been measured in several works (see Ref. [27] and reference therein) and the recommended lifetime is: yr. Considering that the spontaneous fission activity is given by: , and that not all the fission fragments give rise to emission, an upper limit: can be derived. Thus, the spontaneous fission can be excluded as source of the observed coincidence excess.
Another possibility may be the induced fission. From experimental studies [28] the more probable fragments’ masses in case of 241Am fission induced by thermal neutrons (the one with higher cross section) are about 135 and 105. Various nuclei with an excess of neutrons can be created with a cumulative yield up to 7%, high values (up to 8 MeV) and small ’s [29]. In their decay, deexcitations ’s with high energies can be converted into pairs and imitate the observed effect. Thus, let us estimate the probability to have a fission from neutrons in the experimental conditions. The environmental flux of thermal neutrons inside the used multi-ton multi-component shield777The flux of thermal neutrons outside the shield at LNGS is: cm-2s-1 [30], and the adopted neutron shield is made of 1 m concrete from the same Gran Sasso rock, 10/40 cm paraffin/polyethylene, 1.5 mm Cd. In addition, there are 10 cm of OFHC Cu and 15 cm of Pb [14]. has been measured to be: cm-2s-1 (90% C.L.) [14]; the maximum cross-section for neutrons is 40 barn [31, 25], and the 241Am nuclei in a source are about . From these quantities a fission rate from environmental thermal neutrons surviving the shield can be derived to be: s-1; on the other hand, neutrons produced in this possible fission process have a very low probability to induce further fissions (). Thus this process is too inefficient to account for the observations.
In addition to the environmental flux, neutrons can also be produced in the (,n) reaction on O isotopes; in particular, 17O and 18O which are in the mylar and in the AmO2 with a total concentration of cm-2. However, considering a mean source activity of 35 kBq and a mean cross section for the process of 0.2 barn for 17O (natural abundance %) and 0.5 barn for 18O (%) [25], a neutron production rate: s-1, is derived with a neutron mean energy of order of MeV. The expected fission rate from these neutrons ( barn [25]) is of order of s-1. Thus, in conclusion also this fission process is too inefficient to explain the observed excess.
Finally, another possible process is the clusters decay of 241Am. The emission of 34Si is considered as the most probable one in the cluster decay of the 241Am: 241Am 34Si + 207Tl, with theoretical half lives: yr [32] and yr [33]. Both the created fragments are unstable. In the decay of 207Tl, only the ground state and few excited levels of 207Pb with keV are populated; their deexcitation cannot produce pairs. However, in the decay chain 34Si ( s, keV) 34P ( s, keV) 34S [21] much more energy is released, and the deexcitation of high energy levels in 34P and 34S leads to emission of pairs. The best current experimental limit on the decay: 241Am 34Si + 207Tl, is yr [34]; the limit for other clusters emission is yr [27]. In conclusion, the possible contribution of 241Am cluster decay is negligible () and cannot account for the observed effect.
5 Conclusions
The experimental data show an excess of double coincidences in the 511–511 keV energy region which are not explained by known analysed background processes as discussed above. Moreover, any sizeable contamination of the sources themselves by isotopes emitters is not present to our knowledge.
Thus, this measured excess gives a a relative activity for the Internal Pair Production (IPP) with respect to alpha decay of 241Am; this value is of the same order of magnitude as the previous determinations [2, 10, 13] obtained by using different setups, sources (with different features and producers) and experimental approaches. In a conservative approach the upper limit (90% C.L.) can be derived.
For completeness, we mention that, if one considers the exotic frame hypothesized in Ref. [12], one would get value or limit of the same order of magnitude as those given above.
Further investigations are foreseen in the future with different dedicated sources and set-up.
Finally, it is worth noting that this is the first result on IPP obtained in an underground experiment (in the previous ones the sea-level cosmic-rays background was estimated and subtracted), and that the value obtained in the present work is independent on the live-time estimate (which is difficult to estimate with very high accuracy in similar experiments because of the relatively high intensities of the 241Am sources).
6 Appendix
In order to estimate a possible presence of a coincidence excess in the region of interest in runs with presence of 241Am sources with respect to runs without sources, the following procedure has been adopted.
Let us consider that is the number of coincidence events measured in the region of interest in presence of the source during a live time . The conditional probability to measure coincidence events in presence of a signal ( is the signal rate, see text) and of a background rate is given by:
| (2) |
The parameter can be estimated by performing a run in absence of sources, where coincidence events are collected in a live time . In fact, the conditional probability to obtain given a background rate is:
| (3) |
To determine the probability distribution function () of , , the procedure of Ref. [35] can be followed. If the prior probability of is a uniform function in , the posterior – given – can be written by using the Bayes’ theorem:
| (4) |
while the posterior for – given and the parameter – is:
| (5) |
where and are normalization constants. Since is a nuisance parameter, one can marginalize with respect to it obtaining:
| (6) |
where is a normalization constant such that
| (7) |
These integrals can be analytically solved and the obtained results are:
| (8) |
where . The constant is given by:
| (9) |
Finally, according to the Wilks’ theorem, the quantity follows a distribution [36]; thus to obtain the best estimate for and its interval of confidence, the same procedure used for the distribution can be followed.
References
- [1] B.G. Pettersson, in Alpha-, Beta-, and Gamma-Ray Spectroscopy, edited by K. Siegbahn (North-Holland, Amsterdam, 1966), p. 1569.
- [2] A. Ljubicic and B.A. Logan, Phys. Rev. C 7, 1541 (1973).
- [3] N. Arley and C.Møller, Kgl. Danske Videnskab. Selskab, Mat.-Phys. Medd. 15, 9 (1938).
- [4] L. Tisza, Phys. Z. Sowjetunion 11, 245 (1937).
- [5] J.S. Greenberg and M. Deutsch, Phys. Rev. 102, 415 (1956).
- [6] K. Pisk et al., Phys. Rev. C 17, 739 (1978).
- [7] E. Presnajderova et al., Z. Phys. A 291, 283 (1979).
- [8] V. Chudy et al., Czech. J. Phys. B 31, 1311 (1981).
- [9] B.A. Logan et al., Z. Phys. A 305, 295 (1982).
- [10] J. Stanicek et al., Nucl. Instr. Meth. B 17, 462 (1986).
-
[11]
T. Cowan et al., Phys. Rev. Lett. 56, 444 (1986);
H. Tsertos et al., Z. Phys. A 326, 235 (1987);
W. Koenig et al., Z. Phys. A 328, 129 (1987);
E. Berdemann et al., Nucl. Phys. A 488, 683c (1988). - [12] M. Inoue et al., Mod. Phys. Lett. A 5, 309 (1990).
- [13] T. Asanuma et al., Phys. Lett. B 237, 588 (1990).
- [14] R. Bernabei et al., Nucl. Instr. Meth. A 592, 297 (2008).
- [15] R. Bernabei et al., Eur. Phys. J. C 56, 333 (2008).
- [16] R. Bernabei et al., Eur. Phys. J. C 67, 39 (2010).
- [17] R. Bernabei et al., Eur. Phys. J. C 62, 327 (2009).
- [18] R. Bernabei et al., Eur. Phys. J. C 72, 1920 (2012).
- [19] R. Bernabei et al., Journal of Instrumentation 7, P03009 (2012).
- [20] M.S. Basunia, Nuclear Data Sheets 107, 2323 (2006).
- [21] R.B. Firestone et al., Table of Isotopes, 8th ed. (John Wiley, New York, 1996) CD update, 1998.
- [22] E. Browne and J.K. Tuli, Nuclear Data Sheets 109, 2657 (2008).
- [23] M.S. Basunia, Nuclear Data Sheets 108, 633 (2007).
- [24] M.J. Martin, Nuclear Data Sheets 63, 723 (1991).
- [25] http://spes.jaea.go.jp.
- [26] http://www.oecd-nea.org/janis/book/book-alpha.pdf
- [27] M.J. Martin, Nuclear Data Sheets 106, 89 (2005).
- [28] N. Shinohara et al., J. Nucl. Sci. Techn. 36, 232 (1999). E.A.C. Crouch, At. Data Nucl. Data Tables 19, 417 (1977).
- [29] http://ie.lbl.gov/fission.html
- [30] P. Belli et al., Il Nuovo Cimento A 101, 959 (1989).
- [31] M. Calviani et al., J. Kor. Phys. Soc. 59, 1912 (2011); F. Belloni et al., Eur. Phys. J. A 49, 2 (2013).
- [32] O.A.P. Tavares et al., Phys. Scr. 76, 375 (2007).
- [33] M. Bhattacharya and G. Gangopadhyay, Phys. Rev. C 77, 027603 (2008).
- [34] K.J. Moody et al., Phys. Rev. C 36, 2710 (1987).
- [35] O. Helene, Nucl. Instr. Meth. 212, 319 (1983).
- [36] K. Nakamura et al., J. Phys. G 37, 075021 (2010).