11email: oskari.miettinen@helsinki.fi 22institutetext: Department of Astronomy, Yale University, New Haven, CT 06511, USA
22email: stella.offner@yale.edu
Dynamics, CO depletion, and deuterium fractionation of the dense condensations within the fragmented prestellar core Orion B9–SMM 6††thanks: This publication is based on data acquired with the Atacama Pathfinder EXperiment (APEX) under programmes 079.F-9313(A), 084.F-9312(A), and 090.F-9313(A). APEX is a collaboration between the Max-Planck-Institut für Radioastronomie, the European Southern Observatory, and the Onsala Space Observatory.
Abstract
Context. Low-mass prestellar cores are rarely found to be fragmented into smaller condensations but studying such substructure where present is essential for understanding the origin of multiple stellar systems.
Aims. We attempt to better understand the kinematics and dynamics of the subfragments inside the prestellar core SMM 6 in Orion B9. Another object of the present study is to constrain the evolutionary stage of the condensations by investigating the levels of CO depletion and deuterium fractionation.
Methods. We used the APEX telescope to observe the molecular lines C17O, N2H, and N2D towards the condensations. We use the line data in conjunction with our previous SABOCA 350-m dust continuum map of the source.
Results. The condensations are characterised by subsonic internal non-thermal motions (), and most of them appear to be gravitationally bound. The dispersion of the N2H+ velocity centroids among the condensations is very low (0.02 km s-1). The CO depletion factors we derive, , do not suggest any significant CO freeze-out but this may be due to the canonical CO abundance we adopt. The fractional abundances of N2H+ and N2D+ with respect to H2 are found to be and , respectively. The deuterium fractionation of N2H+ lies in the range .
Conclusions. The detected substructure inside SMM 6 is likely the result of cylindrical Jeans-type gravitational fragmentation. We estimate the timescale for this fragmentation to be yr. The condensations are unlikely to be able to interact with one another and coalesce before local gravitational collapse ensues. Moreover, significant mass growth of the condensations via competitive-like accretion from the parent core seems unfeasible. The high level of molecular deuteration in the condensations suggests that gas-phase CO should be strongly depleted. It also points towards an advanced stage of chemical evolution. The subfragments of SMM 6 might therefore be near the onset of gravitational collapse, but whether they can form protostellar or substellar objects (brown dwarfs) depends on the local star formation efficiency and remains to be clarified.
Key Words.:
Astrochemistry – Stars: formation – ISM: individual objects: Orion B9–SMM 6 – ISM: kinematics and dynamics – ISM: molecules1 Introduction
Fragmentation of interstellar molecular clouds appers to occur in a hierarchical fashion. Recent Herschel observations have clearly demonstrated that on the scales of several parsecs to pc the cloud structures are highly filamentary in shape (e.g., André et al. (2010); Arzoumanian et al. (2011); Hill et al. (2011); Palmeirim et al. (2013)). The origin of large-scale filaments is still unclear, but they often (if not always) show substructures along their long axes. Substructures on scales of pc are typically called clumps, which may contain significant gas substructure and would likely form a cluster of stars. Gas fragments pc, which are expected to form a single star or bound multiple system, are called cores.
The dense cores formed in the course of hierarchical fragmentation represent the size scale on which protostellar collapse and the formation of low-mass ( M☉) stars take place. Initially starless cores that are bound by their self-gravity are called prestellar cores (Ward-Thompson et al. (1994)). These are ideal laboratories to study the genuine initial physical and chemical conditions of star formation. Because many stars are found in binary or higher-order multiple systems (e.g., Raghavan et al. (2010); Kraus & Hillenbrand (2012); Duchêne & Kraus (2013)), core fragmentation into still smaller subunits is expected to occur at some point in their evolution, possibly during the prestellar phase. In the present work, we will use the term condensation for such subfragments with sizes of pc (e.g., André et al. (2007), hereafter ABMP07). Since condensations are fairly low-mass and are usually found within a gravitationally bound core, they likely represent the precursors of individual stars that will eventually comprise a multiple star system.
Core fragmentation is of prime importance when studying the origin of core mass function and its connection to the stellar initial mass function (IMF). From a theoretical point of view, the formation of multiple stellar systems is far from well-understood (e.g., Tohline (2002); Goodwin et al. (2007)). For example, the initial phase and characteristic timescale of the fragmentation process remain to be established. Observationally, it is unclear how common the fragmentation of low-mass cores actually is, particularly in the case of starless/prestellar cores.
Some of the earliest instances of core substructure were discovered by Lemme et al. (1995). They mapped the starless core L1498 in the C-bearing molecules C18O and CS using the IRAM 30-m telescope with resolution. The core was resolved into many small-scale condensations with diameters and masses of about 0.02 pc and 0.01 M☉, respectively. The subfragments were found to be gravitationally unbound, and the authors suggested that they are just transient structures (see also Kuiper et al. (1996)). Langer et al. (1995) used high-resolution () interferometric observations to map the TMC-1 core D. Similiarly to L1498, the core was found to be composed of several condensations with sizes and masses of 0.007–0.021 pc and M☉, respectively. These sources were also found to be gravitationally unbound and unable to form even proto-brown dwarfs unless the condensations were to merge and form more massive structures. Langer et al. (1995) suggested that a pure Jeans-type gravitational instability could not be responsible for the core fragmentation. However, the substructure was identified from molecular-line maps (the C-bearing species CCS and CS). Therefore, it is possible that the subfragments represent small-scale chemical inhomogeneities of the parent core (cf. Takakuwa et al. (1998)).
Kamazaki et al. (2001) detected the first subfragments inside prestellar cores in dust emission. They carried out high-resolution NMA observations of 2- and 3-mm dust continuum emission towards two prestellar cores in the Oph A region, namely SM1 and SM1N. Both cores appeared to contain condensations of 600–1 100 AU in size with masses in the range 0.054–0.14 M☉. Interestingly, as opposed to the above mentioned studies, the condensations found by Kamazaki et al. (2001) were determined to be gravitationally bound entities. We note that one of the condensations within SM1, with a mass of 0.14 M☉, was suggested by the authors to be already in the early protostellar phase. Kamazaki et al. (2001) also concluded that the substructures were the result of gravitational fragmentation of the parent cores. Takakuwa et al. (2003) studied two prestellar cores in the TMC-1C region with high-resolution molecular-line observations, and found AU -size condensations with masses of M☉ inside the cores. These substellar-mass fragments were found to be gravitationally unbound but with dissipation timescales long enough to allow the fragments to coalesce with one another and form more massive objects.
More recently, Kirk et al. (2009) studied the prestellar core L183 (L134N) with high-resolution ( or pc AU) BIMA interferometric observations, and found it to be composed of three condensations of pc in radii. They concluded that the observed substructure was the result of the fragmentation of a rotating and collapsing prestellar core. On the other hand, Schnee et al. (2010) found that none of their 11 starless cores in Perseus break into smaller components at resolution or on the AU scale (see also Miettinen & Offner (2013) for Ori B9–SMM 1). Chen & Arce (2010), using SMA observations at resolution ( pc or AU), discovered three condensations inside the prestellar core R CrA SMM 1A. The projected separation between the 0.1–0.2 M☉ mass condensations was found to be between 1 000 and 2 100 AU. The observed spacings are comparable to the local Jeans length, and the authors suggested that the condensations were formed through the fragmentation of an elongated prestellar core during the isothermal phase of evolution (i.e., when the radiative cooling is able to compensate for the heating by compression). Nakamura et al. (2012) used the SMA with a few arcsec (a few hundred AU) resolution to observe the prestellar cores SM1 and B2-N5 in Ophiuchus (cf. Kamazaki et al. (2001)). These cores were resolved into three and four condensations, respectively, with masses of M☉ and sizes of a few hundred AU. The masses were determined to be high enough for the condensations to be gravitationally bound. Nakamura et al. (2012) proposed that the origin of the substructures could be explained by turbulent fragmentation (e.g., Fisher (2004); Offner et al. (2010)).
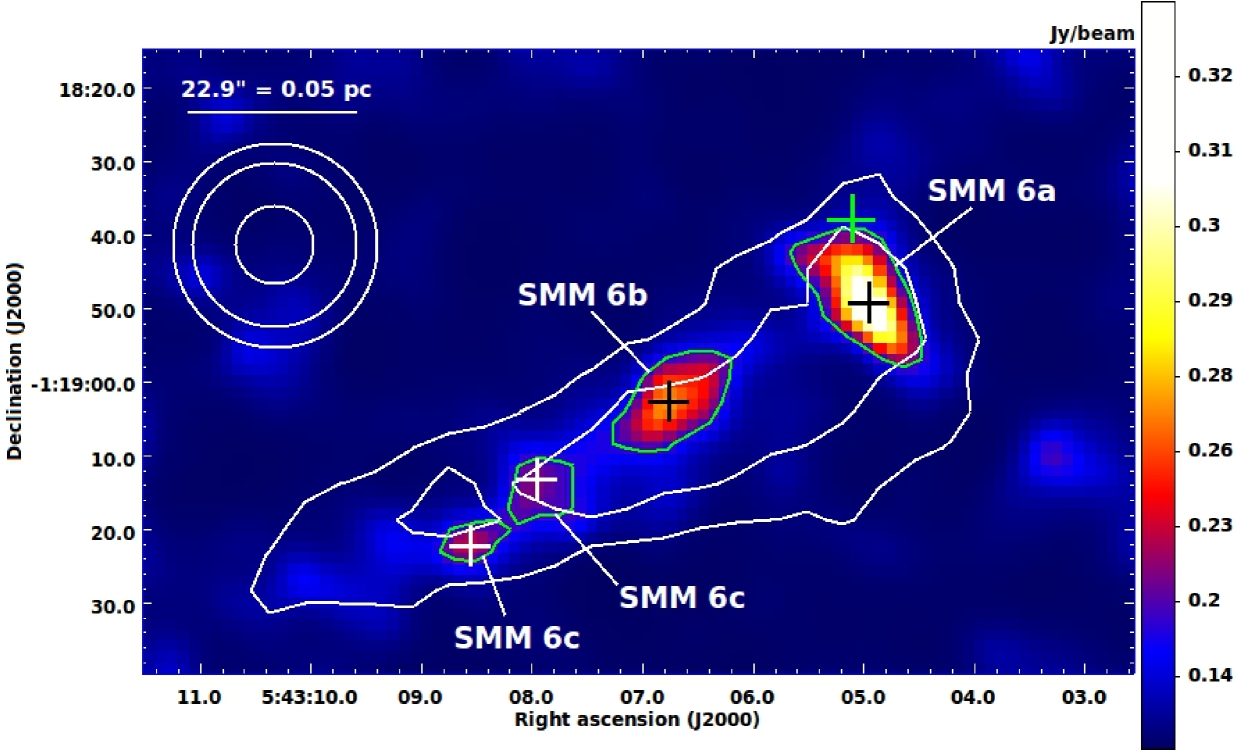
The target source of the present study is the prestellar core SMM 6 in the Orion B9 star-forming region. It was originally discovered by Miettinen et al. (2009; hereafter, Paper I) from the LABOCA 870-m mapping of Orion B9. The core was found to be elongated in shape and not harbouring any embedded infrared point source, and we suggested that it is likely to be prestellar due its high density. Based on the NH3 observations with the Effelsberg 100-m telescope, Miettinen et al. (2010; henceforth, Paper II) derived the gas kinetic temperature of K towards a selected position in SMM 6. The one-dimensional non-thermal velocity dispersion was derived to be 0.1 km s-1, which is subsonic by a factor of two. Employing the new temperature value with the assumption that equals the dust temperature (), the mass of SMM 6 was estimated to be M⊙. The virial-parameter analysis of the source suggested that it is gravitationally bound and near virial equilibrium, supporting our earlier speculation that it is in the prestellar phase of evolution.111The core mass is revised down by a factor of in the present paper. This does not affect its classification into a gravitational bound or prestellar core (Appendix A). Miettinen et al. (2012; hereafter, Paper III) presented further molecular-line observations towards the NH3 target position in SMM 6. The CO depletion factor was estimated to be , and the N2D+/N2H+ column density ratio was found to be , indicating a high degree of deuterium fractionation. In Paper III, we also presented the results of our SABOCA 350-m imaging of dense cores in Orion B9. SMM 6, determined to be a thermally supercritical cylindrical object, was resolved into three to four very low-mass (revised masses are M⊙; see Appendix A) condensations projectively separated by pc or AU (see Fig. 1)222We assumed that the distance to Orion B9 is pc. This value is also adopted in the present paper.. The origin of this substructure can be explained in terms of thermal Jeans-type fragmentation. It seems likely that SMM 6 has undergone a similar fragmentation process as R CrA SMM 1A described above. In Table 1, we list the SABOCA 350-m peak positions of the SMM 6’s condensations along with their main physical properties.
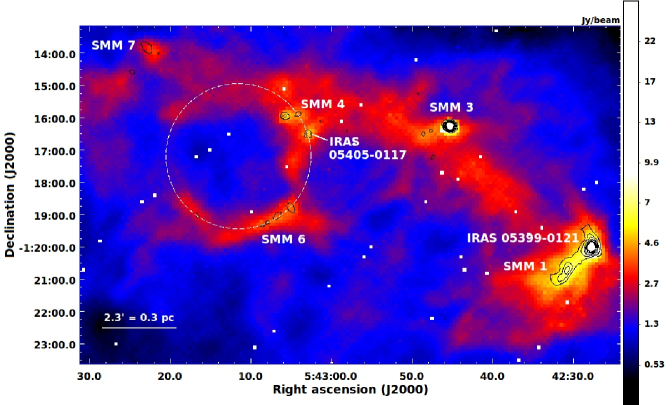
Recent Herschel data show that SMM 6 belongs to a northeast-southwest oriented filamentary structure (see Fig. 2). Miettinen (2012b) found that there is a sharp velocity gradient in the parent filament (across its short axis), and suggested that it might represent a shock front resulting from the feedback from the nearby expanding H ii region NGC 2024 ( pc southwest of Orion B9). The formation of dense cores in Orion B9, including SMM 6, might have been triggered by this feedback. As highlighted in Fig. 2, the ring-like cloud structure consisting partly of SMM 6 could be a manifestation of such a dynamic environment.
In Paper III, we noticed that our LABOCA map employed in Papers I and II was misaligned, and therefore we had to adjust its pointing using the Spitzer and SABOCA source positions (see footnote 2 in Paper III and Miettinen & Offner (2013)). The target positions of our previous molecular-line observations were chosen to be the peak positions of the LABOCA map before adjusting the pointing, and therefore they are slightly offset from the 870-m maxima. In the case of SMM 6, our previous line observations probed the core edge (as shown by the green plus sign in Fig. 1). To better understand the physics and chemistry of SMM 6, particularly the properties of its substructure, we performed follow-up molecular-line observations towards the condensations. In the present paper, we examine the kinematics and dynamics of these subfragments and their chemical properties, namely CO depletion and molecular deuteration of N2H+. The latter parameter has the potential to constrain the evolutionary stage of the condensations (e.g, Crapsi et al. (2005); Friesen et al. (2013)). The present work is one of the first studies of the dynamics of subfragments within a prestellar core. The observations and data reduction are described in Sect. 2. Section 3 presents the observational results, while analysis and its results are presented in Sect. 4 and Appendix A. We discuss the results in Sect. 5 and in Sect. 6, we summarise the paper and draw our main conclusions.
| Source | ||||||
|---|---|---|---|---|---|---|
| [h:m:s] | [::] | [pc] | [M☉] | [ cm-2] | [ cm-3] | |
| SMM 6aa𝑎aa𝑎aSMM 6a was called SMM 6 in Paper III. It is renamed here for clarity because we call the parent core SMM 6. | 05 43 05.0 | -01 18 49.3 | 0.02 | |||
| SMM 6b | 05 43 06.8 | -01 19 02.8 | 0.02 | |||
| SMM 6c | 05 43 08.0 | -01 19 13.2 | 0.005b𝑏bb𝑏bWith the clumpfind (Williams et al. (1994)) settings used in Paper III, SMM 6c and 6d were treated as a single source. The values of , , and given in the last row of the table include contributions from both condensations. Approximately half of the reported size and mass of SMM 6c+6d can be assigned to both fragments, making their densities about four times the common value ( cm-3). | b𝑏bb𝑏bWith the clumpfind (Williams et al. (1994)) settings used in Paper III, SMM 6c and 6d were treated as a single source. The values of , , and given in the last row of the table include contributions from both condensations. Approximately half of the reported size and mass of SMM 6c+6d can be assigned to both fragments, making their densities about four times the common value ( cm-3). | b𝑏bb𝑏bWith the clumpfind (Williams et al. (1994)) settings used in Paper III, SMM 6c and 6d were treated as a single source. The values of , , and given in the last row of the table include contributions from both condensations. Approximately half of the reported size and mass of SMM 6c+6d can be assigned to both fragments, making their densities about four times the common value ( cm-3). | |
| SMM 6d | 05 43 08.6 | -01 19 22.3 | 0.005b𝑏bb𝑏bWith the clumpfind (Williams et al. (1994)) settings used in Paper III, SMM 6c and 6d were treated as a single source. The values of , , and given in the last row of the table include contributions from both condensations. Approximately half of the reported size and mass of SMM 6c+6d can be assigned to both fragments, making their densities about four times the common value ( cm-3). | b𝑏bb𝑏bWith the clumpfind (Williams et al. (1994)) settings used in Paper III, SMM 6c and 6d were treated as a single source. The values of , , and given in the last row of the table include contributions from both condensations. Approximately half of the reported size and mass of SMM 6c+6d can be assigned to both fragments, making their densities about four times the common value ( cm-3). | b𝑏bb𝑏bWith the clumpfind (Williams et al. (1994)) settings used in Paper III, SMM 6c and 6d were treated as a single source. The values of , , and given in the last row of the table include contributions from both condensations. Approximately half of the reported size and mass of SMM 6c+6d can be assigned to both fragments, making their densities about four times the common value ( cm-3). | |
| SMM 6c+6db𝑏bb𝑏bWith the clumpfind (Williams et al. (1994)) settings used in Paper III, SMM 6c and 6d were treated as a single source. The values of , , and given in the last row of the table include contributions from both condensations. Approximately half of the reported size and mass of SMM 6c+6d can be assigned to both fragments, making their densities about four times the common value ( cm-3). | … | … | 0.01b𝑏bb𝑏bWith the clumpfind (Williams et al. (1994)) settings used in Paper III, SMM 6c and 6d were treated as a single source. The values of , , and given in the last row of the table include contributions from both condensations. Approximately half of the reported size and mass of SMM 6c+6d can be assigned to both fragments, making their densities about four times the common value ( cm-3). | b𝑏bb𝑏bWith the clumpfind (Williams et al. (1994)) settings used in Paper III, SMM 6c and 6d were treated as a single source. The values of , , and given in the last row of the table include contributions from both condensations. Approximately half of the reported size and mass of SMM 6c+6d can be assigned to both fragments, making their densities about four times the common value ( cm-3). | … | b𝑏bb𝑏bWith the clumpfind (Williams et al. (1994)) settings used in Paper III, SMM 6c and 6d were treated as a single source. The values of , , and given in the last row of the table include contributions from both condensations. Approximately half of the reported size and mass of SMM 6c+6d can be assigned to both fragments, making their densities about four times the common value ( cm-3). |
2 Observations and data reduction
We used the APEX (Atacama Pathfinder EXperiment; Güsten et al. (2006)) 12-m telescope in Chile to observe the spectral-line transitions C17O, N2H, and N2D towards the 350-m peaks of the dense condensations within SMM 6. The N2H+ observations were carried out on 25 September 2012, while those of C17O and N2D+ were performed on the 27th of the month. The strongest 350-m condensation SMM 6a was observed again in C17O on 28 September because the previous day’s weather was poor when the source was observed.
The observed transitions, their selected spectroscopic properties, and
observational parameters are summarised in Table 2.
The critical densities, , listed in Col. (4) of
Table 2, were calculated at K using the Einstein
coefficients from the Leiden Atomic and Molecular Database (LAMDA;
Schöier et al. (2005))444http://www.strw.leidenuniv.nl/moldata/ (C17O) and Pagani et al. (2009) (N2H+ and N2D+). The
collisional-rate data () were taken from LAMDA (C17O) and
the Caltech Submillimeter Wave Astrophysics
website555http://www.submm.caltech.edu/tab/molecular-data/
collisional-rates.html (N2H+ and N2D+).
The latter are based on data from BASECOL
(Dubernet et al. (2013))666http://basecol.obspm.fr .
As a frontend for the C17O and N2D observations, we used the APEX-1 receiver of the Swedish Heterodyne Facility Instrument (SHeFI; Belitsky et al. (2007); Vassilev et al. 2008a ,b). APEX-1 operates in single-sideband (SSB) mode using sideband separation mixers, and it has a sideband rejection ratio dB. For the N2H observations the frontend used was APEX-2, which has similar characteristics as APEX-1. The backend for all observations was the RPG eXtended bandwidth Fast Fourier Transfrom Spectrometer (XFFTS; cf. Klein et al. (2012)) with an instantaneous bandwidth of 2.5 GHz and 32 768 spectral channels.
The observations were performed in the wobbler-switching mode with a azimuthal throw (symmetric offsets) and a chopping rate of 0.5 Hz. The telescope focus and pointing were optimised and checked at regular intervals on the planet Jupiter, and the variable stars W Orionis, RAFGL865 (V1259 Ori), Ceti (Mira A), and R Leporis (Hind’s Crimson Star). The pointing was found to be accurate to . Calibration was made by means of the chopper-wheel technique and the output intensity scale given by the system is , i.e., the antenna temperature corrected for the atmospheric attenuation. The observed intensities were converted to the main-beam brightness temperature scale by , where is the main-beam efficiency. The absolute calibration uncertainty is estimated to be about 10%.
The spectra were reduced using the CLASS90 programme of the GILDAS software package777Grenoble Image and Line Data Analysis Software is provided and actively developed by IRAM, and is available at http://www.iram.fr/IRAMFR/GILDAS. The individual spectra were averaged and the resulting spectra were Hanning-smoothed to improve the signal-to-noise ratio. Linear (first-order) baselines were determined from velocity ranges without line-emission features, and then subtracted from the spectra. The resulting rms noise levels at the smoothed resolutions are listed in the last column of Table 2.
The transition of C17O contains nine hyperfine (hf) components that are spread over km s-1. We fitted this hf structure using “method hfs” of CLASS90 to derive the LSR velocity () of the emission, and FWHM linewidth (). The hf line fitting can also be used to derive the line optical thickness by comparing the relative intensities of the hf components. However, in all spectra the hf components are mostly blended together and thus the total optical thickness could not be reliably determined from the sum of the peak optical thicknesses of the components. For the rest frequencies of the hf components, we used the values from Ladd et al. (1998; Table 6 therein). The adopted central frequency, 224 714.199 MHz, refers to the strongest hf component which has a relative intensity of .
The transition of both N2H+ and N2D+ is split up into 38 hf components spread over about 5.7 and 6.9 km s-1, respectively. To fit these hf structures, we used the rest frequencies from Pagani et al. (2009; Tables 4 and 10 therein). The adopted central frequencies of N2H and N2D, 279 511.832 and 231 321.912 MHz, are those of the hf component which has a relative intensity of . Also in these cases, the hf components are blended and thus the optical thickness could not be reliably determined through hf fitting.
| Transition | HPBW | PWV | Channel spacinga𝑎aa𝑎aThe original channel spacings. The final spectra were Hanning-smoothed which divides the number of channels by two. | rms | |||||||
|---|---|---|---|---|---|---|---|---|---|---|---|
| [MHz] | [K] | [cm-3] | [″] | [K] | [mm] | [kHz] | [km s-1] | [min] | [mK] | ||
| C17O | 224 714.199b𝑏bb𝑏bFrom Ladd et al. (1998). | 16.2 | 27.8 | 0.75 | 168–208 | 1.0–2.1 | 76.3 | 0.1 | 9 | 27–34 | |
| N2D | 231 321.912c𝑐cc𝑐cFrom Pagani et al. (2009). | 22.2 | 27.0 | 0.75 | 204–228 | 1.0–2.1 | 76.3 | 0.1 | 9–15 | 30–36 | |
| N2H | 279 511.832c𝑐cc𝑐cFrom Pagani et al. (2009). | 26.8 | 22.3 | 0.74 | 161–164 | 76.3 | 0.08 | 4.2–4.8 | 38–41 | ||
3 Observational results
3.1 Spectra
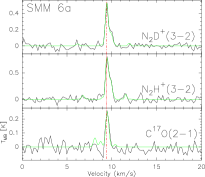
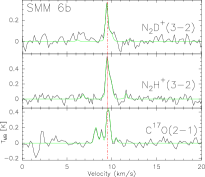
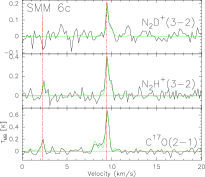
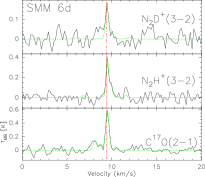
The Hanning-smoothed spectra are presented in Fig. 3. The lines are clearly detected towards all condensations. The hf structure of the C17O line is partially resolved in SMM 6b–d (note the hf satellites on the low-velocity side of the strongest component), but not sufficiently well to derive the line optical thickness. Towards SMM 6c, the C17O and N2H+ lines exhibit two well-separated velocity components: besides the lines at the systemic velocity km s-1, there are weak lines at a lower velocity ( km s-1). There is also a hint of low-velocity C17O emission in the spectra towards SMM 6a and 6b. The low-velocity line emission was already detected towards other Orion B9 cores in Papers I–III and by Miettinen (2012b). We note that some of the spectra show small artificial “absorption”-like features, most notably the C17O spectra towards SMM 6a and 6b. These are caused by emission in the OFF-source reference position (OFF-beam); for example, there is C17O emission in the velocity range km s-1 towards the OFF-position of SMM 6b. We also note that the nearby condensations SMM 6c and 6d are encompassed by the beams. Therefore, line emission from one of the sources is (partly) caught in the beam when observing towards the dust peak of the other and may thus affect the line profiles to some degree.
3.2 Spectral-line parameters
The spectral-line parameters are listed in Table 3. The values of and were derived through fitting the hf structure. The quoted uncertainties are formal fitting errors. The fact that the lines are only marginally resolved at best means that the quoted values represent only an upper limit to the intrinsic linewidth. The peak intensities () were derived by fitting a single Gaussian to the profile of the strongest line. The integrated line intensities () listed in Col. (6) of Table 3 were computed over the velocity range given in square brackets in the corresponding column. This way, we were able to take the non-Gaussian shape of the lines into account. The uncertainties in the peak and integrated intensities represent the quadrature sums of the fitting errors and the 10% calibration uncertainties. In the last two columns of Table 3, we list the estimated peak line optical-thicknesses () and assumed excitation temperatures (), which are described in Sect 4.5.
| Source | Transition | a𝑎aa𝑎aIntegrated intensity was computed by integrating over the velocity range indicated in square brackets (in km s-1). The percentage value indicates the contribution of hf components’ intensity lying within the corresponding velocity range. | b𝑏bb𝑏bThe optical thickness in the centre of the strongest hf component; it was derived using the assumed value given in the last column. | c𝑐cc𝑐c is assumed to be the same for the transition of N2H+ and N2D+. See Sect. 4.5 for details. | |||
|---|---|---|---|---|---|---|---|
| [km s-1] | [km s-1] | [K] | [K km s-1] | [K] | |||
| SMM 6a | C17O | [9.09, 10.46; 73.4%] | 10.0 | ||||
| N2H | [6.26, 12.00; 99.9%] | 5.0 | |||||
| N2D | [8.22, 11.09; 92.6%] | 5.0 | |||||
| SMM 6b | C17O | [7.69, 10.74; 100%] | 10.0 | ||||
| N2H | [7.90, 10.67; 92.6%] | 5.0 | |||||
| N2D | [8.46, 10.67; 92.6%] | 5.0 | |||||
| SMM 6c | C17O | [7.66, 10.42; 100%] | 10.0 | ||||
| SMM 6c (2nd v-comp.) | C17O | [1.50, 2.79; 78.7%] | 10.0 | ||||
| N2H | [8.57, 11.72; 96.1%] | 5.0 | |||||
| SMM 6c (2nd v-comp.) | N2H | [1.92, 3.04; 89.9%] | 5.0 | ||||
| N2D | [8.53, 10.32; 90.9%] | 5.0 | |||||
| SMM 6d | C17O | [6.82, 10.98; 100%] | 10.0 | ||||
| N2H | [8.22, 12.03; 96.2%] | 5.0 | |||||
| N2D | [7.73, 10.53; 87.2%] | 5.0 |
4 Analysis and results
4.1 Revisiting the core fragmentation
Because the mass of the parent core is revised in the present work (Appendix A), we also re-analyse its fragmentation here.
The line mass of SMM 6 is found to be M☉ pc-1. For an infinite, unmagnetised, isothermal cylinder, instability (collapse to line singularity) occurs if its exceeds the critical equilibrium value of (e.g., Ostriker (1964); Inutsuka & Miyama (1992))
| (1) |
where is the isothermal sound speed and the gravitational constant. Using the gas temperature K to calculate the sound speed ( km s-1), we derive the value M☉ pc-1. If the km s-1 non-thermal velocity dispersion derived in Paper II is taken into account, the effective sound speed increases the value of to M☉ pc-1. SMM 6 therefore appears to be (slightly) supercritical, in accordance with the detected substructure along the filament.
The projected spacing between the condensations is or pc, where the sources 6c and 6d are treated as a single fragment. In the case the cylinder has as is roughly the case for SMM 6, the Jeans length along the long axis is (Larson (1985); Hartmann (2002))
| (2) |
where is the central surface density with being the mean molecular weight per H2 molecule (when the He/H abundance ratio is about 0.1; see Appendix A) and the mass of a hydrogen atom. If the central column density is adopted to be the average value derived towards the condensations, cm-2 [Col. (6) of Table 1], is pc – very close to the observed interval of the condensations. We note that due to projection effects we are measuring only a lower limit to the separations.
If the finite length and diameter of the cylindrical cloud are and , respectively, the number of fragments forming due to gravitational instability is expected to be (e.g., Bastien et al. (1991); Wiseman & Ho (1998))
| (3) |
where is the wavelength of the most unstable perturbation, and the cylinder’s aspect ratio. The average width of the SMM 6 filament is about or pc, so is about 4. One would therefore expect to have two subfragments, i.e., half the number we observe. The discrepancy could be caused by projection effects (the true length of the filament is longer), and the fact that the source is not a perfect cylinder but is bent or curved as shown in Fig. 2 and it narrows towards the southeast (i.e., is changing along the filament). The number of detected subfragments could also be an imprint of internal turbulent motions, i.e., turbulent fragmentation (cf. Nakamura et al. (2012)). Note that is about 0.12 pc when computed using the average width 0.06 pc, i.e., a factor of 1.7 larger than .
We conclude that SMM 6 has likely fragmented into subcondensations as a result of cylindrical Jeans-type gravitational instability. Considering a filament of radius , the fragmentation timescale is then expected to be comparable to the radial crossing time, , where refers to the total velocity dispersion. If we use the average FWHM linewidth of the C17O lines detected here, km s-1, the for the SMM 6 filament is yr.
4.2 Gas velocity dispersion and virial state of the condensations
To study the gas kinematics of the high-density portion of the condensations, we employed the N2H transition due to its high critical density. We computed the non-thermal portion of the line-of-sight velocity dispersion, , using Eq. (9) of Paper II. It was assumed that K, and the error in was calculated from that of the FWHM linewidth. As shown in Col. (2) of Table 4, km s-1 for each source. Because the isothermal sound speed at 10 K is km s-1, the ratios are , i.e., the condensations are characterised by subsonic internal non-thermal (turbulent) motions. The true values of could be even lower because the N2H lines are not spectrally resolved, enabling us to derive only upper limits to the linewidths and velocity dispersions.
To examine the dynamical state of the condensations, we calculated their virial masses by employing the N2H linewidths and using the formula where the effects of external pressure, rotation, and magnetic field are ignored [cf. Eq. (12) of Paper II]:
| (4) |
where the dimensionless parameter measures the effect of a non-uniform density distribution on the gravitational energy and is given by , where is the power-law index of the density profile (; Bertoldi & McKee (1992)). Following ABMP07, we assume that the density structure of the sources is that of a centrally condensed isothermal sphere with (). The resulting values are listed in Col. (3) of Table 4 with uncertainties propagated from the linewidth errors. We note that if the condensations have inner density profiles shallower than , the virial masses will be higher. For example, if the density power-law index is or , the values are larger by a factor of 1.5 compared to those with .
The virial parameters of the condensations were calculated following the definition by Bertoldi & McKee (1992), i.e., . The values are given in Col. (4) of Table 4 with the uncertainties derived by propagating the errors in both mass estimates. The uncertainties in are quite large, but gravitational boundedness with seems possible at least for SMM 6a and 6c,d. If the intrinsic N2H linewidths are smaller, the values would also become smaller enhancing the importance of the condensations’ self-gravity.
| Source | a𝑎aa𝑎aA density profile that declines like was assumed. | ||
|---|---|---|---|
| [km s-1] | [M☉] | ||
| SMM 6a | |||
| SMM 6b | |||
| SMM 6c | b𝑏bb𝑏b These values assume that the radii and masses of SMM 6c and 6d are pc and M☉ (cf. Table 1). | b𝑏bb𝑏b These values assume that the radii and masses of SMM 6c and 6d are pc and M☉ (cf. Table 1). | |
| SMM 6d | b𝑏bb𝑏b These values assume that the radii and masses of SMM 6c and 6d are pc and M☉ (cf. Table 1). | b𝑏bb𝑏b These values assume that the radii and masses of SMM 6c and 6d are pc and M☉ (cf. Table 1). | |
| SMM 6c+6d | … | c𝑐cc𝑐cFor these values SMM 6c and 6d are treated as a one source. | c𝑐cc𝑐cFor these values SMM 6c and 6d are treated as a one source. |
4.3 Relative motions and interactions between the condensations
The centroid velocity difference between C17O and N2H+ for each condensation is small, only 0.045 km s-1 on average. This suggests that the condensations are not moving much with respect to the lower-density envelope (e.g., Kirk et al. (2007), 2010). The observed radial velocity data can also be used to study the (possible) motions of the condensations relative to one another (e.g., ABMP07). The average line-of-sight or radial velocity of the N2H lines is 9.43 km s-1 and the dispersion of the velocity centroids is km s-1 ( km s-1 and km s-1 for the optically thin C17O lines). The latter value is taken to represent the one-dimensional dispersion of the velocities of the high-density condensations (Peng et al. (1998); ABMP07). If the condensation velocities perpendicular to the line of sight are the same as their radial velocities, the three-dimensional dispersion of the velocities would be km s-1. If the orientation of the SMM 6 filament is not exactly perpendicular to our line of sight, and if the condensations would be moving along the filament, one would expect to see an imprint of these motions in the radial velocity data. The values would be expected to change monotonically if the movement of condensations along the parent filament (in either direction) is taking place. However, such a systematic trend is not observed.
As mentioned in Appendix A the length of SMM 6 along its long axis is pc. Using the above value of , a typical timescale for the condensations to cross the long axis of the parent core becomes yr. On the other hand, the average width of the filament, pc, suggests a radial crossing time of yr. Because the projected separation between the condensations is also pc (when SMM 6c and 6d are treated as a one fragment), the time required for one condensation to encounter and interact with another condensation is expected to be Myr (e.g., Takakuwa et al. (2003)). We note that there are two effects that can affect the rate of collision between condensations: i) gas drag caused by the surrounding medium, and ii) gravitational focusing (ABMP07). While the former is likely to make the real collision timescale longer, the latter could enhance the collision rate. Moreover, gas gradients (density, velocity) in the parent filament (cf. Kirk et al. (2013)) could modify the time required for the condensations to encounter and interact with one another.
If the representative density of the condensations is a few cm-3, their free-fall time is only yr. Therefore, it seems unlikely that the condensations have time to interact with one another before collapsing into protostars or proto-brown dwarfs unless their lifetime is a few tens of , which seems unlikely (see, e.g., ABMP07, and references therein). Within the errors, it is in principle possible that the condensations are not gravitationally bound. For unbound condensations, one should also consider the dissipation timescale, (e.g., Takakuwa et al. (2003)). For the average condensation effective radius, 0.017 pc, and average calculated from the N2H lines, 0.215 km s-1, becomes yr. The typical dissipation speed of the condensations would therefore be an order of magnitude shorter than the coalescence timescale.
4.4 Mass accretion onto the condensations
Some numerical simulations suggest that protostars can gain mass via competitive accretion, i.e., accretion from a shared reservoir of material (Bonnell et al. (2001); Bonnell & Bate (2006)). Even though competitive accretion models apply to protostars that accrete the available gas while moving around within the protocluster potential well, we can still obtain a rough estimate of the accretion rate onto the starless condensations if competitive-like accretion is occurring (cf. ABMP07). The mass accretion rate is given by , where is the gas density of the background medium, is the relative velocity of the subfragments with respect to the ambient medium, and is the accretion radius [see Eq. (3) of ABMP07]. The revised volume-average density of SMM 6 is about cm-3, the value we adopt for the background gas density. We assume that is equal to km s-1.111111ABMP07 assumed that the velocity distribution of their sample of condensations was given by the Maxwell-Boltzmann distribution, and adopted for the average relative speed of a condensation ( in our notation). The Maxwell-Boltzmann distribution is not expected to apply to our small number of subfragments, but we note that the value of is very close to . As concluded by ABMP07, is typically comparable to the condensation radius, and therefore we estimate it to be the average effective radius of the condensations, i.e., 0.017 pc. We thus derive the value M☉ yr-1. For comparison, the characteristic mass infall rate for a singular isothermal sphere undergoing gravitational collapse, (Shu (1977)), is M☉ yr-1 at 10 K – about 60 times higher than the above value. Local gravitational instability of the individual condensations is therefore likely to be more important than competitive-like accretion (ABMP07). However, given the total mass of the parent core, M☉, there is a considerable mass reservoir for (some of) the condensations to increase their mass via accretion, although by how much remains unclear. High-resolution spectral-line imaging of the whole core would be necessary to study whether there are infall motions towards the condensations and to estimate how much additional mass they could accrete (cf. Hacar & Tafalla (2011)).
4.5 Molecular column densities and fractional abundances
To properly determine the column density of the molecules, we must first determine the optical thickness of the transition. The optical thickness of a spectral line can be derived from the radiative transfer equation, provided the line intensity and excitation temperature are known (as mentioned in Sect. 2, the optical thickness could not be derived through fitting the hf structure). We used the line peak intensities () to calculate the peak optical thicknesses, [see, e.g., Eq. (A.3) in Miettinen 2012a ]. The C17O transition was assumed to be thermalised at the adopted gas temperature of the condensations, i.e., we set K. This assumption is supported by the results obtained in Paper III []. For the transition of N2H+ and N2D+, we adopted the value K. This is the typical value derived for the line or lower- lines of N2H+ and N2D+ (e.g., Caselli et al. (2002); Crapsi et al. (2005); Papers II–III; Friesen et al. (2013)). Finally, the background temperature was assumed to be equal to the cosmic background radiation temperature of 2.725 K. The derived values are listed in Col. (7) of Table 3, with the uncertainties propagated from those in .
The beam-averaged C17O column densities, , were derived following the standard LTE analysis outlined, e.g., in the paper by Miettinen (2012a; Appendix A.3 therein). Because the values of the C17O lines are so small, even the total optical thicknesses are (as seen in a number of other studies; e.g., Ladd et al. (1998); Fuller & Ladd (2002)). The values were therefore computed from the integrated line intensities under the assumption of optically thin line emission. In the two cases where the detected line does not cover all the hf components (SMM 6a and 2nd velocity component towards SMM 6c), the column density was scaled by the inverse of the relative line strength within the detected line. The errors in were propagated from those associated with the integrated intensity.
Because the strongest hf component of the transition of N2H+ and N2D+ has a relative strength of only , the values inferred from are clearly above unity in most cases, i.e., the lines are optically thick (as is often the case for these lines; e.g., Crapsi et al. (2004); Fontani et al. (2006)). The beam-averaged column densities of N2H+ and N2D+ were therefore computed from the FWHM linewidths and [see, e.g., Eq. (10) in Paper II]. The column density uncertainties were derived from those of and . If we are overestimating the true linewidths, the corresponding column densities would represent upper limits in this sense. We also checked our derivation of the column density by examining some additional optically thin hf satellites. The N2H+ line towards SMM 6a offered the best opportunity to do this because in this case five hf lines lying 1.5–2.4 km s-1 from the strongest component were clearly detected (Fig. 3). The integrated intensity of the satellite group is K km s-1 and its overall relatively strength is about 0.035. These can be converted into a total of cm-2, which is times the value derived from . The results are in reasonable agreement within the error.
The fractional abundances of the molecules were calculated by dividing their column densities by the H2 column density. For this purpose, the values were derived from the SABOCA map smoothed to the corresponding resolution of the line observations. The abundance errors were derived by propagating the errors in the column densities of the observed species and H2 molecules. The derived column densities and abundances are listed in Table 5.
4.6 CO depletion and deuterium fractionation
To investigate the amount of CO depletion in the condensations, we calculated the CO depletion factors following the analysis presented in Sect. 4.5 of Paper III. In summary, the canonical (or undepleted) CO abundance was adopted to be (Frerking et al. (1982)). With the additional assumptions about the oxygen-isotopic ratios, namely and , the canonical C17O abundance was set to . This value was then divided by the observed C17O abundance, which gives the CO depletion factor, (the eighth column of Table 5). The uncertainty was propagated from that in the observed abundance but it probably underestimates the true uncertainty by a factor of because of the uncertainties in the assumptions used (e.g., canonical abundance, oxygen-isotopic ratios, etc.). For instance, Lacey et al. (1994) found the best-fitting CO abundance of towards NGC 2024 in Orion B. Adopting this value would almost triple our values. A lower limit to the condensation’s age can be estimated to be comparable to its CO depletion timescale. Following the analysis presented in Miettinen (2012a, Sect. 5.5 therein), at a characteristic density of a few times cm-3, the depletion time is yr.
Towards each condensation, the N2H+ and N2D+ lines have similar radial velocities and linewidths. Therefore, the two lines are probably tracing the same gas. It is therefore reasonable to calculate the degree of deuterium fractionation by dividing the column density of the deuterated isotopologue N2D+ by its normal hydrogen-bearing form N2H+. The error was derived from the errors in the corresponding column densities. The results are shown in the last column of Table 5.
| Source | ||||||||
|---|---|---|---|---|---|---|---|---|
| [ cm-2] | [ cm-2] | [ cm-2] | [] | [] | [] | |||
| SMM 6a | a𝑎aa𝑎aThe value derived from a group of five optically thin satellites is cm-2 (see text). | |||||||
| SMM 6b | ||||||||
| SMM 6c | ||||||||
| SMM 6c (2nd v-comp.) | … | … | … | |||||
| SMM 6d |
5 Discussion
5.1 Substructure within Ori B9–SMM 6
The studied core SMM 6 is one of the rare examples of a prestellar core that is fragmented into smaller condensations. Even though the theoretical predictions of the cylindrical fragmentation are not exactly similar to the observed characteristics, it still seems likely that the core has fragmented as a result of Jeans-type gravitational instability. In particular, the projected separation between the fragments is very close to the local thermal Jeans length. The radial crossing time of the filamentary parent core suggests that its fragmentation timescale is Myr.
The estimated masses of the condensations are M☉ with a typical uncertainty of M☉. The condensations are characterised by subsonic non-thermal motions with assuming that the characteristic gas temperature is 10 K. The calculated condenstation virial parameters have relatively large errors, but it seems likely that they are self-gravitating. The minimum mass for a main-sequence star is M☉, below which the stellar temperature is not high enough to ignite proton-proton nuclear fusion. If the star formation efficiency for individual condensations is comparable to that of dense cores, (e.g., Matzner & McKee (2000); Goodwin et al. (2008); André et al. (2009)), they might be able to collapse to form stars without any additional mass accretion. At least for the most massive fragment, SMM 6a, this seems possible. The lowest mass fragments could also form substellar-mass objects or brown dwarfs (; e.g., Mollière & Mordasini (2012)). Examples of brown dwarfs that were likely formed or are currently forming via direct collapse include the wide (800 AU) binary brown dwarf system FU Tau A/B (Luhman et al. (2009)) and the pre-brown dwarf condensation Oph B-11 discovered by André et al. (2012). Some of the very low luminosity objects, such as L1148-IRS, could also be the precursors of isolated brown dwarfs (Kauffmann et al. (2011)). Brown dwarfs may also form (and subsequently be ejected) through disk fragmentation (see, e.g., Stamatellos & Whitworth (2009)). In theory, the minimum mass of an object capable of forming through gas fragmentation is set by the opacity limit for radiative cooling and is in the range M☉, that is to say, fragmentation could even form planetary-mass objects (e.g., Whitworth & Stamatellos (2006)).
The dispersion of the condensation velocity centroids is smaller than the one-dimensional velocity dispersion of the parent core gas by a factor of 11 (0.02 vs. 0.22 km s-1, where the latter is derived from at 11 K and 0.1 km s-1 non-thermal contribution). Synthetic observations (e.g., N2H+) of simulated environments (decaying and driven turbulence) by Offner et al. (2008) also show that on the scale of cores, the dispersion of the velocity centroids is small (cf. Offner et al. (2009)). Indeed, the motions of the condensations relative to one another appear to be so slow that they have no time to coalesce or gather together before evolving individually into protostars or proto-brown dwarfs. Moreover, despite the relatively large mass reservoir ( M☉) surrounding the condensations, they are unlikely to be able to increase their mass via competitive-like accretion. Instead, the fragments’ internal self-gravity could induce inward motions and accretion of additional mass – a scenario that could be tested by future high-resolution observations.
5.2 CO depletion and deuterium fractionation in the condensations
The gas phase depletion factors of CO derived towards the condensations are in the range . Therefore, there is no evidence of significant CO depletion. There are a few examples of high-density ( cm-3) cores where CO depletion is not prominent, namely L1495B, L1521B, and L1521E (Tafalla & Santiago (2004); Hirota et al. (2004)). Deuterium fractionation in these Taurus cores is also found to be low (Hirota et al. (2004), and references therein), and they are considered to be both chemically and dynamically young.
However, as mentioned in Sect. 4.6, the undepleted CO abundance in Orion B9 might well be higher than what we have adopted in the analysis. For this reason, we might be underestimating the values by a factor of about three (Lacy et al. (1994)). Also, we have observed the rotational transition of C17O, the line whose 10-K critical density is cm-3. Apart from the condensations, we might therefore be tracing lower density gas along the line of sight where CO is not significantly depleted (e.g., Fontani et al. (2012)). The resolution of our C17O observations also provides us with only beam-averaged values. The above factors are likely to explain the value less than unity derived for SMM 6d. Indeed, the temperatures and densities of the condensations are likely to be so low and high, respectively, that significant CO freeze-out is expected (e.g., Léger (1983); Rawlings et al. (1992)). For example, Tafalla et al. (2004) estimated that the density at which CO disappears from the gas phase is only cm-3 and cm-3 for the starless cores L1498 and L1517B in Taurus, respectively. Moreover, for our condensations the CO freeze-out timescale is estimated to be shorter than the free-fall time by a factor of about four (see Bergin & Tafalla (2007)) and about eight times shorter than the fragmentation timescale ().
For comparison, Caselli et al. (1999) found that CO is depleted by a factor of at the dust peak of the prestellar core L1544. Similarly, Savva et al. (2003) found that, relative to the canonical abundances from Frerking et al. (1982), CO is depleted by a factor of in a sample of nine dense cores in Orion B. More recently, Christie et al. (2012) derived the mean (median) CO depletion factor of 19 (10) towards starless cores in the NGC 2024 region of Orion B. We note that in Paper III, where we also employed APEX/C17O observations, we derived the value towards a position lying north of the 350-m peak of SMM 6a (where we now obtain the value ). One would expect to see stronger depletion towards the denser dust peak, but there are two reasons that explain this discrepancy: i) the C17O column densities in Paper III were derived through non-LTE RADEX analysis (van der Tak et al. (2007)), and ii) the H2 column densities were computed from the LABOCA 870-m peak flux densities assuming a thick ice mantle dust model of OH94 and a dust-to-gas ratio of 1/100 (see Appendix A).
When CO molecules freeze out on the surface of dust grains, the rate of gas-phase deuterium fractionation increases (e.g., Dalgarno & Lepp (1984)). The reason for this is that the main destruction path of H2D+, namely , is no longer effective, enabling H2D+ to donate its deuteron to other species (e.g., ). The levels of N2D+/N2H+ deuteration we derive here, , are relatively high compared to those found in other studies of starless cores. For example, Crapsi et al. (2005) found N2D+/N2H+ column density ratios in the range for their sample of starless/prestellar cores. Friesen et al. (2013) derived the values towards starless and protostellar cores in Perseus with no significant difference between the two types of objects. Through radiative transfer modelling of the starless core L183, Pagani et al. (2007) derived a deuteration level of at the CO-depleted core centre, exceeding the highest value found in the present study. As for , a high value of deuteration () was derived in Paper III towards the edge of SMM 6. Again, the column density calculations were based on RADEX analysis (N2H+) and LTE modelling with CLASS/Weeds (N2D+), and are therefore not directly comparable with the present results.
The deuterium fractionation of N2H+ and the amount of CO depletion are found to be positively correlated in starless/prestellar cores and the envelopes of Class 0 protostars (e.g, Crapsi et al. (2004), 2005; Emprechtinger et al. (2009)). This is not evident among our condensations. In fact, the most CO-depleted fragment, SMM 6a, shows the lowest level of deuteration. Our source sample is, however, very small, and within the error bars the values of and are comparable to each other, suggesting that they are in a similar stage of chemical and dynamical evolution. This conforms to the scenario where the condensations were formed simultaneously via core fragmentation. The high levels of molecular D/H ratio suggest that they are highly evolved, and possibly at the onset of protostellar collapse. This seems to contradict the low depletion factors in the condensations, but as discussed above we are very likely underestimating the values.
6 Summary and conclusions
We have used the APEX telescope to observe the molecular-line transitions C17O, N2H, and N2D towards the low-mass condensations inside the prestellar core Ori B9–SMM 6 which were discovered by our previous SABOCA 350-m imaging of the core (Paper III). The present work is one of the first studies of the dynamics of subfragments within a prestellar core.
The condensations were likely formed as a result of Jeans-type fragmentation of the parent core. Based on the C17O velocity dispersion data, we estimate that the fragmentation timescale of the filamentary parent core is yr. The condensations show only subsonic internal non-thermal motions ( km s-1 if K), and most of them are likely to be gravitationally bound. The condensation-to-condensation kinematics was investigated by employing the velocity information provided by the high-density tracer N2H. The estimated timescale required for the condensations to coalesce is a few Myr, which is much longer than their free-fall timescale. It is therefore unlikely that the subfragments will have time to coalesce before collapsing into protostars or proto-brown dwarfs, or fragment even further down to planetary-mass objects. Significant accretion in a competitive fashion between the condensations from the parent core’s mass reservoir is also unlikely. The reason for this is that the condensations’ self-gravity is expected to lead to a much higher (by a factor of ) mass infall rate than what is provided by competitive-like process.
The present molecular data were also used to study the amount of CO depletion and deuterium fractionation in the condensations. The CO depletion factors we derive, , do not suggest any significant CO freeze-out. However, these values are based on the canonical CO abundance of relative to H2, whereas in Orion B this value can be considerably higher (by a factor of ). Therefore, at least an intermediate level of CO depletion seems possible in the condensations. The CO depletion timescale for the condensations ( yr) is shorter than the fragmentation timescale (by a factor of ) and the free-fall time of the condensations ( yr). Higher-resolution observations would undoubtedly reveal more CO-depleted condensation interiors. The derived N2H+ and N2D+ column densities lie in the range and cm-2, and the corresponding fractional abundances are and , respectively. The deuterium fractionation of N2H+, or the N2D+/N2H+ column density ratio, lies in the range . This is a stronger level of deuteration than is typically observed in starless/prestellar cores and should require significant gas-phase depletion of CO. The very high molecular deuteration observed towards the condensations suggests that they are in an advanced stage of chemical evolution and possibly on the verge of gravitational collapse. The actual fate of the subfragments, i.e., whether they can collapse into protostellar or substellar objects, remains to be elucidated. The lowest-mass condensations within SMM 6 could be the precursor sites of brown dwarf formation.
Acknowledgements.
We are grateful to the staff at the APEX telescope for performing the service-mode heterodyne observations presented in this paper. We also appreciate the positive comments and insight of the anonymous referee. O. M. acknowledges the Academy of Finland for the financial support through grant 132291. S. S. R. O. acknowledges support from NASA through Hubble Fellowship grant HF-51311. This research has made use of NASA’s Astrophysics Data System and the NASA/IPAC Infrared Science Archive, which is operated by the JPL, California Institute of Technology, under contract with the NASA. SPIRE has been developed by a consortium of institutes led by Cardiff Univ. (UK) and including: Univ. Lethbridge (Canada); NAOC (China); CEA, LAM (France); IFSI, Univ. Padua (Italy); IAC (Spain); Stockholm Observatory (Sweden); Imperial College London, RAL, UCLMSSL, UKATC, Univ. Sussex (UK); and Caltech, JPL, NHSC, Univ. Colorado (USA). This development has been supported by national funding agencies: CSA (Canada); NAOC (China); CEA, CNES, CNRS (France); ASI (Italy); MCINN (Spain); SNSB (Sweden); STFC, UKSA (UK); and NASA (USA).References
- André et al. (2007) André, P., Belloche, A., Motte, F., & Peretto, N. 2007, A&A, 472, 519 (ABMP07)
- André et al. (2009) André, P., Basu, S., & Inutsuka, S. 2009, in Structure Formation in Astrophysics, ed. Chabrier, G., Cambridge Univ. Press, p. 254
- André et al. (2010) André, P., Men’shchikov, A., Bontemps, S., et al. 2010, A&A, 518, L102
- André et al. (2012) André, P., Ward-Thompson, D., & Greaves, J. 2012, Science, 337, 69
- Arzoumanian et al. (2011) Arzoumanian, D., André, P., Didelon, P., et al. 2011, A&A, 529, L6
- Bastien et al. (1991) Bastien, P., Arcoragi, J.-P., Benz, W., et al. 1991, ApJ, 378, 255
- Belitsky et al. (2007) Belitsky, V., Lapkin, I., Vassilev, V., et al. 2007, in Proceedings of joint 32nd International Conference on Infrared Millimeter Waves and 15th International Conference on Terahertz Electronics, September 3-7, 2007, City Hall, Cardiff, Wales, UK, pp. 326-328
- Bergin & Tafalla (2007) Bergin, E. A., & Tafalla, M. 2007, ARA&A, 45, 339
- Bertoldi & McKee (1992) Bertoldi, F., & McKee, C. F. 1992, ApJ, 395, 140
- Bonnell et al. (2001) Bonnell, I. A., Bate, M. R., Clarke, C. J., & Pringle, J. E. 2001, MNRAS, 323, 785
- Bonnell & Bate (2006) Bonnell, I. A., & Bate, M. R. 2006, MNRAS, 370, 488
- Caselli et al. (1999) Caselli, P., Walmsley, C. M., Tafalla, M., et al. 1999, ApJ, 523, L165
- Caselli et al. (2002) Caselli, P., Benson, P. J., Myers, P. C., & Tafalla, M. 2002, ApJ, 572, 238
- Chen & Arce (2010) Chen, X., & Arce, H. G. 2010, ApJ, 720, L169
- Christie et al. (2012) Christie, H., Viti, S., Yates, J., et al. 2012, MNRAS, 422, 968
- Crapsi et al. (2004) Crapsi, A., Caselli, P., Walmsley, C. M., et al. 2004, A&A, 420, 957
- Crapsi et al. (2005) Crapsi, A., Caselli, P., Walmsley, C. M., et al. 2005, ApJ, 619, 379
- Dalgarno & Lepp (1984) Dalgarno, A., & Lepp, S. 1984, ApJ, 287, L47
- Draine (2011) Draine, B. T. 2011, Physics of the Interstellar and Intergalactic Medium, Princeton University Press
- Dubernet et al. (2013) Dubernet, M. L., Alexander, M. H., Ba, Y. A., et al. 2013, A&A, 553, A50
- Duchêne & Kraus (2013) Duchêne, G., & Kraus, A. L. 2013, ARA&A, submitted, arXiv:1303.3028
- Emprechtinger et al. (2009) Emprechtinger, M., Caselli, P., Volgenau, N. H., et al. 2009, A&A, 493, 89
- Fisher (2004) Fisher, R. T. 2004, ApJ, 600, 769
- Fontani et al. (2006) Fontani, F., Caselli, P., Crapsi, A., et al. 2006, A&A, 460, 709
- Fontani et al. (2012) Fontani, F., Giannetti, A., Beltrán, M. T., et al. 2012, MNRAS, 423, 2342
- Frerking et al. (1982) Frerking, M. A., Langer, W. D., & Wilson, R. W. 1982, ApJ, 262, 590
- Friesen et al. (2013) Friesen, R. K., Kirk, H. M., & Shirley, Y. L. 2013, ApJ, 765, 59
- Fuller & Ladd (2002) Fuller, G. A., & Ladd, E. F. 2002, ApJ, 573, 699
- Goodwin et al. (2007) Goodwin, S. P., Kroupa, P., Goodman, A., & Burkert, A. 2007, in Protostars and Planets V, eds. Reipurth, B., Jewitt, D, and Keil, K. (Tucson: Univ. of Arizona Press), p. 133
- Goodwin et al. (2008) Goodwin, S. P., Nutter, D., Kroupa, P., et al. 2008, A&A, 477, 823
- Güsten et al. (2006) Güsten, R., Nyman, L. Å., Schilke, P., et al. 2006, A&A, 454, L13
- Hacar & Tafalla (2011) Hacar, A., & Tafalla, M. 2011, A&A, 533, A34
- Hartmann (2002) Hartmann, L. 2002, ApJ, 578, 914
- Hill et al. (2011) Hill, T., Motte, F., Didelon, P., et al. 2011, A&A, 533, A94
- Hirota et al. (2004) Hirota, T., Maezawa, H., & Yamamoto, S. 2004, ApJ, 617, 399
- Inutsuka & Miyama (1992) Inutsuka, S.-I., & Miyama, S. M. 1992, ApJ, 388, 392
- Kamazaki et al. (2001) Kamazaki, T., Saito, M., Hirano, N., & Kawabe, R. 2001, ApJ, 548, 278
- Kauffmann et al. (2008) Kauffmann, J., Bertoldi, F., Bourke, T. L., et al. 2008, A&A, 487, 993
- Kauffmann et al. (2011) Kauffmann, J., Bertoldi, F., Bourke, T. L., et al. 2011, MNRAS, 416, 2341
- Kirk et al. (2007) Kirk, H., Johnstone, D., & Tafalla, M. 2007, ApJ, 668, 1042
- Kirk et al. (2009) Kirk, J. M., Crutcher, R. M., & Ward-Thompson, D. 2009, ApJ, 701, 1044
- Kirk et al. (2010) Kirk, H., Pineda, J. E., Johnstone, D., & Goodman, A. 2010, ApJ, 723, 457
- Kirk et al. (2013) Kirk, H., Myers, P. C., Bourke, T. L., et al. 2013, ApJ, 766, 115
- Klein et al. (2012) Klein, B., Hochgürtel, S., Krämer, I., et al. 2012, A&A, 542, L3
- Kraus & Hillenbrand (2012) Kraus, A. L., & Hillenbrand, L. A. 2012, ApJ, 757, 141
- Kuiper et al. (1996) Kuiper, T. B. H., Langer, W. D., & Velusamy, T. 1996, ApJ, 468, 761
- Lacy et al. (1994) Lacy, J. H., Knacke, R., Geballe, T. R., & Tokunaga, A. T. 1994, ApJ, 428, L69
- Ladd et al. (1998) Ladd, E. F., Fuller, G. A., and Deane, J. R. 1998, ApJ, 495, 871
- Langer et al. (1995) Langer, W. D., Velusamy, T., Kuiper, T. B. H., et al. 1995, ApJ, 453, 293
- Larson (1985) Larson, R. B. 1985, MNRAS, 214, 379
- Léger (1983) Léger, A. 1983, A&A, 123, 271
- Lemme et al. (1995) Lemme, C., Walmsley, C. M., Wilson, T. L., & Muders, D. 1995, A&A, 302, 509
- Luhman et al. (2009) Luhman, K. L., Mamajek, E. E., Allen, P. R., et al. 2009, ApJ, 691, 1265
- Matzner & McKee (2000) Matzner, C. D., & McKee, C. F. 2000, ApJ, 545, 364
- (55) Miettinen, O. 2012a, A&A, 540, A104
- (56) Miettinen, O. 2012b, A&A, 545, A3
- Miettinen & Offner (2013) Miettinen, O., & Offner, S. S. R. 2013, A&A, in press, arXiv:1304.0565
- Miettinen et al. (2009) Miettinen, O., Harju, J., Haikala, L. K., Kainulainen, J., & Johansson, L. E. B. 2009, A&A, 500, 845 (Paper I)
- Miettinen et al. (2010) Miettinen, O., Harju, J., Haikala, L. K., & Juvela, M. 2010, A&A, 524, A91 (Paper II)
- Miettinen et al. (2012) Miettinen, O., Harju, J., Haikala, L. K., & Juvela, M. 2012, A&A, 538, A137 (Paper III)
- Mollière & Mordasini (2012) Mollière, P., & Mordasini, C. 2012, A&A, 547, A105
- Nakamura et al. (2012) Nakamura, F., Takakuwa, S., & Kawabe, R. 2012, ApJ, 758, L25
- Offner et al. (2008) Offner, S. S. R., Krumholz, M. R., Klein, R. I., & McKee, C. F. 2008, AJ, 136, 404
- Offner et al. (2009) Offner, S. S. R., Hansen, C. E., & Krumholz, M. R. 2009, ApJ, 704, L124
- Offner et al. (2010) Offner, S. S. R., Kratter, K. M., Matzner, C. D., Krumholz, M. R., & Klein, R. I. 2010, ApJ, 725, 1485
- Ossenkopf & Henning (1994) Ossenkopf, V., & Henning, T. 1994, A&A, 291, 943 (OH94)
- Ostriker (1964) Ostriker, J. 1964, ApJ, 140, 1056
- Pagani et al. (2007) Pagani, L., Bacmann, A., Cabrit, S., & Vastel, C. 2007, A&A, 467, 179
- Pagani et al. (2009) Pagani, L., Daniel, F., and Dubernet, M.-L. 2009, A&A, 494, 719
- Palmeirim et al. (2013) Palmeirim, P., André, P., Kirk, J., et al. 2013, A&A, 550, A38
- Peng et al. (1998) Peng, R., Langer, W. D., Velusamy, T., et al. 1998, ApJ, 497, 842
- Raghavan et al. (2010) Raghavan, D., McAlister, H. A., Henry, T. J., et al. 2010, ApJS, 190, 1
- Rawlings et al. (1992) Rawlings, J. M. C., Hartquist, T. W., Menten, K. M., & Williams, D. A. 1992, MNRAS, 255, 471
- Savva et al. (2003) Savva, D., Little, L. T., Phillips, R. R., & Gibb, A. G. 2003, MNRAS, 343, 259
- Schöier et al. (2005) Schöier, F. L., van der Tak, F. F. S., van Dishoeck, E. F., and Black, J. H. 2005, A&A, 432, 369
- Schnee et al. (2010) Schnee, S., Enoch, M., Johnstone, D., et al. 2010, ApJ, 718, 306
- Shu (1977) Shu, F. H. 1977, ApJ, 214, 488
- Stamatellos & Whitworth (2003) Stamatellos, D., & Whitworth, A. P. 2003, A&A, 407, 941
- Stamatellos & Whitworth (2009) Stamatellos, D., & Whitworth, A. P. 2009, MNRAS, 392, 413
- Tafalla & Santiago (2004) Tafalla, M., & Santiago, J. 2004, A&A, 414, L53
- Tafalla et al. (2004) Tafalla, M., Myers, P. C., Caselli, P., & Walmsley, C. M. 2004, A&A, 416, 191
- Takakuwa et al. (1998) Takakuwa, S., Mikami, H., & Saito, M. 1998, ApJ, 501, 723
- Takakuwa et al. (2003) Takakuwa, S., Kamazaki, T., Saito, M., & Hirano, N. 2003, ApJ, 584, 818
- Tohline (2002) Tohline, J. E. 2002, ARA&A, 40, 349
- van der Tak et al. (2007) van der Tak, F. F. S., Black, J. H., Schöier, F. L., et al. 2007, A&A, 468, 627
- (86) Vassilev, V., Meledin, D., Lapkin, I., et al. 2008a, A&A, 490, 1157
- (87) Vassilev, V., Henke, D., Lapkin, I., et al. 2008b, IEEE Microwave and Wireless Components Letters, pp. 55-60, Vol. 18, Number 1
- Ward-Thompson et al. (1994) Ward-Thompson, D., Scott, P. F., Hills, R. E., & André, P. 1994, MNRAS, 268, 276
- Whitworth & Stamatellos (2006) Whitworth, A. P., & Stamatellos, D. 2006, A&A, 458, 817
- Williams et al. (1994) Williams, J. P., de Geus, E. J., & Blitz, L. 1994, ApJ, 428, 693
- Wiseman & Ho (1998) Wiseman, J. J., & Ho, P. T. P. 1998, ApJ, 502, 676
Appendix A Revision of core/condensation properties presented in Paper III
In Paper III, the condensation masses and densities were estimated assuming that equaled the derived towards the selected position near the edge of SMM 6, i.e., K. However, all the subcondensations except SMM 6a lie outside the beam of the NH3 measurements used to derive . Moreover, is expected to be lower in the embedded small condensations because they are better shielded from the external dust heating radiation field. On these grounds, we revise the temperature-dependent condensation properties by assuming that K. This seems a reasonable choice given that the gas temperature is about 11 K at the core edge.
In addition, it was previously assumed that the 350-m dust mass absorption (or emission) coefficient, i.e., the dust opacity per unit dust mass, was cm2 g-1. This value was interpolated from the widely used Ossenkopf & Henning (1994, hereafter OH94) model describing graphite-silicate dust grains that have coagulated and accreted thick ice mantles over a period of yr at a gas density of cm-3. If we assume that grains have thin ice mantles, which might be more appropriate here (e.g., Stamatellos & Whitworth (2003) and references therein)131313The assumption of thin ice mantles is supported by the fact that no significant CO depletion is found in the present study (see Sect. 4.6)., is decreased to 7.84 cm2 g-1. In Paper III, the dust-to-gas ratio was assumed to be 1/100. However, this value refers to the canonical dust-to-hydrogen mass ratio, (e.g., Draine (2011); Table 23.1 therein). If we assume solar composition, i.e., the mass fractions for hydrogen, helium, and heavier elements are , , and , respectively, the ratio of total mass (H+He+metals) to hydrogen mass is . The total dust-to-gas mass ratio is therefore . We note that for the assumed gas composition, the mean molecular weight per free particle is and that per H2 molecule is (Kauffmann et al. (2008); Appendix A.1 therein).
The masses (), peak beam-averaged H2 column densities [], and averaged H2 number densities [] were computed using the standard optically thin dust emission formulation [see, e.g., Eqs. (2) and (3) in Paper I, and Eq. (1) in Paper III]. The results are given in Table 1. The uncertainties in and were propagated from the uncertainties in the integrated flux density and the peak surface brightness, respectively. We note that the uncertainty in dust opacity, which is likely a factor , is the major source of error in the mass and column density estimate. The error in was propagated from that of .
We note that the total mass of the SMM 6 core was previously determined from the LABOCA 870-m emission adopting the thick ice mantle model of OH94, in which case cm2 g-1. If we employ the above thin ice mantle model, is 1.38 cm2 g-1. Moreover, the 870-m flux density of the source, when integrated inside the 0.09 Jy beam-1 or contour of the re-reduced LABOCA map (see Miettinen & Offner (2013)), is Jy. For K and , these revisions yield a mass of M☉, a factor of 1.4 lower than reported previously (see Paper II). The discrepancy mostly stems from the larger area previously used to compute . The virial parameter of the core from Paper II is accordingly revised to , which still satisfies the gravitational boundedness condition of and is very close to virial equilibrium (). Therefore, the source can be considered a candidate prestellar core (cf. Sect. 4.2).
The projected length of the SMM 6 filament along its long axis, as measured from the Herschel 250-m emission shown in Fig. 1, is about or pc. This corresponds to the extent of the LABOCA 870-m emission (Paper III; Fig. 9 therein). The corresponding mass per unit length, or line mass, is M☉ pc-1.