Optically probing long-range spatial correlation and symmetry in complex biophotonic architectures on the transparent insect wings
Pramod Kumara†, Danish Shamoona, Dhirendra P. Singha, Sudip Mandalb, Kamal P. Singha∗
aFemtosecond Laser Laboratory, Department of Physical Sciences, Indian Institute of Science Education and Research (IISER) Mohali, Manauli-140306, Punjab, India.
bDepartment of Biological Sciences, Indian Institute of Science Education and Research (IISER) Mohali, Manauli-140306, Punjab, India.
a∗ kpsingh@iisermohali.ac.in
a†pramod@iisermohali.ac.in
Abstract
We experimentally probe complex bio-photonic architecture of microstructures on the transparent insect wings by a simple, non-invasive, real time optical technique. A stable and reproducible far-field diffraction pattern in transmission was observed using collimated cw and broadband fs pulses. A quantitative analysis of the observed diffraction pattern unveiled a new form of long-range semi-periodic order of the microstructures over scale. These observations agree well with Fourier analysis of SEM images of the wing taken at various length scales. We propose a simple quantitative model based on optical diffraction by an array of non-overlapping microstructures with minimal disorder which supports our experimental observations. Two different applications of our techniques are demonstrated. First, by scanning the laser beam across the wing sample we observed a rotation of the original diffraction profile which gives direct signature of organizational symmetry of microstructures. Second, we report the first optical detection of reorganization in the photonic architecture on the Drosophila wings by various genetic mutations. These results have potentials for design and development of diffractive optical components for applications and identifying routes to genetic control of biomemetic devices.
OCIS codes: (140.7260) Photonic crystal; (050.5298) Diffraction; (050.1940), Fourior optics; (070.0070), Nanophtonics and photonics crystal;(350.4238).
References and links
- [1] P. Vukusic and J. Roy Sambles, “Photonic structures in biology,” Nature 424, 852 (2003).
- [2] Y. Bar-cohen, Biomimetics: Nature-Based Innovation, CRC Press, Taylor & Francis Group, Boca Raton, Florida, 1-788 (2011).
- [3] Laszlo, Peter Biro and Jean-Pol Vigneron, “Photonic nanoarchitectures in butterflies and beetles: valuable sources for bioinspiration, ” Laser Photonics Rev. 5, No. 1, 27-51 (2011).
- [4] S. Kinoshita and S. Yoshioka, “Structural Colors in Nature: The Role of Regularity and Irregularity in the Structure,” Chem Phys Chem 6, 1442-1459 (2005).
- [5] C. Pouya, D. G. Stavenga and P. Vukusic, “Discovery of ordered and quasi-ordered photonic crystal structures in the scales of the beetle Eupholus magnificus,” Opt. Expr. 19, 11355 (2011).
- [6] A. K. Hafiz and R. Ghosh, “Reflection and transmission spectra for ultrashort pulse propagation in a one-dimensional nonlinear photonic crystal,” J. Opt. Soc. Am. B 23, 1091-1098 (2006).
- [7] S. Yoshioka, T. Nakano, Y. Nozue and S. Kinoshita, “Coloration using higher order optical interference in the wing pattern of the Madagascan sunset moth, ” J. R. Soc. Interface, 5, 457-464 (2008).
- [8] F. Liu, B. Dong, F. Zhao, X. Hu, X. Liu, and J. Zi, “Ultranegative angular dispersion of diffraction in quasiordered biophotonic structures, ” Opt. Expr. 19, 7750-55 (2011).
- [9] E. Van Hooijdonk, C. Barthou, Jean P. Vigneron, and S. Berthier, “ Detailed experimental analysis of the structural fluorescence in the butterfly Morpho sulkowskyi (Nymphalidae), ” Journal of Nanophotonics 5, 053525 (2011).
- [10] Stéphanie M. Doucet and Melissa G Meadows, “Iridescence: a functional perspective,” J. R. Soc. Interface 6 115-132 (2009).
- [11] S. Yoshioka and S. Kinoshita, “Polarization-sensitive color mixing in the wing of the Madagascan sunset moth, ” Opt. Expr. 15, 2691 (2007).
- [12] K. Liu, L. Jiang, “Bio-inspired design of multiscale structures for function integration, ” Nano Today 6, 155—175 (2011).
- [13] Shao-Hui Kang, Tzu-Yao Tai, Te-Hua Fang, “Replication of butterfly wing microstructures using molding lithography, ” Current Applied Physics 10, 625-630 (2010).
- [14] Valerie R. Binetti, Jessica D. Schiffman, Oren D. Leaffer, Jonathan E. Spanier and Caroline L. Schauer, “The natural transparency and piezoelectric response of the Greta oto-butterfly wing, ” Integr. Biol. 1, 324-329 (2009).
- [15] E. Shevtsova, C. Hansson, Daniel H. Janzen, and Jostein Kjærandsen, “Stable structural color patterns displayed on transparent insect wings, ” Proc. Nat. Acad. sci. (PNAS) 26, 668-673 (2011).
- [16] A. Bay, N. André, Michael Sarrazin, Ali Belarouci, Vincent Aimez, Laurent A. Francis, and Jean Pol Vigneron, “Optimal overlayer inspired by Photuris firefly improves light-extraction efficiency of existing light-emitting diodes, ” Opt. Expr. 21, 179 (2013).
- [17] I. R. Hooper, P. Vukusic, and R. J. Wootton, “Detailed optical study of the transparent wing membranes of the dragonfly Aeshna cyanea,” Opt. Expr. 14, 4891-4897 (2006).
- [18] M. Kolle, Pedro M. Salgard-Cunha, Maik R. J. Scherer, Fumin Huang, Pete Vukusic, Sumeet Mahajan, Jeremy J. Baumberg and Ullrich Steiner, “Mimicking the colourful wing scale structure of the Papilio blumei butterfly, ” Nature Nanotech 5, 511-515 (2010).
- [19] Shinya Yoshioka and Shuichi Kinoshita, “Wavelength-selective and anisotropic light-diffusing scale on the wing of the Morpho butterfly, ” Proc. R. Soc. Lond. B 271, 581-587 (2004).
- [20] David Mas, Javier Garcia, Carlos Ferreira, Luis M. Bernardo, Francisco Marinho, “Fast algorithms for free-space diffraction patterns calculation, ”Optics Communications 227, Issues 4–6, 245–258 (2003).
- [21] D Mas ,J Pérez, C Hernández, C Vázquez, J.J Miret, C Illueca, “Fast numerical calculation of Fresnel patterns in convergent systems, ” Optics Communications 227, Issues 4–6, 245–258 (2003).
- [22] Nan Gao, Hailiang Li, Xiaoli Zhu, Yilei Hua, and Changqing Xie,
- [23] D Mas ,J Pérez, C Hernández, C Vázquez, J.J Miret, C Illueca, “Quasi-periodic gratings: diffraction orders accelerate along curves, ” Opt. Lett. 38, 2829-2831 (2013).
- [24] Heeso Noh, S. FattLiew, V. Saranathan, Richard O. Prum, Simon G. J. Mochrie , Eric R. Dufresne and Hui Cao, “Double scattering of light from Biophotonic Nanostructures with short-range order, ” Opt. Expr. 18, 11942 (2010).
- [25] P. Kumar, D. Shamoon, D.P. Singh, S. Mandal and K. P. Singh, “Unveiling Spatial Correlations in Biophotonic Architecture of Transparent Insect Wings,” In Proceedings of the International Conference on Photonics, Optics and Laser Technology, pages 106-110 (2013). DOI: 10.5220/0004339001060110.
- [26] Andrew D. Pris, Y. Utturkar, C. Surman, William G. Morris, Alexey Vert, S. Zalyubovskiy, Tao Deng, Helen T. Ghiradella and Radislav A. Potyrailo, “Towards high-speed imaging of infrared photons with bio-inspired nanoarchitectures, ” Nature Photonics 6, 195–200 (2012).
- [27] U. Fuchs, Uwe D. Zeitner and Andreas Tunnermann, “Ultra-short pulse propagation in complex optical systems, ” Opt. Expr. 13, 3852 (2005).
- [28] T. Wagner, C. Neinhuis, and W. Barthlott, “ Wettability and contaminability of insect wings as a function of their surface sculptures, ” ActaZoologica 77, 213-225 (1996).
- [29] H. Ghiradella, and W. Radigan, “Collembolan cuticle: wax layer and anti-wetting properties, ” J. Insect Physiol 20, 301–306 (1974).
- [30] S. P. Sane, “ The aerodynamics of insect flight,” J. Exp. Biol. 206, 4191-4208 (2003).
- [31] A. Arora, P. Kumar, J. Bhagavathi, K. P. Singh, G. Sheet, “Sub-microscopic modulation of mechanical properties in transparent insect wings,” arXiv:1311.4183.
- [32] R. U. Maheswari, N. Takai, and T. Asakura, “Power spectral distributions of dot arrays with Gaussian random spatial fluctuations,” J. Opt. Soc. Am. A9, 1391-1397 (1992).
- [33] Henry Stark, “Some spectral properties of random arrays of grains: Comment,” J. Opt. Soc. Am. 68, 1785-1786 (1978).
- [34] F. Martin and C. Aime, “Some spectral properties of random arrays of grains,” J. Opt. Soc. Am. 69, 1315-1320 (1979).
- [35] R. U. Maheswari, T. Asakura and N. Takai, “Far-field diffraction patterns of a dot array with Gaussian random fluctuations,” Proc. SPIE , Optical Computing 151, 1806 (July 12, 1993).
- [36] H. P. GREINEL, “Diffraction by Rotating, Rectangular Apertures in Astigmatic System,” J. Opt. Soc. Am. 54, 245-246 (1964).
- [37] Xianghui Xiao and Qun Shen, “Wave propagation and phase retrieval in Fresnel diffraction by a distorted-object approach,” Phys. Rev. B 72, 033103 (2005).
- [38] Yaujen Wang and Marija Strojnik, “Experimental investigation of far-field diffraction by means of normally and non-normally illuminated elliptical apertures of wavelength dimension,” Opt. Eng. 33(3), 692-696 (Mar 01, 1994).
- [39] K. Yamamoto , Y. Ichihashi , T. Senoh, R. Oi , T. Kurita , “Calculating the Fresnel diffraction of light from a shifted and tilted plane,” Opt Expr.20,12949-58 (2012).
- [40] liu Z.Y., D. Y. Fam, ”Diffraction characteristics of an ultrashort pulsed beam in the farfield,“ Pure Appl.Opt. 6, 43-47 (1997).
- [41] S. Gustavo . Wiederhecker, L. Chen, A. Gondarenko and M. Lipson, “Controlling photonic structures using optical forces ,” Nature 462, 633-636 (2009).
1 Introduction
Nature has developed a remarkable variety of photonic structures in various insect wings [1, 2, 3]. The cooperation of structural heterogeneities (regularity and irregularity) [4, 5] in these natural bio-photonic architectures at optical wavelength scale interact with light in a specific way to produce various optical effects such as reflection [6], interference [7], diffraction [8] fluorescence [9], iridescence [10], and polarization sensitivity [11]. Compared to the equivalent man-made optical devices, the biophotonic structures often possess greater complexity and could outperform their functions in some cases [2, 12]. Due to the presence of multiple length scales and diversity in their design the optical behavior of such arrangements is still not fully understood.
While the optical effects in the non-transparent wings of the butterfly and beetles have been well studied [3, 5, 11, 13], the transparent wings of many insects (Drosophila, bees, dragonfly) have attracted much less attention. Previous experiments on thin transparent wings observed various interference colours under white light illumination and quantified their transmission and reflection spectra [14, 15]. Recently, the transparent wings of firefly have been exploited in designing and optimizing optical components such as anti-reflection elements in laser diodes [16]. High resolution techniques like scanning electron microscopy (SEM) and atomic force microscopy have resolved structural complexity of transparent wings (of dragonfly) at micro and nano-scale [17]. These studies revealed that the wing surface is decorated with a large number of micro-structures [3, 13, 15, 24]. These microstructures were known to provide anti-wetting, self-cleaning and aerodynamic properties to the wing surface [28, 29, 30]. Recently, modulation of friction and adhesion on these microstuctures was also observed [31]. However, the long-range organizing principles and symmetry of the complex photonic architectue in transparent wings remain unexplored. A knowledge of their organization would be fundamental to understand how these systems have been naturally optimized to coherently manipulate light for various functions [18, 19]. Using high resolution images from SEM/TEM to extract structural order over entire wing surface is not feasible and may even be misleading. Therefore, an efficient and quantitative approach to explore correlations in spatial architecture over the entire length scale of the wing is desired.
One attractive possibility is to exploit high sensitivity of optical method that combines right spectral properties with high spatial coherence such as transmitted diffraction pattern [8, 25]. Remarkably, our technique is very sensitive and efficient to extract in situ structural organization and symmetry of microstructures in a single-shot manner. We demonstrate that variability in the diffraction pattern is directly correlated with arrangements in the spatial distribution of the scales that cover the wing membranes. This optical imaging technique opens new ways for the non-invasive study and classification of different forms of irregularity in structural patterns. The investigation of natural microstructures lead to the knowledge that can be applied to design biomemetic materials with designer photonic properties with reduced engineering effort and cost of their fabrication [2, 5].
The aim of this paper is to address the following questions: Is there any long range ( scale) order and organizational symmetry in the array of microstructures on the transparent insect wing? Can we exploit complex diffraction pattern to quantitatively unveil new features in the arrangement of microstructure array? Answering these questions are crucial to understand design principles and multi-functional role of transparent wings [17, 19, 31]. The paper is organized as follows. In section , we describe our experimental setup. In section , we report experimental observations of the diffraction pattern using various lasers. We also give a theoretical interpretation of these results using SEM analysis of the samples. In section and section we demonstrate applications of the optical techniques by measuring correlated diffraction pattern at various scales in the wing and quantifying the role of genetic mutations on the photonic architecture of the transparent wings of the Drosophila.
2 Experimental set-up
A schematic diagram of our experimental set-up and its actual picture is shown in Fig. 1. In our set-up a collimated laser beam passes through a wing sample that is mounted on a micrometer translation stage. The transmitted laser intensity was captured through the wings by a digital camera and analyzed.
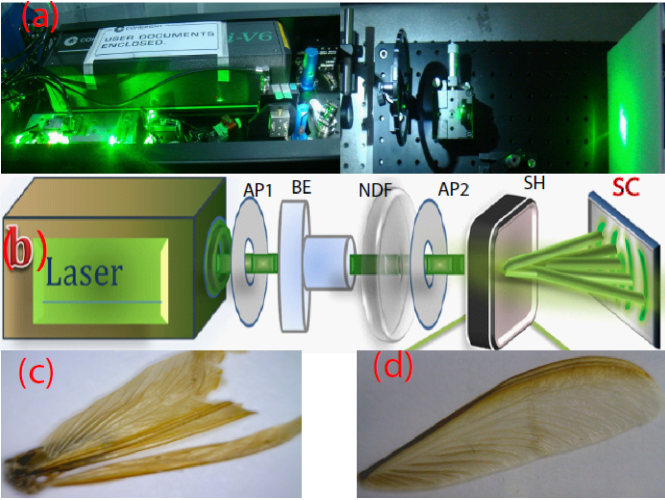
We used both monochromatic cw lasers at two visible wavelengths in red and green ( & ) and femtosecond pulses centered in near IR range . These wavelengths are chosen to match the transparency window of the our wing sample. The typical intensity transmission coefficient of our insect wing is around at these wavelengths. The full-waist of the collimated laser beams was around which is much smaller than the typical wing size . The input beam profile of these lasers is shown in Fig. 2. The far-field diffraction pattern was captured on a white screen fixed at from the wing sample. We have observed that the diffraction pattern is fully developed after few from the wing and it simply diverges thereafter due to geometrical effect. It is worth mentioning that with this simple set-up, no preparation of the wing sample is required. In fact, it can be used for in vivo non-destructive imaging of the wing with the insect alive. The laser powers were very low and no sign of optical damage was seen on the wing surface. To validate the sensitivity of our optical technique we also performed SEM images of the wing surfaces. In addition, we scanned the laser beam across the wing sample and the resulting laser diffraction was recorded in a single-shot manner to probe local variation in the wing structure. We also demonstrate how our optical technique can detect structural reorganization of microstructure array in genetically mutated wings of the Drosophila.
3 Results and discussion
3.1 Observation and analysis of complex diffraction pattern
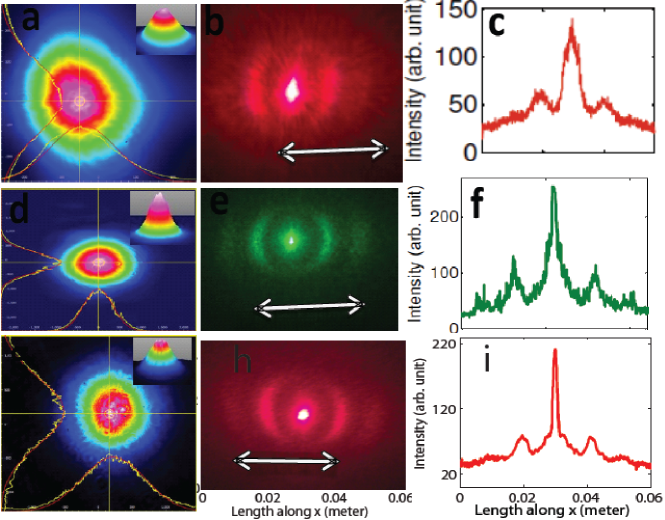
Remarkably, a collimated laser beam ( full waist around ) formed a stable and characteristic diffraction pattern after passing through the transparent wing-sample. The laser powers are around which is below their damage thresholds. The far-field diffraction pattern was observed for (i) broadband femtosecond laser pulses centered at (top row in Fig. 2), (ii) a cw green laser, and (iii) a cw red laser (bottom row in Fig. 2). Note that the intensity profile of the diffraction pattern was recorded on a calibrated screen for all the cases. For nearly Gaussian input beams, the observed intensity pattern exhibited a bright central spot and up to two distinct higher order maxima in the form of curved lobes. These lobes are symmetrically located on both sides of the bright central spot. The femtosecond pulse is used to show the robustness of the diffraction pattern under broadband coherent source in the IR range. We have computed the corresponding spatial frequencies along x and y axes, and , respectively. Here D is the screen to wing distance and x, y are distances measured on the screen from the central spot. The position of the first lobe in the case of cw lasers correspond to spatial frequency of around . These spatial frequencies agree well with our theoretical analysis, as shown later. The corresponding intensity-cuts of the diffraction patterns along x axis (right columns in Fig. 2) also confirm these values.
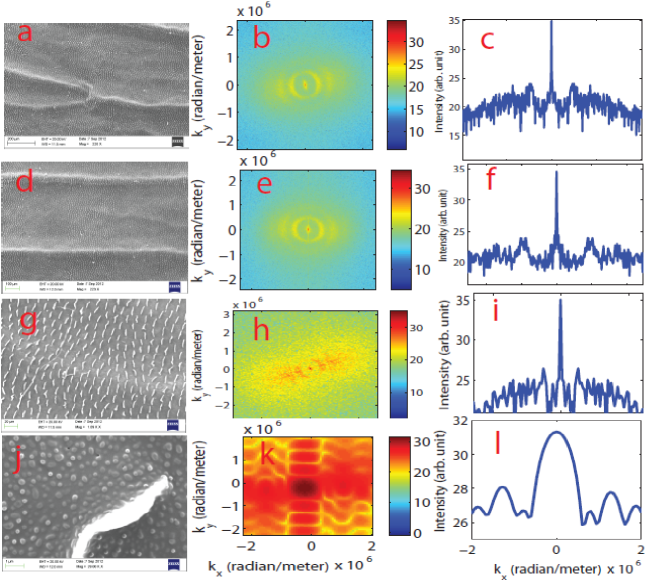
To understand the formation of the diffraction pattern we performed SEM images of the wing surface (Fig. 3). The high resolution SEM images showed that the wing surface is decorated with a large number of non overlapping microstructures. The flat background of the wing exhibits nano-grain like features which are typically smaller than the wavelength of the light. These microstructures were elongated having typical length and width around and , respectively. Note that their dimensions are comparable to the used laser wavelengths, these act as efficient “photonic elements” that diffract light.
To demonstrate how the observed far-field diffraction pattern emerges by a large number of microstructures (typically in beam waist of ) we computed Fast Fourier transforms (FFT) of the SEM images at various scales. The SEM images contained total pixels and it was sampled with the spatial resolution and along x and y axes, respectively. The complimentary Fourier domain then had spatial frequencies and where are integers and determines resolution of the Fourier domain [20, 23]. As we increased the area of SEM image to incorporate more number of microstructures (Fig. 3) the corresponding FFT showed an emergence of the higher order lobes. The corresponding spatial frequency was around that agrees quantitatively with the location of the experimental one. One can define a quasi-periodic function that determines the average spacing between microstructures. As one can see in the SEM image that the quasi-period is a function of position rather than a constant. Therefore, the input beam would be diffracted by an angle [22]. The corresponding average period between the microstructures along the x-axis was around that also agrees well with the SEM image analysis.
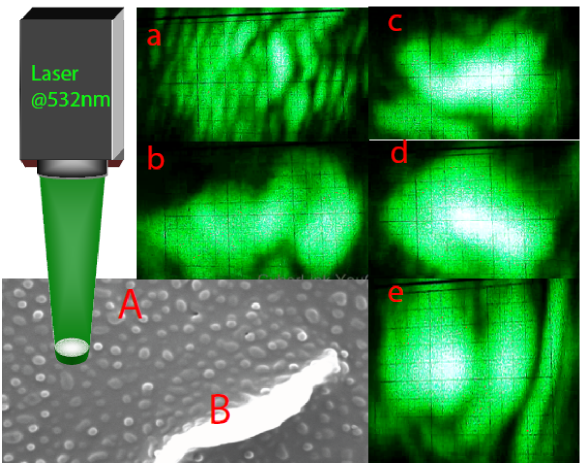
To further prove that the diffraction lobes are due to quasiperiodic organization of microstructure array, we performed experiment using tightly focused laser beam. Using a high numerical aperture (NA 0.2) triplet-lens objective we generated a micro-spot of full width . Note that this spot size is comparable with the typical size of a single microstructure. We recorded the diffraction pattern on a screen kept about away for two different cases when the laser spot is on the microstructrue and when the laser spot is on the background, i.e., between the two microstructures. We observed that these diffraction patterns are qualitatively different compared to the case when we used collimated beam. The FFT of high resolution SEM image with single microstructure also produced a similar complex diffraction pattern that matched with the experimental observations (see Fig. 3 and 4). This demonstrated that the observed diffraction is a result of quasi-periodicity in the array of microstructures. In the following we develop a theoretical model to explain our experimental results.
3.2 Theoretical understanding of the experimental results
We present a simple quantitative model to provide further insight into the experiment by generating the far-field diffraction from a two-dimensional array of non-overlapping microstructures. Each micro-structure was modeled by an amplitude transmission function . The total transmission of the wing was then due to total number of microstructures arranged in a lattice with average distance between them being . Although, a similar jitter model was previously proposed to explain spectral properties of an array of identical nonoverlapping grains [32, 33, 34, 35]. However, we introduce multiple disorders to model the laser diffraction through complex wing surface.
We generated a two-dimensional total brightness distribution T(x,y) by creating square cells, each containing one microstructure, arranged in a rectangular array of size . The distance between two microstructures in the square lattice was along the two orthogonal directions. In the case of perfectly ordered array of identical microstructure, one can write,
| (1) |
where star denotes convolution and is a Dirac delta function centered at .
To model structural organization of microstructures on the wing surface, we added disorder in the shape of each microstruture, their position and orientation. The resulting stochastic two-dimensional brightness function is given by,
| (2) |
where is the position vector of each microstructure, defines a two component stochastic vector quantifying the deviation of their position from their nominal center and is a set of variables determining the shape distortions. The stochastic variables are delta correlated in position as,
| (3) |
where denote the amplitude of the noise along x and y directions.
The Fourier transform of the transmission is given by where denote spatial frequencies [39]. The average normalized far-field diffraction pattern is given by,
| (4) |
where is a proportionality constant. Note that the above equation is usually used for monochromatic incident field and it can be extended to a broadband pulse of width that could lead to further detail of quasi-periodicity [40, 39].
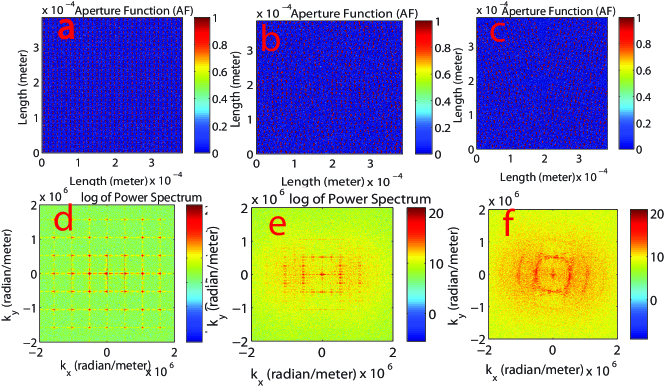
We simulated the above model in Matlab by generating the transmission function in the form of a curved ellipse of about width and about length that is comparable to the dimensions observed in the SEM image. Each microstructure consisted of pixels where each pixel defined resolution. The total number of microstructures in our simulations were more than . We verified that in the case of a perfect square grid of identical microstructures (Eq. 1), the simulated diffraction pattern consisted of ordered spots typical of regular diffraction grating (Fig. 5a, d).
To model our experiment we generated complex aperture functions by adding various kinds of disorders in the shape, orientation and position of each element. In Fig. 5b, we show the disordered array which is produced by adding noise on the shape and orientation of . The variance in the fluctuations in the length and width was and , respectively and their orientation was allowed to fluctuate randomly by . The chosen parameters lie in the range seen in the SEM images. The corresponding far-field diffraction pattern for this organization showed that higher than second order spots vanished but their organization was on the square grid.
Finally, to create the various symmetries in the form of rings we randomly selected several patches and added a global rotation by less than in order to create a wavy pattern on the grid structure. In this case, various symmetries overlapped and produced ring-like pattern similar to the experiment (see Fig. 5c). Note that the location of the first order peak correspond to spatial frequency close to the ones seen in the experiment as well as in the Fourier analysis of the SEM images. Though the minimally stochastic model uses many approximations, it can reproduce key signatures of the experiment quite well.
4 Rotations of the diffraction pattern at various length scales
We can probe local variations in the structural arrangement across the wing by simply scanning the laser beam. This is possible since the beam spot was much smaller than the wing size . To demonstrate this, we recorded the diffraction pattern at various scales by scanning the laser spot along the wing length (Fig. 6). A rotation of the original diffraction pattern was observed for both the pulsed and cw lasers. This behavior directly reflects the local symmetry and its spatial correlation along the entire wing surface. It should be mentioned that one can easily vary the spot size to further probe local and the global organizations in a single shot manner. The observed rotation in the diffraction pattern suggests a systematic rotation in the arrangement of the hooks without much change in their density and shape.
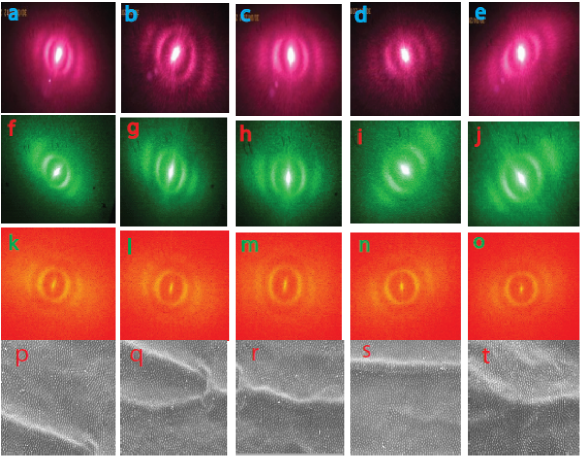
To verify this, we recorded SEM images of various portions of the wing and numerically computed FFT of the images (Fig. 6(k-o)). The SEM-FFT analysis also produced a similar rotation in the diffraction as shown in Fig. 6. This confirmed our optical observation. Therefore, our technique is very attractive and efficient to reveal the complex arrangements of millions of these photonic elements on the wing surface. We have also observed similar results in insect wings of the Drosophila which suggest a generic nature of the reported phenomenon. The functional significance of these rotations and their development aspects requires further experimentations.
5 Genetic control of the photonic architecture
We report the first optical measurements of reorganization in mictrostructure array due to the genetic mutations on the transparent wings of the Drosophila melanogaster. The Drosophila wings are ideal system for this kind of study since development, structure and function of the wings have been studied extensively and the roles of several genetic mutants are well characterized. For our analyses we selected two different mutants, Cyo and vg, that either produces curly wings or generates small stumpy wing rudiments, respectively. The wild type unmutated wings were kept as controls (reference). Although the developmental dynamics of Drosophila wings along with the implications of these mutants on the structural and functional aspect have been explored, much less is known about how these mutations affect organization of the microstructures on the wing surface. Using diffraction pattern in transmission offers us a unique optical technique to make a quantitative comparison among wings produced by various mutations.
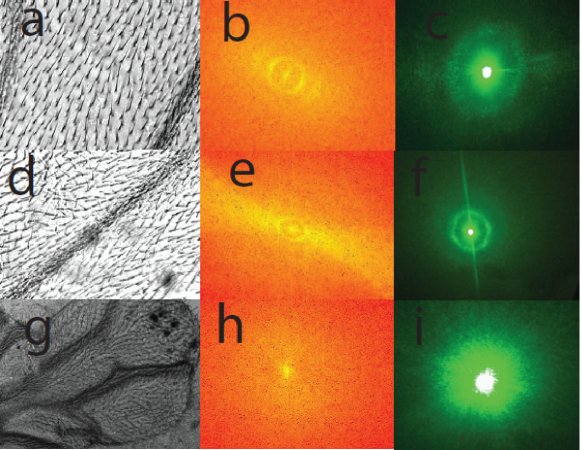
First, we recorded the diffraction pattern from a normal fly-wing as our control. This clearly showed a ring shaped pattern revealing average periodicity of around . Compared to the control wing, in Cyo wings, the diffraction ring became smaller with a weak second order lobe appeared. This suggests that the average periodicity increased and their organization became more ordered compared to the normal wings. In contrast, in vg wings the diffraction pattern was speckle-like without any higher order maxima and minima. This means that in this case both the symmetry and average periodicity is completely absent. Note that if such an information is attempted by SEM imaging, it would be very tedious and inefficient process. This is clearly illustrated in Fig. 7 where SEM images of various mutants are recorded and corresponding FFT is computed. The good matching between computational and experimental patterns again confirmed the implications of this technique. The spatial coherence of the laser and sensitivity of the diffraction pattern offer unique advantage over other methods. This experimental evidence of global correlation and its genetic control could be potentially useful to understand how one can manipulate genes to control the natural photonic architecture as well as for other potential biological applications in understanding structure-function relation in the genetic pathways.
6 Conclusion and outlook
In summary, we show that the diffraction pattern through the transparent insect wings is correlated with the spatial organization of the microstructures at various length scales. We demonstrate that the microstructures on the transparent wings possess a long-range quasi-periodic order and characteristic organizational symmetry as unveiled by an appearance of the stable and robust diffraction pattern. These observations are in quantitative agreement with a Fourier analysis of high resolution SEM images of the wing surface. The existence of average periodicity was also supported by observations of diffraction pattern of single microstructure and background using tightly focused laser beam. Furthermore, we proposed a simple quantitative model to explain our observations that showed the existence of minimal disorder in the microstructure organization. Two different applications of our optical technique were demonstrated. First, by scanning the laser beam across the wing surface, a rotation of the original diffraction pattern was observed that demonstrated symmetry in the spatial organization of microstructures. Second, we reported first optical measurements on how various genetic mutations reorganize the biophotonic architecture.
The proposed optical technique is potentially attractive to quantify natural photonic architecture on a large variety of transparent insect wings in a single-shot manner. These tools would be crucial to understand design principles of photonic crystals with potential for biomimetic applications that may lead to novel optical devices [2, 18, 41]
7 Acknowledgement
We thank the DST and IISER Mohali for supporting this research. Pramod Kumar acknowledges postdoctoral fellowship from IISER Mohali. The invaluable help of Mrs. B. Basoya and Dr. Vinod Kumar are hereby grateful acknowledged. KPS acknowledges DST for financial support.