Hydrodynamical Simulations of the Barred Spiral Galaxy NGC 1097
Abstract
NGC 1097 is a nearby barred spiral galaxy believed to be interacting with the elliptical galaxy NGC 1097A located to its northwest. It hosts a Seyfert 1 nucleus surrounded by a circumnuclear starburst ring. Two straight dust lanes connected to the ring extend almost continuously out to the bar. The other ends of the dust lanes attach to two main spiral arms. To provide a physical understanding of its structural and kinematical properties, two-dimensional hydrodynamical simulations have been carried out. Numerical calculations reveal that many features of the gas morphology and kinematics can be reproduced provided that the gas flow is governed by a gravitational potential associated with a slowly rotating strong bar. By including the self-gravity of the gas disk in our calculation, we have found the starburst ring to be gravitationally unstable which is consistent with the observation in Hsieh et al. (2011). Our simulations show that the gas inflow rate is 0.17 M☉ yr-1 into the region within the starburst ring even after its formation, leading to the coexistence of both a nuclear ring and a circumnuclear disk.
1 Introduction
It has long been recognized that a periodic potential, such as a rotating bar, can drive density waves in a differentially rotating disk and transport gas toward galactic centers (e.g., Athanassoula, 1992; Piner et al., 1995; Yuan & Kuo, 1997; Maciejewski, 2004). As pointed out by Yuan & Kuo (1997), density waves excited by the bar at the outer inner Lindblad resonance (OILR) and the outer Lindblad resonance (OLR) will propagate inward and outward, respectively. The waves excited at the OILR carry negative angular momentum which will be deposited over the annular region covered by the waves during propagation. The disk material there, after losing angular momentum, would flow toward the center. The bar-driven gas transported into the central regions of galaxies can fuel nuclear star formation and active galatic nuclei (AGNs). Indeed, statistical evidence based on the observations of a number of galaxies shows that barred galaxies have a higher fraction of central concentration of molecular gas in their centers than non-barred galaxies (Sakamoto et al., 1999). Their result supports the theory of bar-driven gas transport mentioned above.
Subsequent observations at higher angular resolution were able to resolve the central molecular concentration of galaxies into a wide variety of morphologies. The NUclei of GAlaxies (NUGA) survey revealed, for example, that NGC 7217 has a nuclear ring of 1.8 kpc in diameter and a nuclear spiral (Boone et al., 2004), NGC 4826 has two one-arm trailing spirals at different radii and a lopsided nuclear disk of 40 pc radius (Boone et al., 2004), NGC 4579 has two leading gas lanes inside 500 pc and a 150 pc off-centered ringed disk (García-Burillo et al., 2004), NGC 6951 has two nuclear spiral arms in the inner 700 pc region (García-Burillo et al., 2004), NGC 4321 has two nuclear spiral arms connected to a 150 pc disk (García-Burillo et al., 2005), while NGC 6574 has a nuclear gas bar and spirals (Lindt-Krieg et al., 2008). Many nuclear rings exhibit regions of intense star formation (e.g., Maoz et al., 1996), which suggests that the rings are characterized by sufficiently high surface densities resulting in gravitational instabilities. It is generally believed that such starburst rings are a consequence of the accumulation of inflowing gas and dust driven by a non-axisymmetric potential from a stellar bar.
NGC 1097 is one of the most well-studied galaxies containing a central starburst ring (Hummel et al., 1987; Telesco et al., 1993; Barth et al., 1995; Quillen et al., 1995; Storchi-Bergmann et al., 1996; Kotilainen et al., 2000; Sandstrom et al., 2010). Inside the ring, a relatively strong molecular concentration is detected in 12CO (2-1) emission by Hsieh et al. (2008) using the Submillimeter Array 111The SMA is a joint project between the Smithsonian Astrophysical Observatory and the Academia Sinica Institute of Astronomy and Astrophysics and is funded by the Smithsonian Institution and the Academia Sinica.(Ho et al., 2004). Hence, NGC 1097 is a good candidate to test the theory of bar-driven gas transport. However, the coexistence of the nuclear ring and the circumnuclear disk as observed in NGC 1097 has not yet been seen in previous hydrodynamical simulations of bar galaxies (e.g., Athanassoula, 1992; Wada & Habe, 1992; Piner et al., 1995; Patsis & Athanassoula, 2000; Maciejewski, 2004). In this study, we apply our hydrodynamical model with the self-gravity of the gas to simulate NGC 1097, reproducing its circumnuclear disk, nuclear ring as well as other observed features.
In the next section, the observational data of NGC 1097 are summarized. The numerical method for the hydrodynamical simulations are described in §3. The procedures adopted for the theoretical modeling of the observational data are outlined in §4, and the comparisons of the numerical results with the data are presented in §5. Finally, we conclude in §6.
2 Observational data
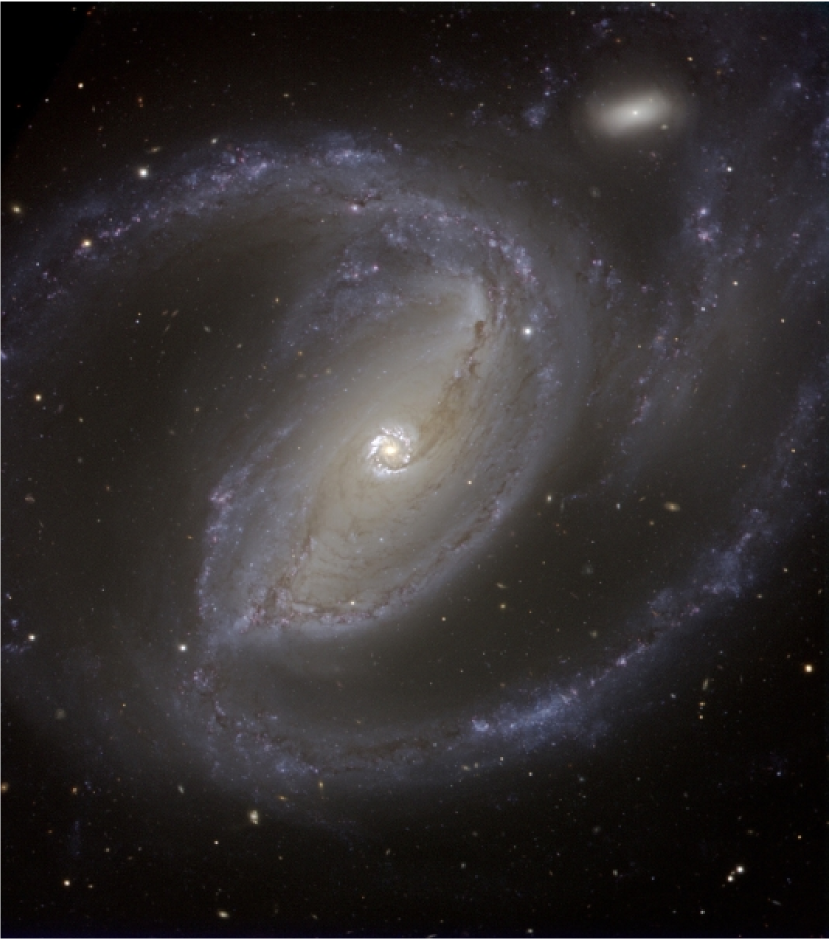
NGC 1097 is a nearby barred spiral galaxy inclined at an angle of 46∘ (Ondrechen et al., 1989). With a redshift of (Koribalski et al., 2004) and Hubble constant of 75 km s-1 Mpc-1, we adopt a distance of 16.96 Mpc, yielding a scale of 1 = 82.2 pc. The galaxy is of type SB(s)b (de Vaucouleurs et al., 1991) or (R)SB(rs)bc (Sandage & Tammann, 1981). Figure 1 shows its optical image taken by the Visible Multi-Object Spectrograph (VIMOS) instrument on the 8.2-m Melipal (Unit Telescope 3) of ESO’s Very Large Telescope. The image reveals a circumnuclear starburst ring, with a radius of 10 (0.82 kpc), connected with a pair of nearly straight dust lanes. The other ends of the dust lanes are attached to two spiral arms that can be traced continuously for more than 270∘ in azimuth. The inner parts of these two spirals trace the boundary of the bar region and form an oval ring-like structure (inner ring). The nucleus of NGC 1097 was originally identified as a LINER (Keel, 1983), however, over the past two decades, it has exhibited Seyfert 1 activities as evidenced by the presence of broad double-peaked Balmer emission lines (Storchi-Bergmann et al., 1993). The starburst ring is luminous at wavelengths including radio (Hummel et al., 1987), mid-infrared (Telesco et al., 1993), optical (Barth et al., 1995; Quillen et al., 1995; Storchi-Bergmann et al., 1996), near-infrared (Kotilainen et al., 2000), and soft X-rays (Perez-Olea & Colina, 1996). It is rich in molecular gas (5.8 108 M⊙; Hsieh et al. (2008)) and has a high star formation rate (3.1 M⊙ yr-1; Hsieh et al. (2011)).
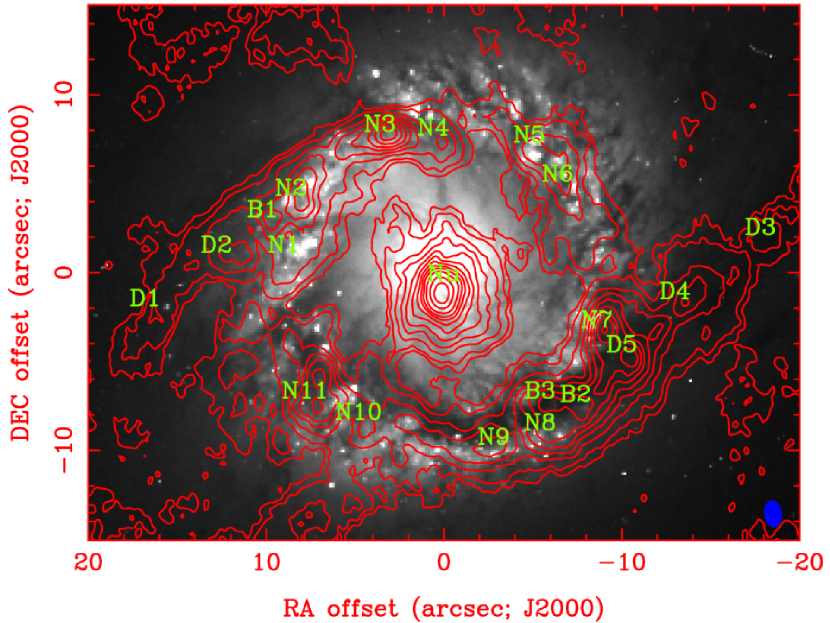
The 12CO (J = 2-1) integrated intensity map of the central region of NGC 1097 (Hsieh et al., 2011) is shown in Figure 2. A relatively strong molecular concentration (radius 300 pc) is detected at the very center surrounded by a weaker molecular ring (radius 820 pc), which spatially coincides with the AGN and the starburst ring respectively. The molecular ring is found to be composed of several knots. The two strongest emission knots are located at the NE and SW sides of the ring in the regions where the dust lanes connect with the ring. Such molecular gas peaks are often seen in barred spiral galaxies, which are known as the twin-peak morphology (e.g, Kenney et al., 1992).
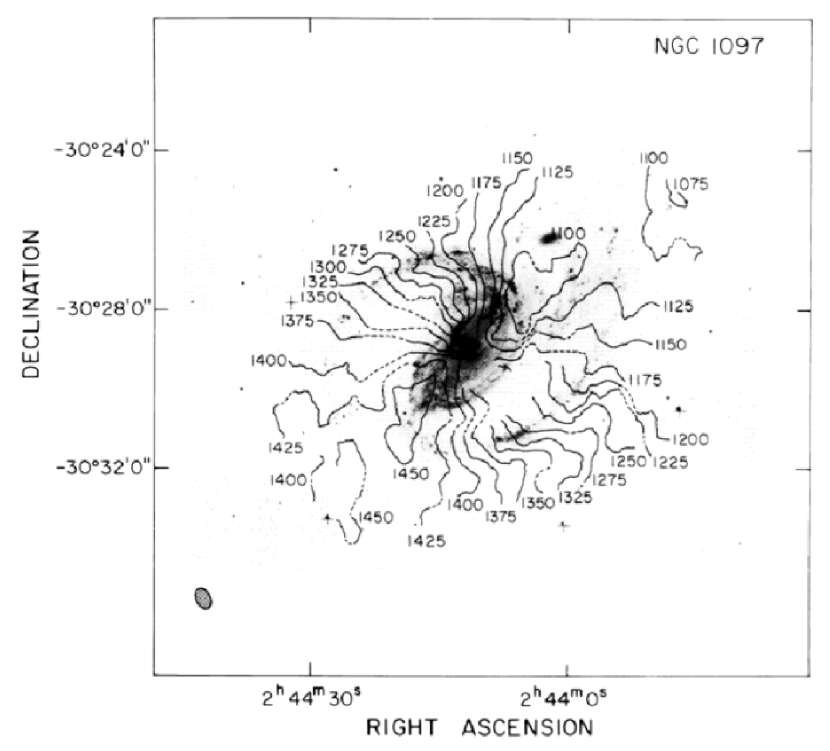
Figure 3 shows the velocity field of the HI observation by Ondrechen et al. (1989). The most striking characteristic in the observation is a series of regular bendings (or wiggles) along the SW arm in the isovelocity contours of the velocity field, which provides evidence for the presence of noncircular gaseous motions. The same characteristic is also present in Higdon & Wallin (2003). However, since the beam size in Higdon & Wallin (2003) is twice of that in Ondrechen et al. (1989), we have adopted the data observed by Ondrechen et al. (1989). The position angle of the line of nodes derived from the HI observation is found to be 134 3∘, while the average inclination obtained by Ondrechen et al. (1989) is 46 5∘.
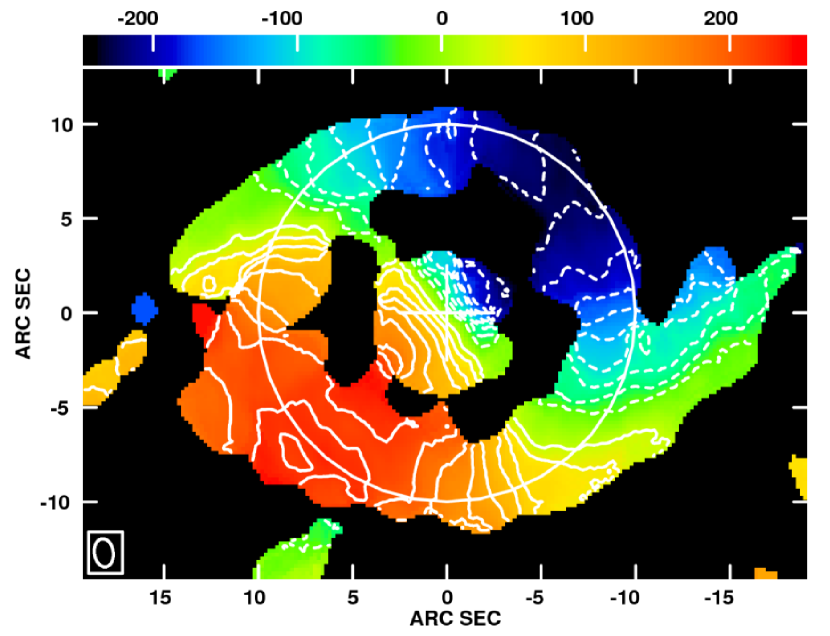
The intensity-weighted 12CO (J = 2-1) mean-velocity map (Hsieh et al., 2011) is shown in Figure 4. Both the central molecular concentration and the molecular ring show an overall velocity gradient in the NW to SE direction along the major axis of the large-scale galactic disk (line of nodes), indicating the differential rotation of the gas disk. The emission is blueshifted on the northwestern side and redshifted on the southeastern side of the center.
The basic parameters for NGC 1097 are summarized in Table 1.
3 Numerical Method
The numerical method for the hydrodynamical simulations used in our study of NGC 1097 is nearly identical as that used in Lin et al. (2011). The simulations were performed with a high-order Godunov code known as Antares (Yuan & Yen, 2005). We only briefly point out here the most notable features of the method. The total gravitational potential in the equation of motion is composed of three components:
| (1) |
The first term, , is a central potential supporting a differentially rotating disk deduced from the observed rotation curve. The second term, , is the dominant second harmonic component of a rotating bar potential taken in the form,
| (2) |
where is the angular speed of the bar. We employ a simple functional form for the amplitude given as:
| (3) |
where , , and = 1.0 kpc. and are both dimensionless. The parameter denotes the radial distance at which the bar potential is a minimum. In order to reduce numerical noise, the amplitude of the bar potential, , is increased gradually from zero to the full value during the initial two rotation periods of the bar. , the last term of , represents the self-gravitational potential of the gaseous disk. In order to include the self-gravity of the gas disk in the calculation, the hydrodynamic code is coupled with a Poisson solver. A description for the method of solution for the Poisson solver in the Antares code can be found in Yen et al. (2012).
The method used in this study differs from that used in Lin et al. (2011) in only four aspects:
1) The initial surface density of the gas was taken to be uniform in Lin et al. (2011), while in this work it is assumed to follow an exponential law of the form
| (4) |
where is the initial surface density at the center, taken to be 15 . The value of is 14 kpc. The total gas mass inside 20 kpc in our simulations is 8.3 109 M☉. For comparison, the total molecular mass of NGC 1097 is 9.4 109 M☉ (Crosthwaite, 2002).
2) The initial settings for the three parameters, and , used in the Elmegreen rotation curve (Elmegreen & Elmegreen, 1990) given by
| (5) |
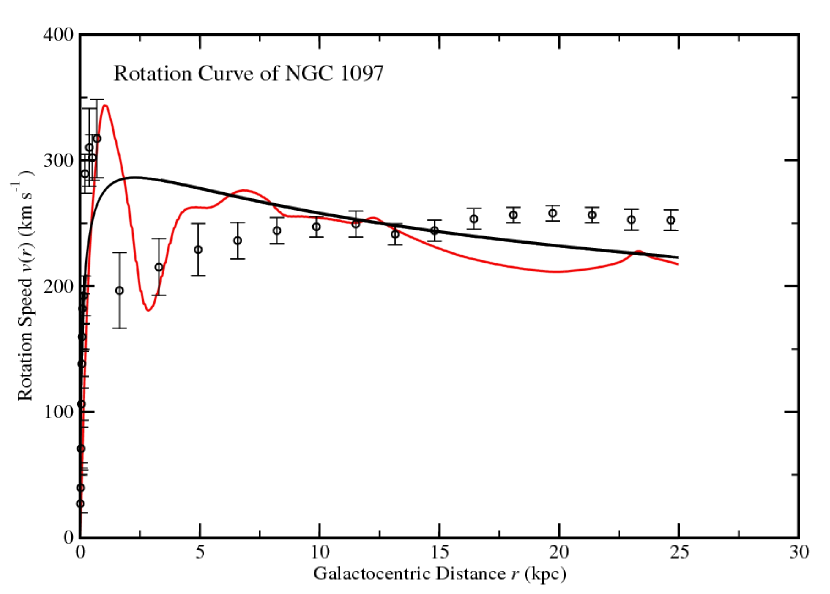
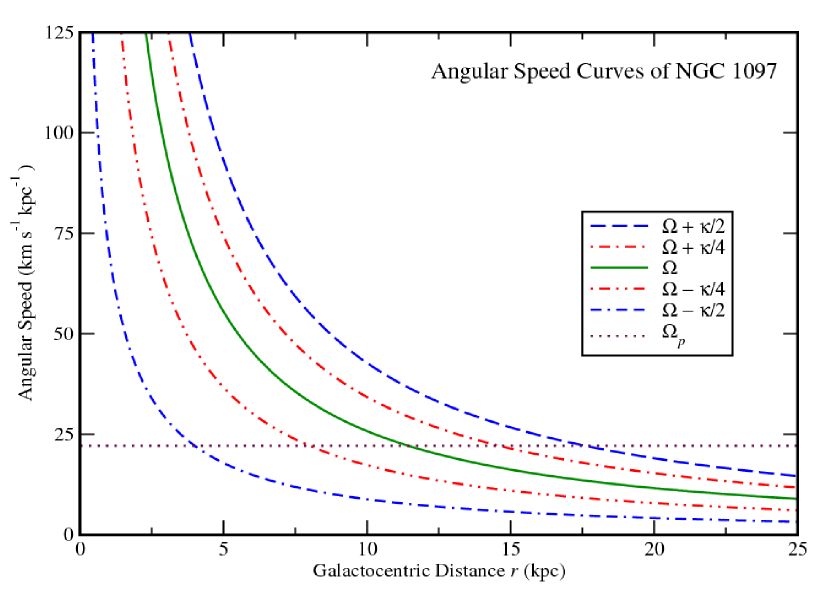
are found to be 550 km s-1, 0.552, and respectively by means of a least-square fit to the observational data points of NGC 1097. The rotation curve and the data points are shown in Figure 5 and the corresponding angular speed curves are shown in Figure 6. The horizontal line represents the pattern speed of the bar of our choice, (see Section 4). The intersections of with the and curves determine the locations of the outer-inner Lindblad resonance (OILR) and the outer Lindblad resonance (OLR) as well as those of the inner and outer 4:1 resonances. Here, is the epicyclic frequency. Since - increases monotonically with decreasing , an inner-inner Lindblad resonance (IILR) does not exist.
3) The sound speed, , for the gaseous disk is adopted to be equal to 15 km s-1. The gas response is not very sensitive to this parameter from 10 to 15 km s-1, both in our tests and in Patsis & Athanassoula (2000).
4) All the calculations presented in this paper are performed on a 1536 1536 uniform Cartesian grid. The computational domain corresponds to a physical region of 60 kpc 60 kpc, resulting in a cell size of 39 39 pc2 (or 0.4760.476).
4 Modeling Procedure
4.1 Requirements for a Successful Model
NGC 1097 is clearly not bisymmetrical. It has an elliptical companion galaxy, NGC 1097A. Based on their redshift data, the distance between these two galaxies is estimated to be 1 Mpc. For both visual and near-infrared wavelengths, the luminosity ratio of NGC 1097A to NGC 1097 is about 0.01. From the optical image in Figure 1, it can be seen that the northern half of NGC 1097 is influenced by NGC 1097A. However, the HI velocity fields in Figure 3 are quite regular, apart from indications of a slight asymmetry, which is consistent with a weak tidal interaction. Therefore, the simulation results from our bisymmetrical model can still provide useful information for the morphology and kinematics of NGC 1097. The selection criteria of a successful model are based on the following requirements, which are similar to those employed by Lindblad et al. (1996) and Lindblad & Kristen (1996):
1. The nuclear starburst ring should be reproduced.
2. The gas lanes in the model should have approximately the same shape and position as the observed dust lanes.
3. The two main spiral arms should be reproduced.
4. The characteristics in the observed velocity field should be reproduced.
The simulation results are judged by visual inspection of the model density distribution and velocity maps overlaid on the observed ones. Such comparisons would be sufficient in the context of our simple model. A quantitative method, e.g. , can be misleading if the strong density features or steep velocity gradients present in the models do not exactly overlap their observed counterparts. Furthermore, since the main purpose of this study is to obtain an understanding of NGC 1097 by simulating as much as possible the observed features using a simple yet physically plausible model, it is not our goal in this study to simulate complex and asymmetric features in the observations.
4.2 Free Parameters
The free parameters underlying our hydrodynamic model which are important for the response of gas to a rotating bar are the angular pattern speed, the location of the potential minimum, and the strength of the bar potential. These parameters are varied in our simulations to seek the best-fit models.
The pattern speed controls the positions of the resonances, which in turn determine the morphology of the spiral structure (e.g., Yuan & Kuo, 1997). For an initial estimate of the pattern speed, we choose a value that places the inner 4:1 ultraharmonic resonance (UHR) near the ends of the inner ring and the OILR outside the circumnuclear starburst ring. As pointed out by Schwarz (1984), the inner rings are close to the inner ultraharmonic resonance where ( - /4) = . This feature is also confirmed by Lin et al. (2008) in their study of NGC 6782. Furthermore, it has been shown in hydrodynamical simulations that nuclear spirals or nuclear rings are formed inside the OILR (Athanassoula, 1992; Piner et al., 1995; Maciejewski, 2004). An analysis of the central region in M100 (NGC 4321) by Knapen et al. (1995) also shows that the nuclear ring should be located inside the OILR. The range for the pattern speed is thus chosen to be 20 22.1 km s-1 kpc-1, corresponding to a range for the radius of the OILR given as 4.0 kpc ROILR 4.44 kpc.
The second free parameter in our model is the location of the minimum of the bar potential (a1 in Eq. 3). It will affect the background central mass concentration and the size of the nuclear ring. A smaller value of a1 leads to a smaller nuclear ring. In our simulations, a1 is taken to lie in the range 1.9 a 2.3 kpc.
The third parameter is the strength of the bar potential. It is represented by , which is defined as the ratio of the effective radial force exerted on the disk by the rotating bar (Yuan & Kuo, 1997) to the force required for circular motion as inferred from the rotation curve at the location of OILR. This choice is motivated by the fact that the waves are excited at the resonances. Its main influence is on the shape of the gas lanes. A stronger bar will produce straighter gas lanes. A similar effect is shown by the quadrupole moment in Athanassoula (1992). We found in our simulations that should lie between 16% and 23%.
5 Results
5.1 Evolution of the gaseous disk
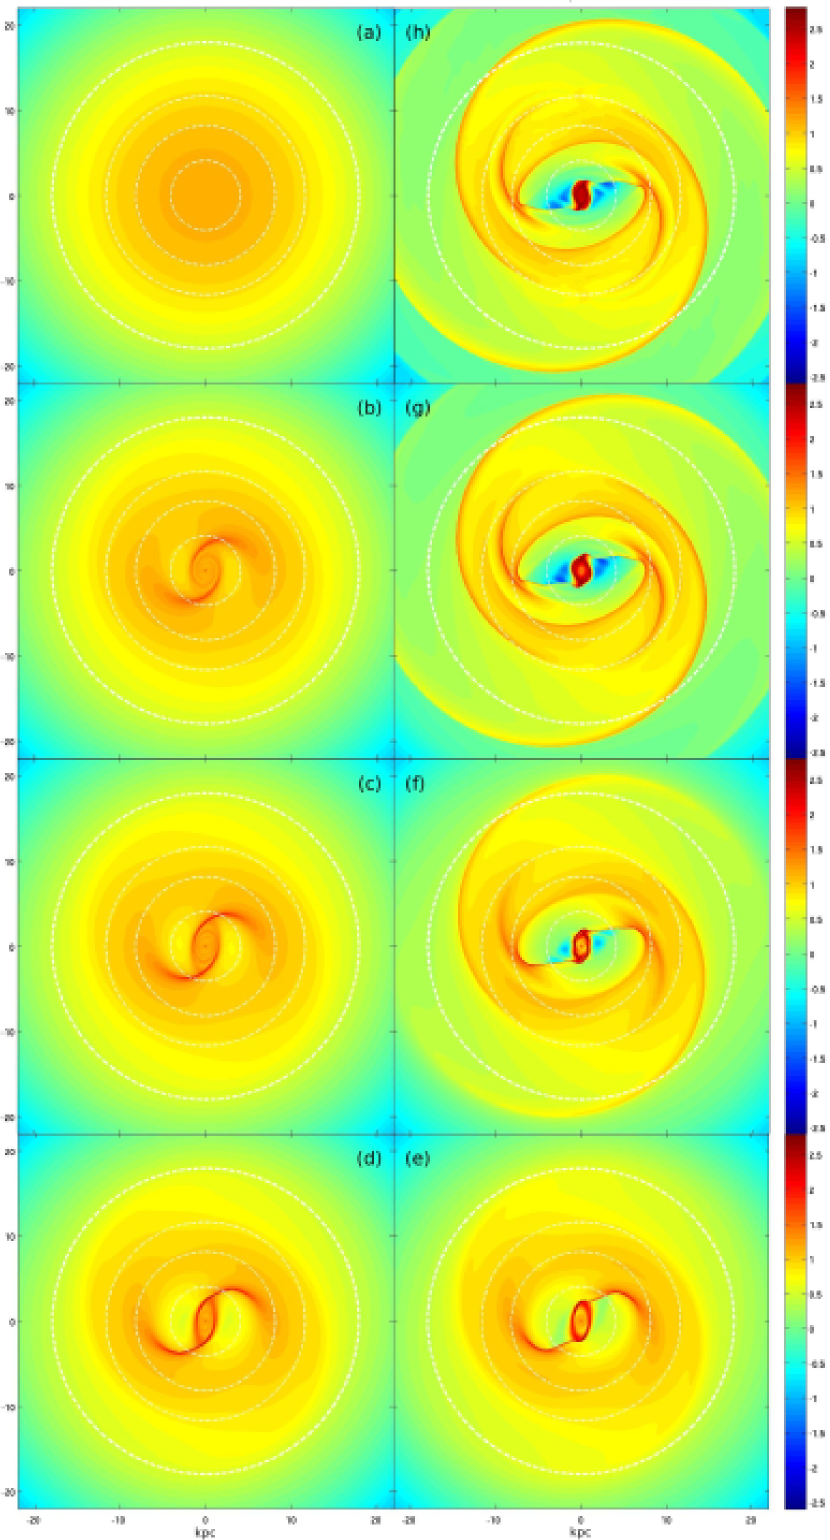
To understand the formation of the steady state structure, the sequential images of the evolution of the density features are shown in Figure 7. Initially, spiral waves excited at the OILR are the first to appear (Figure 7b), and as the strength of the bar potential increases, these waves intensify (Figure 7c), eventually leading to the formation of a shock (Figure 7d). Subsequently, the inner parts of the spirals excited at the OILR become tightly wound to form an elliptical ring, which we refer to be the circumnuclear ring (Figure 7e). At the same time, the waves excited at the inner 4:1 resonance appear (the two patches located on the 4:1 UHR circle in the first and third quadrants at 45 degrees in Figure 7e), grow in strength, and propagate inward. Thereafter, they interact with the waves excited at the OILR and merge at the gas lanes (Figure 7f). In the meantime, the waves excited at the OLR also appear. As a result of the self-gravity included in our simulation, the circumnuclear ring becomes unstable when the surface density is sufficiently high so that the Toomre Q-value is less than one (see Section 5.3). After two and a half revolutions of the bar, corresponding to an evolution time of 711 Myr (Figure 7g), the morphology of the gaseous disk remains nearly unchanged except for a small periodic change in the morphology of the circumnuclear ring due to the nonlinear development of the gravitational instability.
5.2 Comparisons between numerical results and observations
Based on 25 simulations, we deduced that the values of the parameters which provide the best fit to the observations are = 21.6 km s-1 kpc-1, a1 = 2.2 kpc, and = 21%. The value for implies that the OILR, the UHR, the CR (corotation resonance), and the OLR are located at ROILR = 4.09 kpc, RUHR = 8.17 kpc, RCR = 11.7 kpc, and ROLR = 18.0 kpc respectively.
For comparison to the observed data, we choose the frame corresponding to a time after 4.35 revolutions of the bar, or 1237 Myr (Figure 7h). For ease of presentation, we orient the simulation results such that the P.A. of the line of nodes, the inclination, and the P.A. of the major bar of the galaxy are 134∘, 46∘, and 151∘ respectively as listed in Table 1.
5.2.1 Images
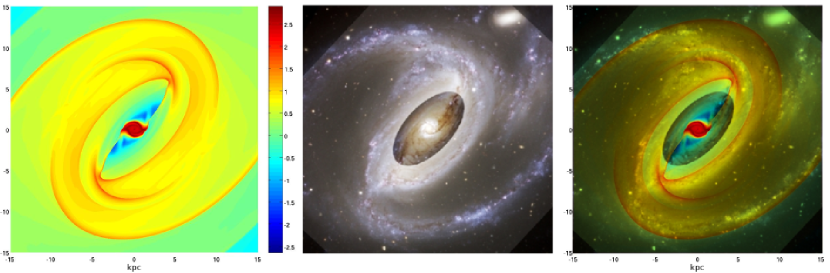
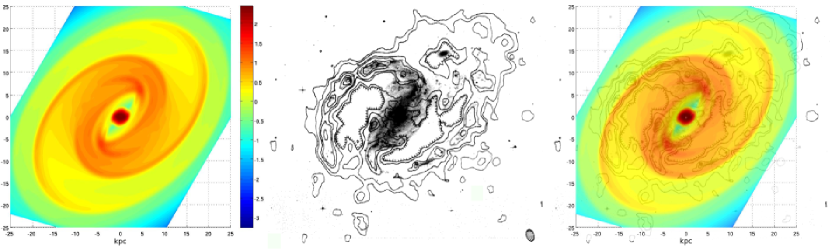
The projected surface density distribution for the best-fit case is illustrated in the left panel of Figure 8 and superimposed onto Figure 1 (reproduced in the middle panel) in the right panel of Figure 8. It can be seen that the circumnuclear starburst ring, the northwest dust lane, the two lateral spiral arms along the bar region as well as the southwest main spiral arm are reproduced by the simulation in both their shapes and locations. The circumnuclear ring is reproduced by the tightly wound inner parts of the spirals excited at the OILR and is located inside the OILR as expected (Athanassoula, 1992; Piner et al., 1995; Maciejewski, 2004; Yuan & Yang, 2006). The lateral arms along the bar region correspond to the 4:1 ultraharmonic spirals in our simulation. The lateral spiral arm on the southwestern side in the observation reveals that dust is distributed on the concave side of the spiral and that the bright OB stars lie outside the dust. This is consistent with the theory (e.g., Roberts, 1969) that inside the corotation radius dust coincides with the shock on the concave side of the spiral arm, gas is compressed by the shock, and after the gas has passed through the shock luminous stars are formed. The shock associated with the 4:1 ultraharmonic arm in our simulation coincides with the observed dust and bright OB stars lying behind the shock. For the main spiral arms outside the bar region in the optical image, the southwest spiral arm coincides with the spiral excited at the OLR in our simulation. However, the spatial extent of the north-east spiral arm is not as large as the arm in the southwest and is marked by a discontinuity. In fact, only a small portion of the observed arm matches with the simulated spiral excited at the OLR. Since the northern half of NGC 1097 is likely influenced by NGC 1097A, the complexity and asymmetry of the feature in the observation is difficult to simulate within the framework of our simple model.
The projected simulated density distribution convolved with the synthesized beam in the HI map produced by Ondrechen et al. (1989) is shown in the left panel of Figure 9. Its superposition onto the observed HI map (the middle panel of Figure 9) is shown in the right panel of the same figure. The southwest arm in the HI map matches quite well with the simulation result, which is consistent with the comparison between the optical image and the simulation. The HI intensity peak located at the southern end of the bar in the optical image coincides with the local high density region in the simulation. Although the simulated north-east spiral does not match well with the optical spiral arm, it matches much better with the HI arm which extends further than the optical arm. Since HI is usually absent in centers of galaxies, we may attribute the central high density region in our simulation to CO gas (although different chemical species in the gas are not distinguished in our simulation).
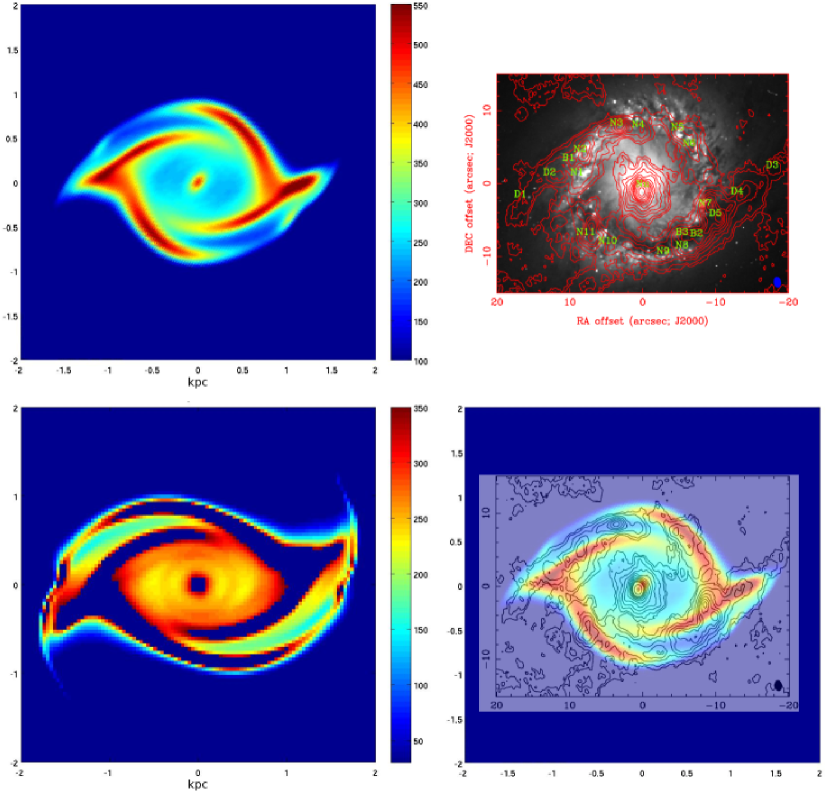
The central part of the projected simulated density map convolved with the synthesized beam in Figure 2 is shown in the upper left panel of Figure 10. It is superimposed onto Figure 2 in the lower right panel of the same figure. We have reproduced the starburst ring located at 800 pc from the central nucleus, which is comparable to the observation. We note that in the southwestern part of the ring, the knots corresponding to the strongest emissions in the observation coincide with the densest region in the simulation. However, the match between our bisymmetric model and observation is not as good in the northeastern part of the ring, which is not symmetrical to the southwestern part in the observation. Nevertheless, in the northwestern and southeastern parts of the ring, two groups of knots corresponding to secondary strongest emissions in the observation do coincide with secondary densest regions in the simulation. The HCN(J=3-2) intensity map in Figure 1 of Hsieh et al. (2012) shows features similar to those in the 12CO(J=2-1) map in Figure 2. However, since the beam size in the HCN map is about three times larger than that in the CO map, we only compare our simulation result with the latter.
In Hsieh et al. (2011), the molecular clumps in their 12CO(J=2-1) observation are divided into three groups based on their locations and velocity dispersions. The clumps located in the dust lanes are labeled D1,…,D5, while those in the starburst ring are further distinguished by their velocity dispersion being greater or less than 30 km s-1, and are named, respectively, B1,…,B3, and N1,…,N11 (see the upper right panel of Figure 10). In the southwestern part of the ring, although N7 and D5 are close to each other, we can see in our simulation that D5 is on the convex side of the spiral while N7 is on the concave side of the spiral and is in the ring. This comparison supports the interpretation that N7 and D5 belong to different components and are characterized by different properties in the observation. In Section 3.4.1 of Hsieh et al. (2011), the density of narrow line clumps is found to be (5.3 4.2) times higher than that of broad line clumps. Measuring the positions of B2 and N9 in our simulation, we find B2 is located in the lower density region between two spirals, while N9 is located in the higher density region on the ring. The surface densities in these two regions differ by a factor of about 2. Since the signal to noise ratio is lower in the north-east part in the 12CO(J=2-1) observation, it is difficult to make similar comparisons in this region.
Although the gaseous distribution in the nuclear ring in our simulation is not as clumpy as that in the observation, the comparison, here, mainly shows that in models including self-gravity of the gas, gravitational instabilities can result in a richer and more realistic set of features than in simulations without self-gravity. Previous studies show that clumpy features can be generated by including additional mechanisms (e.g., heating and cooling or star formation) in simulations (e.g., Lindblad & Kristen, 1996; Wada, 2008; Agertz et al., 2011), however, we concentrate on the effect of self-gravity in this study.
For the observed circumnuclear disk, four emission sites extend outward from the disk. The southeast protruding emission is connected with the starburst ring and, if we neglect the northeast feature, the other three are in alignment parallel to the direction of the dust lanes. In the upper left panel of Figure 10, the central high density disk also connects with the ring in the direction parallel to that of dust lanes. However, in the unprojected density map, which is not convolved with the synthesized beam, it is seen that the central disk and the ring are partially connected by a pair of tightly wound spirals. These features are separated from the central disk and the ring and only appear to be connected after convolution. Through this pair of tightly wound spirals which penetrate the nuclear starburst ring, a portion of the gas can flow into the central region inside the ring to form and maintain the circumnuclear disk. However, since the resolution of our simulation is 39 39 pc2, we do not compare our simulation results with observations on the 200 pc scale central region of the galaxy in, for example, Hicks et al. (2009) and Davies et al. (2009).
5.2.2 Velocity fields
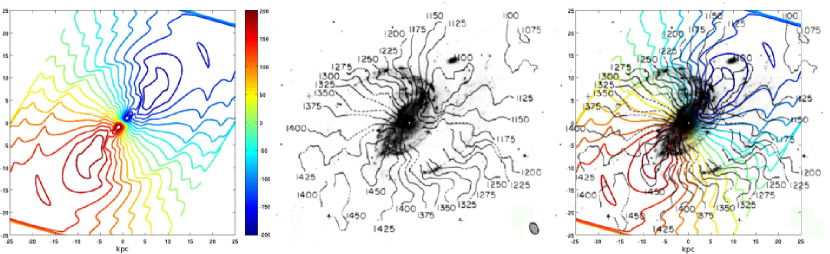
The isovelocity contours of the simulated velocity field, as obtained after convolution with the synthesized beam of the observation, are plotted on top of the observed HI velocity field in the left panel of Figure 11. We note that the velocity contours in the southwest arm bend inwards regularly along the spiral arms in both the simulation and observation as illustrated in the right panel of Figure 11. This is one of the primary distinctive features of the density waves excited at the OLR (Yuan & Kuo, 1998). However, this feature is not obviously present in the northeast spiral arm in the observation, which may be due to an influence by the gravitational field of NGC 1097A on the northeast spiral arm.
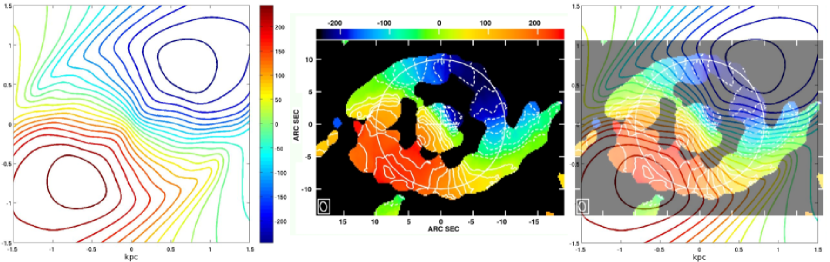
A comparision of the central part of the simulated velocity fields with that of the 12CO (J = 2-1) observation is shown in Figure 12. It can be seen that the central part of the galaxy is less influenced by the companion galaxy and that the simulation result from the bisymmetrical model matches well with the observation. In particular, the overall velocity gradient of the central molecular disk and the starburst ring is reproduced in our simulation. The numerical results reveal that gas motion in the region inside of the molecular ring is dominated by circular motion. However, in the low resolution observation of 12CO (J=2-1) in Hsieh et al. (2008), the isovelocity contours of the velocity map exhibit an S-shape structure with the end of the S-shape nearly parallel to the dust lanes. This structure, which is even more prominent in the 12CO (J=1-0) velocity map of Kohno et al. (2003), indicates the presence of noncircular motion (e.g., Kalnajs, 1978) in the regions where the dust lanes connect with the molecular ring. Such an S-shape structure is also reproduced by our simulation.
The red line in Figure 5 is the evolved rotation curve along the major axis in our simulation, which shows a large deviation from the initial rotation curve within 4 kpc produced by the bar perturbation. It can qualitatively reproduce both the fast-rotating feature of the CO rotation curve near 1 kpc and the drop shown by the HI data outside the starburst ring, which are also seen in Dicaire et al. (2008). Between 4 kpc and 8 kpc, the rotation curves from different observations show a large diversity. Since the gas density in this region, which roughly corresponds to the area outside the starburst ring and inside the bar region, is low except for the area along the dust lanes and there are strong shocks across the dust lanes, the uncertainties of the derived rotation curve from observations could be quite large. Therefore, one should refer to 2-D velocity fields when comparing observations and simulation results in this region. Although the evolved simulated rotation curve outside the 15 kpc is lower than that of the HI observation, it matches well with the H observation by Dicaire et al. (2008).
5.3 Gravitational instability and the circumnuclear ring
It has been known for some time that there exists a threshold in the gas surface density within each galaxy below which little star formation could occur. On kpc scales, the H I density seems to serve as a good indicator for this density threshold (Davies et al., 1976; Hunter & Gallagher, 1986; Guiderdoni, 1987; Skillman, 1987; van der Hulst et al., 1987). Recent higher-resolution observations, though, has posed some questions on this notion. Bigiel et al. (2008) reported that the H I density tends to saturate on smaller scales and this saturated density may manifest itself as a threshold for star formation. They further reported that the FUV data may not change as steeply around a H I density threshold as previously found in H data (Bigiel et al., 2010). The origin of this apparent contradiction is not clear and more analyses are required to resolve this issue.
In spite of this situation, the phenomenon of density threshold for star formation is often associated with large-scale gravitational instabilities (Kennicutt, 1989). However, the simple Toomre stability parameter for the gas, , where , , and are the sound speed of the gas, the epicycle frequency, the gravitational constant, and the gas surface density, respectively, is not robust in predicting star formation (e.g., Martin & Kennicutt, 2001; Wong & Blitz, 2002). Furthermore, the stellar component of a galactic disk (e.g., Yang et al., 2007; Leroy et al., 2008) and the atomic-to-molecular transition (e.g., Schaye, 2004) may be also important in contributing to the gravitational instability of the disk.
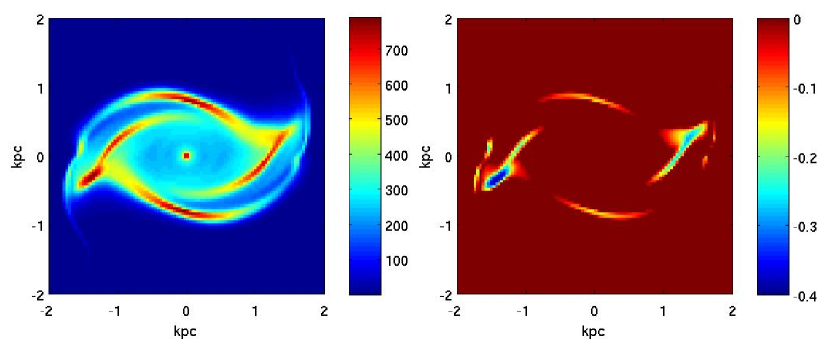
Although our simple model for NGC 1097 cannot address the complicated dynamics associated with star-gas interactions and atomic-to-molecular transition, our results are consistent with observations, which shows that the star-forming circumnuclear ring is located in the gravitationally unstable region (Hsieh et al., 2011). In our simulations, gravitational instability appears at the locations where the dust lanes connect with the circumnuclear ring when the ring has just been formed (1.5 bar revolutions). During the subsequent evolution of the gaseous disk, the instability propagates within the ring, leading to complex and asymmetrical structures. In Figure 13, a map of the Toomre -parameter is shown for the central 2 kpc region of the galaxy at the time selected for comparison of the simulation result with observations. The left panel corresponds to the map of the surface density and the right panel illustrates the map on a logarithmic scale. The -parameter of the two densest regions (blue color in the right panel) on the ring are both less than one. These regions coincide with the N1, N2, N7, N9, and B1–B3 molecular clumps reported in Hsieh et al. (2011). The second densest regions on the ring situated on the major axis of the bar are also gravitationally unstable and coincide with the N5, N6, N10, and N11 molecular clumps identified in Hsieh et al. (2011). Therefore, it seems that in the case of NGC 1097, gravitational instability of the gas disk itself is sufficient in predicting star forming sites in the circumnuclear region.
5.4 Mass inflow rate
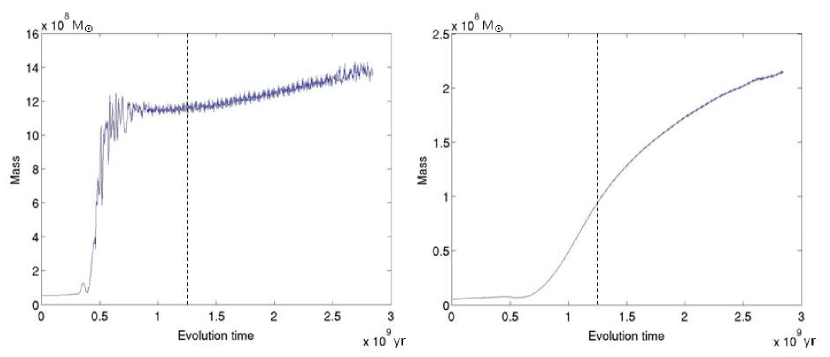
The left and right panels of Figure 14 show the time evolution of the total gaseous mass in the simulated starburst ring and interior to this ring respectively. The delay in the formation of the ring (after 500 Myr) is attributed to the start up procedure in which the strength of the bar potential is gradually increased during the first two revolutions of the bar. Once formed, its total mass increases with time until 750 Myr, whereupon it remained nearly constant at a level of until 1.1 Gyr. Thereafter, the mass in the ring increases, but at a slower rate than during the initial build-up. In contrast, the mass interior to the ring increases continuously, with the time rate of change greater during the initial phase from 750 Myr to 1.3 Gyr than during the time after 1.3 Gyr.
At a time corresponding to the dashed line in the left panel of Figure 14, which we select for comparison with observations, the mass in the starburst ring in the simulation is 11.6 108 M☉. This is to be compared with the estimated value from observation of 5.8 0.6 108 M☉ (Hsieh et al., 2008). The estimated surface density star formation rates of the molecular clumps situated on the starburst ring range from 0.58 0.08 to 4.07 0.34 M☉ yr-1 kpc-2 (Hsieh et al., 2011). This yields an estimated average star formation rate on the starburst ring of 3.1 M☉ yr-1.
Elmegreen & Efremov (1996) investigated star formation scaling laws and found that the duration of star formation in a region of size L tends to increase as L1/2. For a region characterized by 1 kpc, the time scale for star formation is 30 Myr. Elmegreen (1997) suggested the starburst process in nuclear rings in galaxies consists of three phases. In particular, the gas density first increases above the local virial density, which is followed by star formation taking place at high density. In the final phase, the gas density decreases below the virial density. Since the virial density in nuclear regions in galaxies is always very high, star formation is always intense and burst like. The consumption time is short and once the gas density decreases below the virial density, star formation ends quickly with the next phase delayed until the gas density is increased above the critical value again. For NGC 1097, the size of the starburst ring is 1.4 kpc and the estimated duration for a high star formation rate (3.1 M☉ yr-1) is 35 Myr.
The mass inflow rate was calculated from the slope of the total mass curve during the period between 1.1 Gyr and 1.6 Gyr, resulting in a rate of 0.11 M☉ yr-1. Although this is much lower than the observed star formation rate, the time scale of the mass inflow in our model is much longer than the duration of the starburst on the ring. Sandstrom et al. (2010) has estimated that the lifespans of the star clusters on the starburst ring are between 1 10 Myr. Sakamoto et al. (1999) have also mentioned that the current mass inflow rate is not required to be larger than the current star formation rate. As long as the total amount of gas transported to the central kiloparsec of barred galaxies is larger than the total amount of gas consumed by star formation, we should see high gas concentration in the central regions of the barred galaxies.
In the right panel of Figure 14, it can be seen that the mass interior to the ring at our selected epoch (the dashed line) is 9.47 107 M☉, which is comparable to the mass of the circumnuclear disk (6.5 107 M☉) estimated from observation (Hsieh et al., 2008) . The rate of mass accumulation in this region can be estimated from the slopes of the total mass curve between 1 Gyr and 1.3 Gyr. It is found to be 0.17 M☉ yr-1.
In Nemmen et al. (2011), the dimensionless mass accretion rate is defined as , where is the black hole mass and the Eddington accretion rate () is equal to yr-1. For NGC 1097, the black hole mass is (Lewis & Eracleous, 2006) whereas is (Nemmen et al., 2011). Therefore, equals to 0.017 M☉ yr-1. This accretion rate is inferred at the outer radius of the Advection-dominated accretion flow, which for NGC 1097 in Nemmen et al. (2011) is 225 times the Schwarzschild radius or about 530 AUs. Although the mass inflow rate in our model is higher than the observed mass accretion rate for the AGN, the scales are very different. From a few hundred parsecs to the AU scale nucleus, the mass inflow rate could be reduced as other mechanisms may operate in transporting gas into the nucleus from the circumnuclear disk (Shlosman et al., 1989). However, we note that the mass inflow in our model lasts for more than 2 Gyr and can sustain the circumnuclear disk to supply enough mass into the AU scale nucleus.
Since the expected star formation efficiencies for entire giant molecular clouds (GMCs) are typically only 1-5% (Lada & Lada, 2003), and the structures we are dealing with here are larger than GMCs, we expect the effect of star formation or stellar mass loss processes on our mass inflow rate estimates should not be significant.
6 Concluding remarks
We have performed two-dimensional modeling of the barred spiral galaxy NGC 1097 using the Antares hydrodynamics code coupled with the Poisson equation to include the self-gravity of the gas disk in the calculation. For a perturbing bar potential (Eqs. 2 and 3) described by the angular speed , the location of the potential minimum a1, and the strength of the bar , we show that the primary density and velocity features of the galaxy can be reproduced provided that the parameters are in the range of = 21.6 km s-1 kpc-1, a1 = 2.2 kpc, and = 21%. Specifically, with these parameters, the observed shapes and positions of the circumnuclear starburst ring, the northwest dust lane, the two lateral spiral arms along the bar region as well as the southwest main spiral arm are well reproduced in our model. In addition, our simulation supports the view that the resolved molecular clumps at the giant molecular cloud association (GMA) scale of 200-300 pc in the starburst ring by Hsieh et al. (2011) are characterized by different properties. Furthermore, the connection between the circumnuclear disk and the starburst ring in the observation may be due to the unresolved tightly wound spirals which are separated from the central disk and the ring in the simulation before convolution with the synthesized beam of the observation. Through this pair of tightly wound spirals which penetrate the nuclear starburst ring, a portion of the gas can flow into the central region inside the ring to form and maintain the circumnuclear disk.
On comparison with the observed velocity fields, the velocity contours in the southwest main spiral arm bend inwards regularly along the spiral arms in both the simulation and observation. Although this feature is not obvious in the northeast main spiral arm, which may be influenced by the companion galaxy NGC 1097A, it is still indicative that the main spiral arms can be attributed to the density waves excited at the OLR by the bar potential.
By including the self-gravity of the gas disk in our calculation, we have studied the gravitational stability and the mass inflow in the gas disk. We find that the starburst ring is gravitationally unstable in our simulation, which is consistent with the result in Hsieh et al. (2011). This comparison indicates that the Toomre parameter is a useful diagnostic of star forming sites in the case of NGC 1097.
The mass inflow rate for the starburst ring is 0.11 M☉ yr-1, lasting for more than 1.5 Gyr in our simulation. Although the current mass inflow rate in the simulation is lower than the observed current star formation rate (3.1 M☉ yr-1), the time scale of the mass inflow in our model is much longer than the duration of the starburst on the ring.
The accretion rate for the supermassive black hole of NGC 1097 estimated from observation is 0.017 M☉ yr-1. This is lower than the inflow rate of the gas entering the central region within the starburst ring in our simulation (0.17 M☉ yr-1). However, the mass inflow rate in our model is evaluated at the scale of a few hundred parsecs while the spatial scale of the observed mass accretion rate for the AGN is only a few hundred AUs. Our results do not address the mass flow in the inner 10 pc, but it is likely that AGN activity as well as stellar and gas dynamical mechanisms are important in influencing the gas flow in the nucleus. Nevertheless, the mass inflow in our model lasts for more than 2 Gyr, which should be able to sustain the circumnuclear disk in supplying sufficient mass into the AU-scale nucleus.
| Parameter | Value |
|---|---|
| aaHummel et al. (1987) | 02h 46m 16.s96 |
| aaHummel et al. (1987) | 30∘ 16′ 28′′.9 |
| Morphologybbde Vaucouleurs et al. (1991) | SB(s)b |
| Nuclear activityccStorchi-Bergmann et all (1993) | Type 1 Seyfert |
| Line of nodesddOndrechen et al. (1989) | 134 3∘ |
| InclinationddOndrechen et al. (1989) | 46 5∘ |
| P.A. of bareeQuillen et al. (1995) | 148 3∘ |
| Adopted distance | 16.96 Mpc |
References
- Agertz et al. (2011) Agertz, O., Teyssier, R., & Moore, B. 2011, MNRAS, 410, 1391
- Athanassoula (1992) Athanassoula, E. 1992, MNRAS, 259, 345
- Barth et al. (1995) Barth, A. J., Ho, L. C., Filippenko, A. V., & Sargent, W. L. 1995, AJ, 110, 1009
- Bigiel et al. (2010) Bigiel, F., Leroy, A., Walter, F., et al. 2010, AJ, 140, 1194
- Bigiel et al. (2008) —. 2008, AJ, 136, 2846
- Boone et al. (2004) Boone, F., García-Burillo, S., Combes, F., et al. 2004, in Astronomical Society of the Pacific Conference Series, Vol. 320, The Neutral ISM in Starburst Galaxies, ed. S. Aalto, S. Huttemeister, & A. Pedlar, 269
- Crosthwaite (2002) Crosthwaite, L. P. 2002, PASP, 114, 929
- Davies et al. (1976) Davies, R. D., Elliott, K. H., & Meaburn, J. 1976, MmRAS, 81, 89
- Davies et al. (2009) Davies, R. I., Maciejewski, W., Hicks, E. K. S., et al. 2009, ApJ, 702, 114
- de Vaucouleurs et al. (1991) de Vaucouleurs, G., de Vaucouleurs, A., Corwin, Jr., H. G., et al. 1991, S&T, 82, 621
- Dicaire et al. (2008) Dicaire, I., Carignan, C., Amram, P., et al. 2008, MNRAS, 385, 553
- Elmegreen (1997) Elmegreen, B. G. 1997, in Revista Mexicana de Astronomia y Astrofisica, vol. 27, Vol. 6, Revista Mexicana de Astronomia y Astrofisica Conference Series, ed. J. Franco, R. Terlevich, & A. Serrano, 165
- Elmegreen & Efremov (1996) Elmegreen, B. G., & Efremov, Y. N. 1996, ApJ, 466, 802
- Elmegreen & Elmegreen (1990) Elmegreen, B. G., & Elmegreen, D. M. 1990, ApJ, 355, 52
- García-Burillo et al. (2005) García-Burillo, S., Combes, F., Schinnerer, E., Boone, F., & Hunt, L. K. 2005, A&A, 441, 1011
- García-Burillo et al. (2004) García-Burillo, S., Combes, F., Schinnerer, E., et al. 2004, in IAU Symposium, Vol. 222, The Interplay Among Black Holes, Stars and ISM in Galactic Nuclei, ed. T. Storchi-Bergmann, L. C. Ho, & H. R. Schmitt, 427–430
- Guiderdoni (1987) Guiderdoni, B. 1987, A&A, 172, 27
- Hicks et al. (2009) Hicks, E. K. S., Davies, R. I., Malkan, M. A., et al. 2009, ApJ, 696, 448
- Higdon & Wallin (2003) Higdon, J. L., & Wallin, J. F. 2003, ApJ, 585, 281
- Ho et al. (2004) Ho, P. T. P., Moran, J. M., & Lo, K. Y. 2004, ApJ, 616, L1
- Hsieh et al. (2012) Hsieh, P.-Y., Ho, P. T. P., Kohno, K., Hwang, C.-Y., & Matsushita, S. 2012, ApJ, 747, 90
- Hsieh et al. (2008) Hsieh, P.-Y., Matsushita, S., Lim, J., Kohno, K., & Sawada-Satoh, S. 2008, ApJ, 683, 70
- Hsieh et al. (2011) Hsieh, P.-Y., Matsushita, S., Liu, G., et al. 2011, ApJ, 736, 129
- Hummel et al. (1987) Hummel, E., van der Hulst, J. M., & Keel, W. C. 1987, A&A, 172, 32
- Hunter & Gallagher (1986) Hunter, D. A., & Gallagher, III, J. S. 1986, PASP, 98, 5
- Kalnajs (1978) Kalnajs, A. J. 1978, in IAU Symposium, Vol. 77, Structure and Properties of Nearby Galaxies, ed. E. M. Berkhuijsen & R. Wielebinski, 113–125
- Keel (1983) Keel, W. C. 1983, ApJ, 269, 466
- Kenney et al. (1992) Kenney, J. D. P., Wilson, C. D., Scoville, N. Z., Devereux, N. A., & Young, J. S. 1992, ApJ, 395, L79
- Kennicutt (1989) Kennicutt, Jr., R. C. 1989, ApJ, 344, 685
- Knapen et al. (1995) Knapen, J. H., Beckman, J. E., Heller, C. H., Shlosman, I., & de Jong, R. S. 1995, ApJ, 454, 623
- Kohno et al. (2003) Kohno, K., Ishizuki, S., Matsushita, S., Vila-Vilaró, B., & Kawabe, R. 2003, PASJ, 55, L1
- Koribalski et al. (2004) Koribalski, B. S., Staveley-Smith, L., Kilborn, V. A., et al. 2004, AJ, 128, 16
- Kotilainen et al. (2000) Kotilainen, J. K., Reunanen, J., Laine, S., & Ryder, S. D. 2000, A&A, 353, 834
- Lada & Lada (2003) Lada, C. J., & Lada, E. A. 2003, ARA&A, 41, 57
- Leroy et al. (2008) Leroy, A. K., Walter, F., Brinks, E., et al. 2008, AJ, 136, 2782
- Lewis & Eracleous (2006) Lewis, K. T., & Eracleous, M. 2006, ApJ, 642, 711
- Lin et al. (2011) Lin, L.-H., Taam, R. E., Yen, D. C. C., Muller, S., & Lim, J. 2011, ApJ, 731, 15
- Lin et al. (2008) Lin, L.-H., Yuan, C., & Buta, R. 2008, ApJ, 684, 1048
- Lindblad & Kristen (1996) Lindblad, P. A. B., & Kristen, H. 1996, A&A, 313, 733
- Lindblad et al. (1996) Lindblad, P. A. B., Lindblad, P. O., & Athanassoula, E. 1996, A&A, 313, 65
- Lindt-Krieg et al. (2008) Lindt-Krieg, E., Eckart, A., Neri, R., et al. 2008, A&A, 479, 377
- Maciejewski (2004) Maciejewski, W. 2004, MNRAS, 354, 892
- Maoz et al. (1996) Maoz, D., Barth, A. J., Sternberg, A., et al. 1996, AJ, 111, 2248
- Martin & Kennicutt (2001) Martin, C. L., & Kennicutt, Jr., R. C. 2001, ApJ, 555, 301
- Nemmen et al. (2011) Nemmen, R., Storchi-Bergmann, T., & Eracleous, M. 2011, ArXiv e-prints
- Ondrechen et al. (1989) Ondrechen, M. P., van der Hulst, J. M., & Hummel, E. 1989, ApJ, 342, 39
- Patsis & Athanassoula (2000) Patsis, P. A., & Athanassoula, E. 2000, A&A, 358, 45
- Perez-Olea & Colina (1996) Perez-Olea, D. E., & Colina, L. 1996, ApJ, 468, 191
- Piner et al. (1995) Piner, B. G., Stone, J. M., & Teuben, P. J. 1995, ApJ, 449, 508
- Quillen et al. (1995) Quillen, A. C., Frogel, J. A., Kuchinski, L. E., & Terndrup, D. M. 1995, AJ, 110, 156
- Roberts (1969) Roberts, W. W. 1969, ApJ, 158, 123
- Sakamoto et al. (1999) Sakamoto, K., Okumura, S. K., Ishizuki, S., & Scoville, N. Z. 1999, ApJ, 525, 691
- Sandage & Tammann (1981) Sandage, A., & Tammann, G. A. 1981, A revised Shapley-Ames Catalog of bright galaxies
- Sandstrom et al. (2010) Sandstrom, K., Krause, O., Linz, H., et al. 2010, A&A, 518, L59
- Schaye (2004) Schaye, J. 2004, ApJ, 609, 667
- Schwarz (1984) Schwarz, M. P. 1984, MNRAS, 209, 93
- Shlosman et al. (1989) Shlosman, I., Frank, J., & Begelman, M. C. 1989, Nature, 338, 45
- Skillman (1987) Skillman, E. D. 1987, in NASA Conference Publication, Vol. 2466, NASA Conference Publication, ed. C. J. Lonsdale Persson, 263–266
- Storchi-Bergmann et al. (1993) Storchi-Bergmann, T., Baldwin, J. A., & Wilson, A. S. 1993, ApJ, 410, L11
- Storchi-Bergmann et al. (1996) Storchi-Bergmann, T., Wilson, A. S., & Baldwin, J. A. 1996, ApJ, 460, 252
- Telesco et al. (1993) Telesco, C. M., Dressel, L. L., & Wolstencroft, R. D. 1993, ApJ, 414, 120
- van der Hulst et al. (1987) van der Hulst, J. M., Skillman, E. D., Kennicutt, R. C., & Bothun, G. D. 1987, A&A, 177, 63
- Wada (2008) Wada, K. 2008, ApJ, 675, 188
- Wada & Habe (1992) Wada, K., & Habe, A. 1992, MNRAS, 258, 82
- Wong & Blitz (2002) Wong, T., & Blitz, L. 2002, ApJ, 569, 157
- Yang et al. (2007) Yang, C.-C., Gruendl, R. A., Chu, Y.-H., Mac Low, M.-M., & Fukui, Y. 2007, ApJ, 671, 374
- Yen et al. (2012) Yen, C.-C., Taam, R. E., Yeh, K. H.-C., & Jea, K. C. 2012, Journal of Computational Physics, 231, 8246
- Yuan & Kuo (1997) Yuan, C., & Kuo, C.-L. 1997, ApJ, 486, 750
- Yuan & Kuo (1998) —. 1998, ApJ, 497, 689
- Yuan & Yang (2006) Yuan, C., & Yang, C.-C. 2006, ApJ, 644, 180
- Yuan & Yen (2005) Yuan, C., & Yen, D. C. C. 2005, Journal of Korean Astronomical Society, 38, 197