Barium and Yttrium abundance in intermediate-age and old open clusters††thanks: Based on observations collected at ESO VLT under programs 076.B-0263 and 083.D-0682.
Abstract
Barium is a neutron capture element, that, in open clusters, is frequently over-abundant with respect to the Iron. A clear explanation for this is still missing. Additionally, its gradient across the Galactic disk is poorly constrained. We measure the abundance of yttrium and barium using the synthetic spectrum method from UVES high-resolution spectra of eight distant open clusters, namely Ruprecht 4, Ruprecht 7, Berkeley 25, Berkeley 73, Berkeley 75, NGC 6192, NGC 6404, and NGC 6583. The barium abundance was estimated using NLTE approximation. We confirm that Barium is indeed over-abundant in most clusters, especially young clusters. Finally, we investigated the trend of yttrium and barium abundances as a function of distance in the Galaxy and ages. Several scenarios for the barium over-abundance are then discussed.
keywords:
stars: abundances – stars: late-type – Galaxy: disc – Galaxy: evolution.1 Introduction
There is nowadays much interest in the investigation of the abundances of elements produced via neutron capture processes (e.g. Sr, Ba, Y, La, Zr, and so forth), both in open clusters and in the general Galactic field. The precise abundance of these elements in as many stars and clusters as possible allows us to improve our understanding (1) of the neutron capture processes themselves as enrichment sources (e.g. Busso et al. 2001), (2) of the various chemical evolution scenarios for the Galactic disk (e.g. Chiappini et al. 1997; Serminato et al. 2009 ), and (3) of the different formation paths of star clusters and stars in the Galactic field (Brewer & Carney, 2006).
The neutron capture reactions can run in two ways, depending on the neutron flux density: as a slow process (s-process) or as a rapid process (r-process, (Burbidge et al., 1957). The two processes take place at different temperatures, in different time domains, and, therefore, inside objects in different evolutionary stages.
As for the r-process, three channels of s-process were originally introduced in the classical model by Kappeler et al. (1989) : (1) the main channel, from asymptotic giant branch (AGB) stars (isotopes with A from 90 to 204); (2) the weak channel, from massive stars that explode later as Supernovae (isotopes with A up to 90); and (3) the strong channel, introduced to reproduce 50% of 208Pb. At present, modern models of nucleosynthesis in the AGB stars consider a variety of contributions in the production of specific isotopes, as a function of (1) the number of third dredge-up episodes, and (2) the yields of the light s-elements (ls), as Sr, Y, Zr, and the heavy s-elements (hs), such as Ba, La, Ce, Pr, Nd, and their dependence on metallicity (see more detailed information in Busso et al. 1999; Gallino et al. 1998; Serminato et al. 2009, etc.) The small and moderately massive AGB stars (mass around 1.5 solar masses) contribute mostly to the production of the n-capture elements, such as yttrium and barium . Those stars then enrich the interstellar medium, from which new stars will form in subsequent star formation episodes.
The details of the formation and production of neutron capture elements provide, therefore, crucial information bearing on models of Galactic chemical evolution. For instance, in the study by D’ Orazi et al. (2009), barium abundances were derived for a number of open clusters’ stars, and it was found that Ba abundance with respect to iron increases at decreasing clusters age. This seems to require some additional enrichment with barium by the least-massive stars (Busso et al. 1999; Straniero, Cristallo & Gallino 2009; Cristallo et al. 2009), and it is at variance with the currently existing chemical evolution models that describe the enrichment process at the moment of the Solar System formation (Travaglio et al., 1999). Along the same vein, Jacobson, Friel & Pilachowski (2011) and Desidera et al. (2011) found significant barium overabundances in young stars.
Maiorca et al. (2011) investigated other n-capture elements, such as Y, Zr, La, Ce, in young open clusters and confirmed the result obtained for barium, namely an increase of overabundances of those elements with the cluster age. However, the overabundances are limited to small values ([El/Fe] 0.2 dex), when compared with barium overabundance ([Ba/Fe] 0.6 dex).
In the recent study by D’ Orazi et al. (2012), a lower value of 0.3 dex of the barium abundance was obtained for the stars in three young associations.
The authors provide a few possible explanations for this overabundance, namely : (1) neglecting the hyperfine structure of the barium lines; (2) deviations from the Local Thermodynamic Equilibrium (LTE) conditions; (3) chromospheric activity (see also D’ Orazi et al. 2009). However, these authors did not detect any correlation between the barium abundance and the chromospheric activity indices for their stars. Moreover, their estimate of the deviations from the LTE conditions implied a minor effect on the barium abundance determination.
As is shown in a number of works (e.g. Maiorca et al. 2011; Desidera et al. 2011; D’ Orazi et al. 2012), the origin of the barium overabundance (up to 0.6 dex) is still far from being understood, and much work still need to be done.
The goal of the present study is (1) to enlarge the sample of star clusters with estimates of LTE yttrium abundances and the barium abundances allowing for deviations from the LTE, and (2) to analyze the trends of their abundances as a function of the distance to the Galactic center and the age. This is in an attempt to provide further observational pieces of evidence, and to boost the discussion on this intriguing problem.
2 Open clusters: observations and the stellar parameters
The main parameters (Galactic coordinates, helio-centric distance and age) of the investigated clusters are listed in the Table 1.
| Name | l | b | age | Ref. | |
|---|---|---|---|---|---|
| deg | deg | kpc | Gyr | ||
| Berkeley 75 | 234.30 | 11.12 | 9.8 | 3.0 | Ca05a |
| Berkeley 25 | 226.60 | 9.69 | 11.3 | 4.0 | Ca05a |
| Ruprecht 7 | 225.44 | 4.58 | 6.5 | 0.8 | Ca05b |
| Ruprecht 4 | 222.04 | 5.31 | 4.9 | 0.8 | Ca05b |
| Berkeley 73 | 215.28 | 9.42 | 9.7 | 1.5 | Ca05a |
| NGC6192 | 340.65 | 2.12 | 1.5 | 0.18 | Cl |
| NGC6404 | 355.66 | -1.18 | 1.7 | 0.5 | Ca05c |
| NGC6583 | 9.28 | -1.53 | 2.1 | 1.0 | Ca05c |
| Cluster | ,K | , K | sigma | N | error |
|---|---|---|---|---|---|
| Ca07 | this study | K | |||
| Ruprecht4_3 | 5105 | 5112 | 106 | 51 | 15 |
| Ruprecht7_2 | 5160 | 5195 | 146 | 54 | 20 |


The observational material used in this study was taken from Carraro et al. (2007) and Magrini et al. (2010). The spectra were obtained using the high-resolution echelle spectrograph UVES onboard VLT with resolving power R = 40,000 for the wavelengths range 4750–6800 Å.
Additionally, in Carraro et al. (2007) radial velocities were measured and the membership to the clusters established.
In order to corroborate the atmospheric parameters obtained in Carraro et al. (2007), we selected two stars in Ruprecht 4 and Ruprecht 7, respectively, and compared the equivalent widths of the lines with the ones measured in the present study using the DECH20 software package (Galazutdinov, 1992). We also compared the temperatures derived by Carraro et al. (2007), with our effective temperatures, estimated with the method developed by Kovtyukh et al. (2003), which consists in calibrating the central depths ratio of the lines with different potentials for the lower excitation level. The comparison of the equivalent widths for Ruprecht4_3 and Ruprecht7_2, is shown in Fig. 1, while the comparison of the estimated effective temperatures for the same stars is presented in Table 2.
Having obtained a good agreement for both the equivalent widths and effective temperatures, we are now in a good position to estimate the yttrium and barium abundances in the remaining stars by using the atmospheric parameters obtained by Carraro et al. (2007) and Magrini et al. (2010). In these works the metallicity and element abundances were determined using the analysis code MOOG (Sneden, 1973) and the atmospheric models by Kurucz (1993). The effective temperature was estimated from photometry using the Alonso et al. (1999) calibration. Then the temperature was refined using the correlation between iron abundance, determined with that line, and the potential of the lower level of that line. The surface gravity was computed with the canonical formula (for more details see Carraro et al. 2007).
3 Determination of the yttrium and barium abundances
To estimate abundances, we used the models by Castelli & Kurucz (2004), computed for the atmospheric parameters of each star. The estimate of the LTE yttrium abundance was performed with a new version of the STARSP software package (Tsymbal, 1996) and the VALD atomic data (Kupka et al., 1999) using the three lines of Y II centered at 4854.873, 4883.690, and 5087.426 Å, which we reliably identified in the spectrum. The adopted Solar yttrium abundance is (Y/H)sol = 2.24 where log A(H) = 12. Examples of the synthetic spectrum fit on the observed spectrum in the area of the yttrium lines are shown in Figs. 2 and 3.


The barium abundance was estimated using the NLTE approximation with a version of MULTI (Carlsson, 1986), modified by S.A. Korotin (Andrievsky et al. 2009; Korotin et al. 2011). Unfortunately the line 4554 Å is outside the spectral range in studied spectra and to determine the barium abundance, we used three lines of Ba II (5853, 6141 and 6496 Å) in the NLTE approximation. Our barium model contains 31 levels of Ba I, 101 levels of Ba II with , and the ground level of Ba III ion. After close inspection, we included 91 bound-bound transitions as well. The odd barium isotopes have hyperfine splitting of their levels and, thus, present several Hyper Fine Structure (HFS) components for each line (Rutten, 1978). Therefore, lines 4554 Å and 6496 Å were fitted by adopting the even-to-odd abundance ratio of 82:18 (Cameron, 1982). It is evident that the HFS for lines 5853 Å and 6141 Å is not significant. The solar barium abundance was assumed to be (Ba/H)sol = 2.17 where log A(H) = 12. That value was obtained from the Solar Atlas (Kurucz et al., 1984) with the same atomic data, which had been used to estimate the barium abundance in the stellar atmospheres. Departures from LTE do not significantly affect Ba abundances (correction about 0.1 dex). However we apply the NLTE corrections to avoid the systematic errors.
Examples of the observed spectra fitted with the model spectra in the area of the barium lines are shown in Fig. 4.
In addition, we considered the problem associated with the saturation of the barium lines, since their equivalent widths are rather large. Fig. 5 shows the curve of growth for four barium lines, as well as the fitting of the observed profile of the barium line and the estimated profiles with different barium abundances 0.1 dex (Fig. 6).


The estimates presented in the Figs. 5 and 6 indicate that the equivalent widths and profiles are rather sensitive to the barium abundance. Relatively weaker and moderate lines (up to 200 mÅ ) are very sensitive to the element abundance; while the stronger lines, obtained by the computed synthetic spectra, allow one to to obtain abundance values with an accuracy of not less than 0.1 dex (see Figs. 5 and 6).
The influence of the uncertainty in the parameters, computed by Carraro et al. (2007), on the accuracy of determination of the yttrium and barium abundances for Ruprecht4_4 is given in Table 3. The typical errors in temperature, surface gravity logarithm and microturbulent velocity are 100 K (col 1), 0.2 (col 2) and 0.1 km/s (col 3), respectively. When estimating the total error (col 5), the average accuracy of the determination of the clusters metallicity is assumed to be 0.1 dex (col 4) and the accuracy the synthetic spectrum’s fitting is assumed to be 0.05 dex.
| 1 | 2 | 3 | 4 | 5(Total error) | |
|---|---|---|---|---|---|
| Y | 0 | 0.12 | 0.04 | 0.1 | 0.17 |
| Ba | 0.02 | 0.09 | 0.06 | 0.1 | 0.15 |
The accuracy of the fitting of the synthetic spectrum is 0.10 dex for the spectra with low signal-to-noise ratio; however, the total error in determination of the Y and Ba abundances does not exceed 0.2 dex.
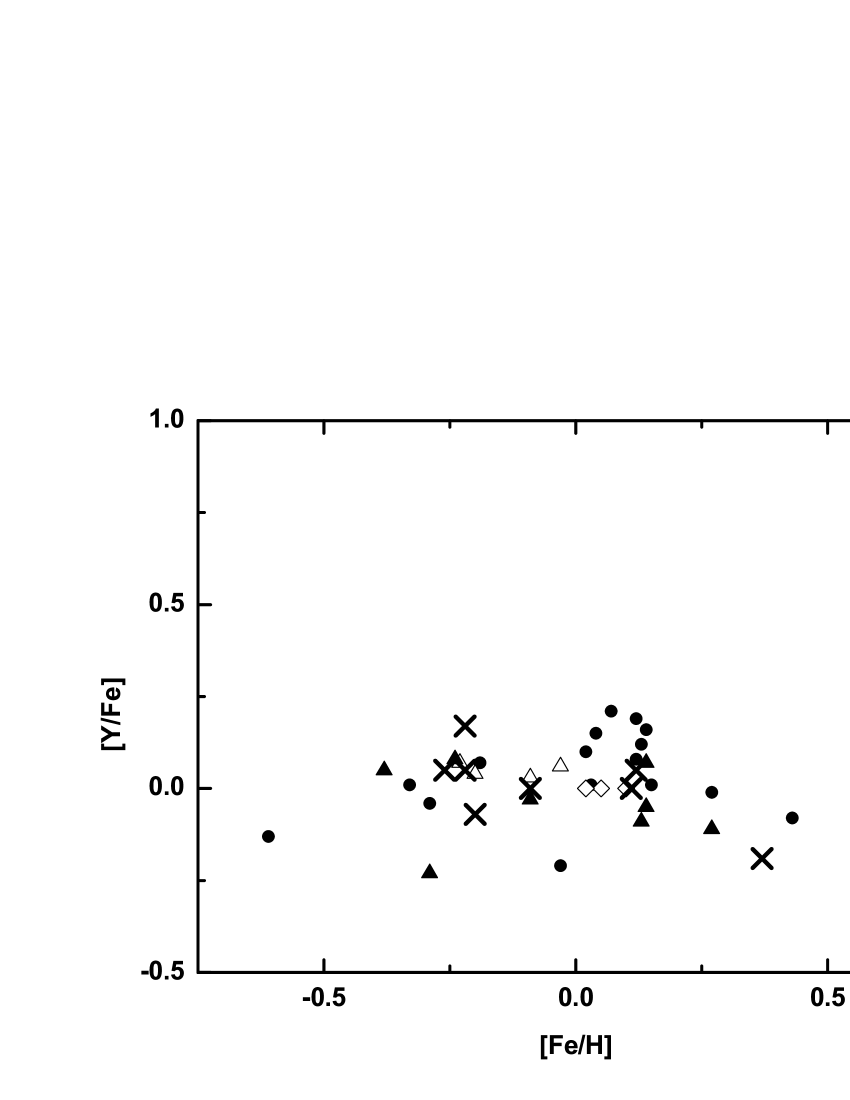
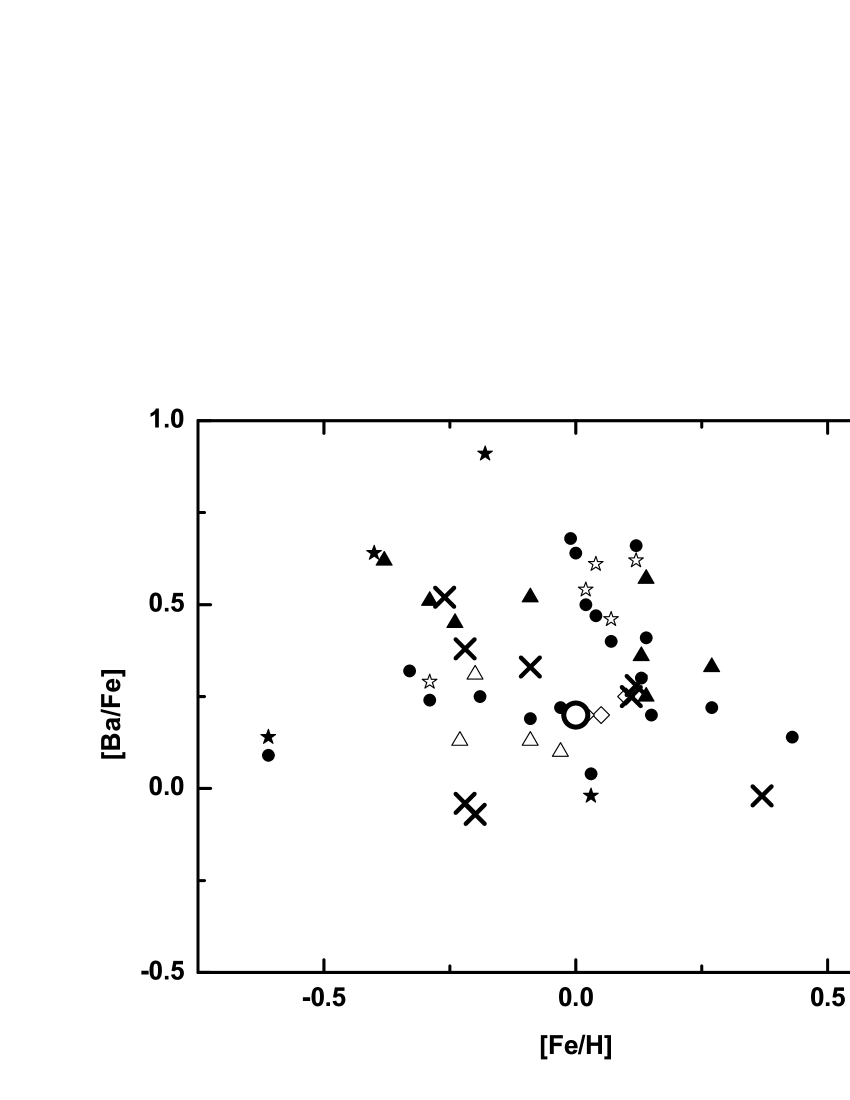
The final results are listed in Table 4. The dependencies of [Y/Fe] and [Ba/Fe] on [Fe/H] for our data and those culled from the literaure are presented in Fig. 7. As we can see from the figures, barium shows significantly higher values and more scattering than yttrium.
| Cluster | ID | Teff | log g | Vt | [Fe/H] | [Y/H] | [Y/Fe] | [Ba/H] | [Ba/Fe] | Membership |
|---|---|---|---|---|---|---|---|---|---|---|
| Berkeley 25 | 10 | 5000 | 2.9 | 1.65 | 0.10 | -0.04 | -0.14 | -0.24 | -0.34 | NM |
| 12 | 4870 | 2.75 | 1.5 | -0.2 | -0.27 | -0.07 | -0.27 | -0.07 | M | |
| 13 | 4860 | 2.65 | 1.73 | -0.17 | -0.30 | -0.13 | – | – | M | |
| Berkeley 73 | 12 | 5030 | 2.78 | 1.4 | -0.39 | -0.57 | -0.18 | -0.2 | 0.19 | NM |
| 1 3 | 5730 | 4.15 | 0.99 | 0.17 | -0.1 | 0.26 | -0.12 | -0.05 | NM | |
| 15 | 5070 | 3.12 | 1.04 | -0.38 | -0.49 | -0.11 | -0.26 | 0.12 | NM | |
| 16 | 4890 | 2.71 | 1.45 | -0.18 | -0.37 | -0.01 | -0.2 | -0.02 | M | |
| 18 | 4940 | 2.88 | 1.32 | -0.27 | -0.22 | 0.05 | -0.34 | -0.07 | M | |
| 19 | 5870 | 4.23 | 1.4 | -0.03 | -0.29 | -0.26 | -0.24 | -0.21 | NM | |
| Berkeley 75 | 9 | 4968 | 2.57 | 1.55 | -0.44 | -0.39 | 0.05 | -0.17 | 0.27 | NM |
| 22 | 5180 | 3.37 | 1.21 | -0.22 | -0.05 | 0.17 | 0.16 | 0.38 | M | |
| Ruprecht 4 | 3 | 5180 | 2.63 | 1.56 | 0.07 | -0.07 | 0.0 | 0.29 | 0.36 | M |
| 4 | 5150 | 2.52 | 1.66 | -0.04 | 0.02 | 0.06 | 0.24 | 0.28 | M | |
| 8 | 5190 | 2.64 | 1.4 | -0.16 | 0.03 | 0.19 | 0.18 | 0.34 | M | |
| 18 | 5040 | 3.17 | 1.2 | -0.35 | -0.24 | 0.09 | -0.4 | -0.05 | NM | |
| 29 | 4920 | 2.78 | 1.37 | -0.34 | -0.37 | -0.03 | -0.54 | -0.20 | NM | |
| Ruprecht 7 | 2 | 5160 | 2.12 | 1.62 | -0.34 | -0.29 | 0.05 | 0.15 | 0.49 | M |
| 4 | 5105 | 2.05 | 1.9 | -0.24 | -0.2 | 0.05 | 0.32 | 0.56 | M | |
| 5 | 5230 | 2.19 | 2.1 | -0.27 | -0.19 | 0.08 | 0.28 | 0.55 | M | |
| 6 | 5230 | 2.23 | 2.08 | -0.2 | -0.16 | 0.04 | 0.31 | 0.51 | M | |
| 7 | 5150 | 2.4 | 1.82 | -0.25 | -0.31 | -0.06 | 0.23 | 0.48 | M | |
| NGC6192 | 9 | 5050 | 2.3 | 1.75 | 0.19 | 0.15 | -0.04 | 0.43 | 0.24 | M |
| 45 | 5020 | 2.55 | 1.60 | 0.08 | 0.22 | 0.14 | 0.43 | 0.35 | M | |
| 96 | 5050 | 2.3 | 2.10 | 0.13 | 0.10 | -0.03 | 0.35 | 0.22 | M | |
| 137 | 4670 | 2.1 | 1.80 | 0.07 | 0.10 | 0.03 | 0.4 | 0.33 | M | |
| NGC6404 | 5 | 5000 | 1.0 | 2.60 | 0.05 | 0.11 | 0.06 | – | – | M |
| 16 | 4450 | 1.65 | 2.10 | 0.07 | 0.04 | -0.03 | 0.27 | 0.2 | M | |
| 27 | 4400 | 1.40 | 1.80 | 0.20 | 0.00 | -0.20 | 0.47 | 0.27 | M | |
| 40 | 4250 | 2.3 | 1.40 | 0.11 | 0.18 | 0.07 | 0.39 | 0.28 | M | |
| NGC6583 | 46 | 5100 | 2.95 | 1.45 | 0.40 | 0.21 | -0.19 | 0.38 | -0.02 | M |
| 62 | 5050 | 2.75 | 1.45 | 0.34 | – | – | 0.27 | -0.07 | M |
4 The dependence of the yttrium and barium abundances on age.
We compared (see Fig. 8) the obtained values of the yttrium [Y/Fe] and barium [Ba/Fe] abundances with estimates from other authors, for a number of open clusters (D’ Orazi et al. 2009; Pancino et al. 2010; Carrera & Pancino 2011; Maiorca et al. 2011; D’ Orazi et al. 2012; Reddy, Giridhar & Lambert 2012; Bragaglia et al. 2008; Yong et al. 2005). The data for the thin disc stars were taken from the study by Mishenina et al. (2012). As is seen in Fig. 8, there is a slight trend for yttrium (from -0.2 dex to 0.2 dex) with increasing age. The data for the same young clusters obtained by Carrera & Pancino (2011), differ from those by Maiorca et al. (2011) on average of 0.2 dex, which, nonetheless, is within the range of the claimed accuracy.
Our yttrium abundances for other young clusters are also slightly higher than Carrera & Pancino (2011); however, they nicely agree with the results from other authors. Overall, the behavior of the yttrium abundance nicely agrees with modern chemical evolution models (with the possible exception of the outlier cluster Berkeley 29, age 4.3 Gyr, [Y/Fe] = 0.35 dex (Maiorca et al., 2011).
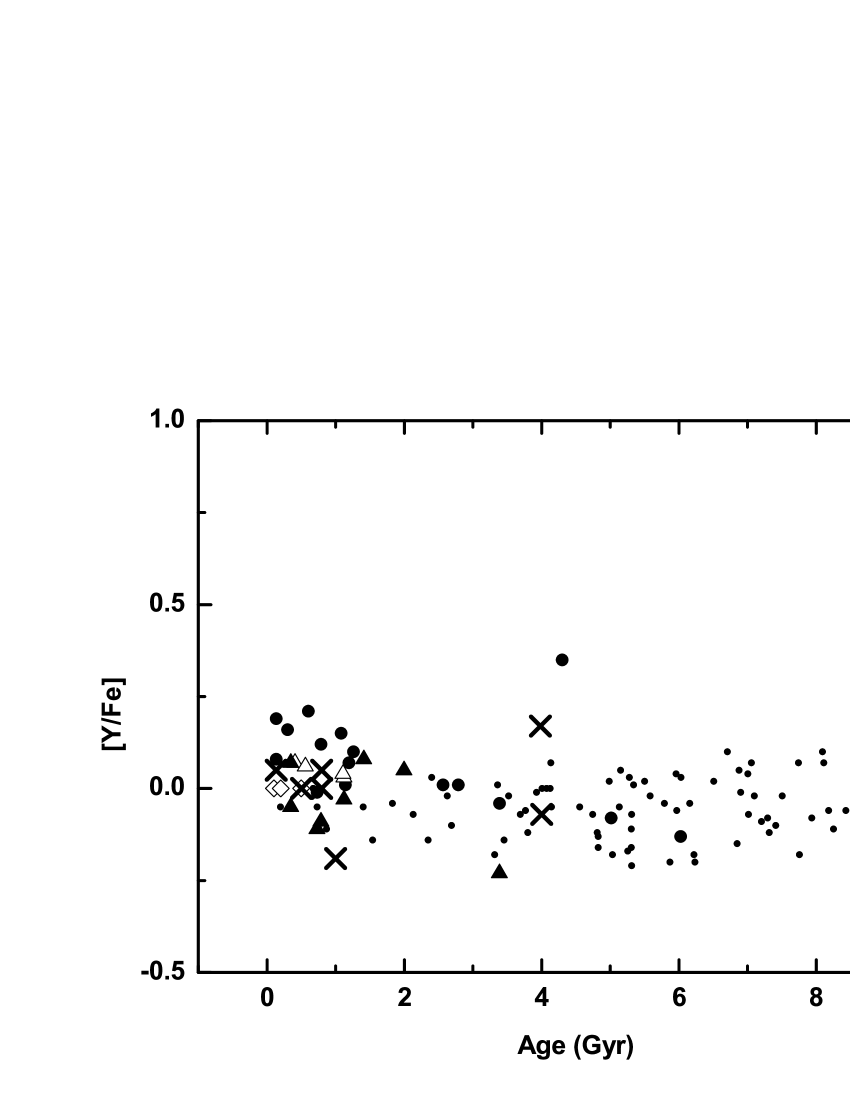
The fact that the correlation of the yttrium abundance and the ages of the stars is similar for the clusters and the thin disc favors a similarity of origin of the stars of the thin disc and open clusters. As shown by Roser et al. (2010), open clusters delivered up to 40% of the disc stars over the typical Galactic disc life-time.
The moderate trend we detect can be indicative of the increase in contributions into the enrichment of the interstellar medium from the least-massive AGB stars ().
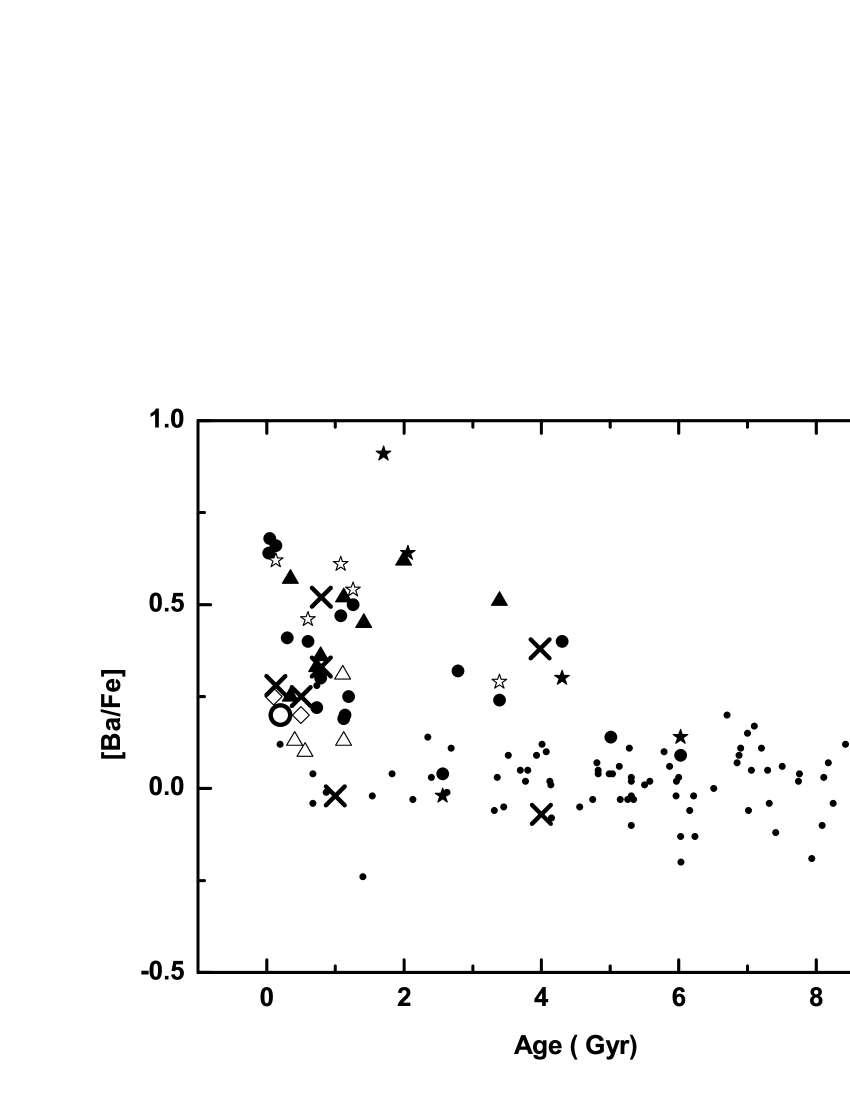
As for barium, we observe a significant trend and a large spread of the values. The obtained average values for the two youngest clusters Ruprecht 4 and Ruprecht 7 (with ages of about 0.8 Gyr) are [Ba/Fe] = 0.33 and 0.56 dex, respectively. A rather high value was also determined for cluster Berkeley 75 (with an age of about 3 Gyr), namely [Ba/Fe] = 0.38 dex for star . Thus, young cluster stars exhibit different barium abundances from moderate values of 0.2–0.3 dex to 0.6 dex.
The behavior of moderately over-abundant barium objects is in line with the yttrium behavior. However, neither higher values of [Ba/Fe] nor its sharp increase at young ages can be explained at the moment.
In an attempt to better understand what is happening, we included in the discussion the yttrium and barium abundances in Galactic Cepheids (the disc young stars with ages around 0.2–0.4 Gyr) as determined by (Luck & Lambert 2011 (Y), Andrievsky et al. 2013 (Ba)). In Fig. 8, the average values are marked with large empty circles. A good agreement is observed for the yttrium, but the average values of barium in the Cepheids are significantly lower than 0.6 dex, while the values of [Ba/Fe] themselves are within the range from -0.05 dex to 0.4 dex with the average value of 0.2 dex (Andrievsky et al., 2013). Taking errors into account, the spread in barium values is the same as in open clusters.
The problem of barium abundance remains, therefore, unsolved in the framework of chemical evolution models. It is also difficult to accept the idea that all giants in open clusters showing such over-abundance can fall in the Barium stars class (Bidelman & Keenan, 1951).
5 The dependence of Y and Ba abundances on the Galactic location for younger clusters
To determine the correlation between the yttrium and barium abundances and the galaxy-centric distances, we compared the mean values of [Y/H] and [Ba/H] for young clusters -both from us (Ruprecht 4, Ruprecht 7, NGC 6192, NGC 6404, NGC 6583) and from other authors- with those for Cepheids and young stars of the Galaxy disc (Luck & Lambert 2011 (Y); Andrievsky et al. 2013 (Ba)) (see Figs. 9 and 10). To consistently compare the data with those for the Cepheids, the galacto-centric distances for all clusters were recomputed adopting 7.9 kpc as Sun distance from the centre of the Galaxy. The galaxy-centric distances for the program clusters were computed with the following formula (the distances are given in pc):
| (1) |
where RG,⊙ is the galacto-centric distance of the Sun, d is the heliocentric distance of a cluster, l is the galactic longitude, and b is the galactic latitude. The galacto-centric distance of the Sun RG,⊙ = 7.9 kpc was adopted from the recent determination by McNamara et al. (2000). The distribution of the analyzed clusters in the galactic plane is shown in Figs. 9 and 10 .
The yttrium abundance in young open clusters mirrors the trend of Cepheids and confirms the existence of an yttrium abundance gradient in the Galactic disc.
Barium behaves differently. The Ba abundances in a number of clusters are within the same area as the Ba values for the Cepheids, but four clusters exhibit significant barium over-abundances that exceed the spread of values ([Ba/H] 0.5 dex) in the Cepheids. Those are IC 2391, NGC 2324, IC 2602 (D’ Orazi et al., 2009) and Ruprecht 7 (our determinations). The existence of such a sizable overabundance, especially for the Ruprecht 7, remains an open issue. This cannot be imputed to deviations from the LTE, since our estimates were obtained taking these effects into proper account. Moreover, as shown by D’ Orazi et al. (2012), this cannot be related to chromospheric activity.
We note that Ruprecht 7, besides showing a net over-abundance, also possesses an abnormal orbit according to the calculations by Vande Putte et al. (2010), Gozha, Borkova & Marsakov (2012). Unfortunately, however, the accuracy in the orbit determination (large proper motion errors for distant clusters, and the adopted fixed Galacti potential) does not allow us to further explore the possible consequences of this result.
Other scenarios have to be explored. We speculate that they possibly formed out of a metal poor environment previously contaminated by the close passage of high velocity clouds, or old, metal poor systems like globular clusters or dwarf galaxies.
6 Summary and conclusions
In this paper, yttrium and barium abundances are determined for 30 stars, including 22 stars in eight open clusters using modern techniques of chemical abundance analysis.
Our main conclusions can be summarized as follows:
-
The correlation between the yttrium abundance and the age is similar for the clusters and the thin disc, which seems to indicate similarity of origin for the Galactic thin disc and open clusters. The moderated yttrium over-abundance in young systems can be indicative of an increase of the contribution of the least-massive AGB stars with . The trend of yttrium for young open clusters with the galacto-centric distance is similar to the one obtained for the Cepheids, and it confirms the existence of an yttrium abundance gradient in the Galactic disc.
-
This sample of clusters shows significant barium overabundance, including young clusters as Ruprecht 7. Based on these results, we can suggest that barium overabundance is real and is not due to errors in the abundance determination. As an alternative, one has to invoke that this family of clusters is somehow peculiar, or their ambient formation has been contaminated in a very special way.
We conclude by suggesting that the study of the barium abundance (including the hyperfine structure and in the approximation of the NLTE) in as many stars and clusters as possible (especially young ones) is very welcome, and additional data should be provided.
Acknowledgments
The authors thank the referee Chris Sneden for carefully reading the article and useful suggestions that improved the presentation of the results. We express our gratitude to Sandy Strunk for reading carefully this manuscript. T.M. and S.K. thank for the support from the Swiss National Science Foundation, project SCOPES No. IZ73Z0-128180.
References
- Alonso et al. (1999) Alonso A., Arribas S., Martínez-Roger C., 1999, A&AS, 140, 261
- Andrievsky et al. (2009) Andrievsky S.M., Spite M., Korotin S.A. et al., 2009, A&A, 494, 1083
- Andrievsky et al. (2013) Andrievsky S.M., Lépine J.R.D, Korotin S.A., Luck R.E., Kovtyukh V.V., Maciel W.J., 2013, MNRAS, 428, 3252
- Bidelman & Keenan (1951) Bidelman W.P., Keenan P.C., 1951, ApJ, 114, 473
- Bragaglia et al. (2008) Bragaglia A., Sestito P., Villanova S., Carretta E., Randich S., Tosi M., 2008, A&A, 480, 79
- Brewer & Carney (2006) Brewer M.-M., Carney B.W., 2006, AJ, 131, 431
- Burbidge et al. (1957) Burbidge E. M., Burbidge G. R., Fowler W.A., Hoyle F., 1957, Reviews of Modern Physics, 29, 547
- Busso et al. (1999) Busso M., Gallino R., Wasserburg G. J., 1999, ARA&A 37, 239
- Busso et al. (2001) Busso V., Gallino R., Lambert D., Travaglio C., Smith, V., 2001, ApJ, 557, 802
- Cameron (1982) Cameron A.G.W., 1982, Ap&SS, 82, 123
- Carlsson (1986) Carlsson M., 1986, Uppsala Obs. Rep., 33
- Carraro et al. (2005a) Carraro G., Geisler D., Moitinho A., Baume G., Vázquez R. A., 2005a, A&A, 442, 917
- Carraro et al. (2005b) Carraro G., Geisler D., Baume G., V’azquez R. A., Moitinho A., 2005b, MNRAS, 360, 655
- Carraro et al. (2005c) Carraro G., Mendez R.A., Costa E., 2005c, MNRAS, 360, 655
- Carraro et al. (2007) Carraro G., Geisler D., Villanova S., Frinchaboy P. M., Majewski S. R., 2007, A&A 476, 217
- Carrera & Pancino (2011) Carrera R., Pancino E., 2011, A&A 535, 30
- Castelli & Kurucz (2004) Castelli F., Kurucz R.L., 2004, arXiv:astro-ph/0405087
- Chiappini et al. (1997) Chiappini C., Matteucci F., Gratton R., 1997, ApJ, 477, 765
- Claria et al. (2006) Claria J. J., Mermilliod J.-C., Piatti A. E., Parisi M. C., 2006, A&A, 453, 91
- Cristallo et al. (2009) Cristallo S., Straniero O., Gallino R., Piersanti L., Dominguez I., Lederer M.T., 2009, Ap.J., 696, 797.
- Desidera et al. (2011) Desidera S., Covino E., Messina S., D’ Orazi V., Alcala J. M., Brugaletta E., Carson J., Lanzafame A. C., Launhardt R.l., 2011, A&A, 529, 54
- D’ Orazi et al. (2009) D’ Orazi V., Magrini L., Randich S., Galli D., Busso M., Sestito P., 2009, ApJ, 693, 31
- D’ Orazi et al. (2012) D’ Orazi V. , Biazzo K., Desidera S., Covino E., Andrievsky S. M., Gratton R. G., 2012, MNRAS, 423, 2789
- Galazutdinov (1992) Galazutdinov G. A., 1992, Preprint SAO RAS., 92, 96
- Gallino et al. (1998) Gallino R., Arlandini C., Busso M., et al., 1998, ApJ, 497, 388
- Gozha, Borkova & Marsakov (2012) Gozha M.L., Borkova T. V., Marsakov V.A., 2012, Astron. Letters, 38, 506
- Jacobson, Friel & Pilachowski (2011) Jacobson H. R., Friel E. D., Pilachowski C. A., 2011, AJ, 141, 58
- Kappeler et al. (1989) Kappeler F., Beer H., Wisshak K., 1989, Reports on Progress in Physics, 52, 945
- Korotin et al. (2011) Korotin S.A., Mishenina T., Gorbaneva T., Soubiran C., 2011, MNRAS, 415, 2093
- Kovtyukh et al. (2003) Kovtyukh V.V., Soubiran C., Belik S.I., Gorlova N.I., 2003, A&A 411, 559
- Kupka et al. (1999) Kupka F., Piskunov N.E., Ryabchikova T.A., Stempels H. C., Weiss W. W., 1999, A&AS, 138, 119
- Kurucz et al. (1984) Kurucz R.L., Furenlid I., Brault J., Testerman L., 1984, Solar Flux atlas from 296 to 1300 nm, Nat. Solar Obs., Sunspot, New Mexico.
- Kurucz (1993) Kurucz R.L., 1993, CD ROM n13
- Luck & Lambert (2011) Luck R. E., Lambert D. L., 2011, AJ, 142, 136
- Maiorca et al. (2011) Maiorca E., Randich S., Busso M., Magrini L., Palmerini S.E., 2011, ApJ, 736, 120
- Magrini et al. (2010) Magrini L., Randich S., Zoccali M. et al., 2010, A&A, 523, id.A11
- McNamara et al. (2000) McNamara D. H., Madsen J. B., Barnes J., Ericksen, B. F., 2000, PASP, 112, 202
- Mishenina et al. (2012) Mishenina T. V., Soubiran C., Korotin S.A., Gorbaneva T.I., Basak N.Yu., 2012, in Reyle C., Robin A., Schultheis M., eds., EPJ Web Conf., 19, id.05006
- Pancino et al. (2010) Pancino E., Carrera R., Rossetti E., Gallart C., 2010, A&A, 511, id.A56.
- Reddy, Giridhar & Lambert (2012) Reddy A.B.S., Giridhar S., Lambert D. L., 2012, MNRAS, 419, 1350
- Roser et al. (2010) Roser S.R., Kharchenko N.V., Piskunov A.E. Schilbach E., Scholz R.-D., Zinnecker H., 2010, Astron. Nachr., 331, 519
- Rutten (1978) Rutten R.J., 1978, SoPh 56, 237
- Serminato et al. (2009) Serminato A., Gallino R., Travaglio C., Bisterzo S., Straniero O., 2009, Publ. Astron. Soc. of Australia, 26, 153
- Soubiran & Girard (2005) Soubiran C., Girard P., 2005, A&A, 438, 139
- Sneden (1973) Sneden C., 1973, ApJ, 184, 839
- Straniero, Cristallo & Gallino (2009) Straniero O., Cristallo S., Gallino R., 2009, Publ. Astron. Soc. of Australia, 26, 133
- Travaglio et al. (1999) Travaglio C., Galli D., Gallino R., Busso M., Ferrini F., Straniero O., 1999, ApJ, 521, 691
- Tsymbal (1996) Tsymbal V.V., 1996, ASP Conf. Ser., 108, 198
- Vande Putte et al. (2010) Vande Putte D., Garnier T.P., Ferreras I., Mignani R. P., Cropper M., 2010, MNRAS, 407, 2109
- Yong et al. (2005) Yong D., Carney B. W., Teixera de Almeida M.-L., 2005, AJ, 130, 597