Mathematical Modeling of Product Rating: Sufficiency, Misbehavior and Aggregation Rules
Abstract
Many web services like eBay, Tripadvisor, Epinions, etc, provide historical product ratings so that users can evaluate the quality of products. Product ratings are important since they affect how well a product will be adopted by the market. The challenge is that we only have ”partial information” on these ratings: Each user provides ratings to only a ”small subset of products”. Under this partial information setting, we explore a number of fundamental questions: What is the ”minimum number of ratings” a product needs so one can make a reliable evaluation of its quality? How users’ misbehavior (such as cheating) in product rating may affect the evaluation result? To answer these questions, we present a formal mathematical model of product evaluation based on partial information. We derive theoretical bounds on the minimum number of ratings needed to produce a reliable indicator of a product’s quality. We also extend our model to accommodate users’ misbehavior in product rating. We carry out experiments using both synthetic and real-world data (from TripAdvisor, Amazon and eBay) to validate our model, and also show that using the ”majority rating rule” to aggregate product ratings, it produces more reliable and robust product evaluation results than the ”average rating rule”.
1 Introduction
Nowadays, it is common in many web services that users can contribute their opinions in the form of ratings or reviews. For example, we see ratings or reviews in content sharing sites (i.e., Flickr, YouTube, etc), online recommendation systems (i.e., Amazon, MovieLens, etc), product review sites (i.e., Epinions, TripAdvisor, etc), and online e-commerce systems (i.e., eBay, etc), etc. With these ratings and product reviews, one can perform information search or make purchase decisions by taking advantage of the opinions of other users (aka ”wisdom of the crowd”). Web-based online rating systems can be briefly described as follows: There are a number of items (either products or services), each user provides ratings or reviews to a subset of items, and ratings of an item will be available to the public.
Based on how these ratings are being used, online rating systems can be classified into two categories. The first category interprets ratings as public assessment on products[13, 20], where the main interest is in assisting users to evaluate products’ quality. For example, in eBay, ratings are used to reflect the quality a product or the reputation of a seller. Other examples of this type of web services include Tripadvisor, Epinions, Wikipedia, etc. For these web services, users want to know whether the quality of a product is as good as its declared historical ratings, or whether the reputation of a seller is fully reflected by its historical ratings. The second category interprets ratings as users’ preference information and they are used in users’ preference modeling. This is the view adopted by researchers in online recommendation systems[2, 18], i.e., in Amazon and MovieLens, users’ ratings are used to infer users’ preferences[7, 17, 18] as to make personalized recommendations.
In this paper, we focus on the first category of online rating systems, in which ratings are interpreted as product quality assessment. Although there are wide deployment of product ratings in web services, people only have partial information on these ratings: each user only expresses ratings to a small subset of products. Hence, it is important to understand the ”accuracy” and ”effectiveness” of online rating systems. Little attention has been paid to this fundamental question. The goal of this paper is to fill this void. We first provide a mathematical model for a general online rating system, then we explore a number of fundamental questions, i.e., (a) What is the minimum number of ratings a product needs so as to have a reliable reflection on its quality? (b) How users’ misbehavior may affect the the accuracy? To the best of our knowledge, this is the first paper that provides a formal mathematical model and analysis on such problem. Our contributions are:
-
•
We propose a mathematical model to specify the rating behavior of users to a set of products. Our model is general enough to represent both honest and misbehaving users in product rating. We analyze the model and derive the minimum number of ratings we need to produce a reliable reflection on a product’s quality. We also derive the minimum fraction of misbehaving users such that they can manipulate an online rating system (please refer to Section 2 and 3).
-
•
We propose an inference algorithm to infer parameters of our model from partial information, say available products’ ratings (please refer to Section 4).
- •
-
•
We perform experiments using both synthetic data and real-world data (data set from TripAdvisor, Amazon and eBay) to validate our framework and to examine various factors that may affect product quality evaluation. We find a number of interesting observations, i.e., the system can resist a small fraction of misbehaving users. For TtripAdvisor, Amazon, and Ebay, we also show why the majority rule is more robust and reliable than the average scoring rule in evaluating products’ quality. (please refer to Section 5 and Section 6).
This is the outline of the paper. In §2, we present the mathematical model of product rating systems. In §3, we show the analysis and derive theoretical results for two rating aggregation rules under normal or misbehaving setting. In §4, we present an inference algorithm to infer the parameters of our model. In §5, we present our experimental results using synthetic data. In §6, we present our experimental results using real-world data. Related work is given in §7 and §8 concludes.
2 Mathematical Model
Let there be a finite set of products denoted by . We have users denote by . Each user only expresses ratings to a subset of products on an -level cardinal metric where ratings are drawn from , i.e., a 3-level cardinal metric could be: . Ratings from users are independent. Product is rated by users. Let denote a set of ratings of product , where if user rates product , otherwise . Higher rating implies higher quality. We treat the available ratings as partial information because some . To make a purchase decision, a user evaluates the quality of products relying on historical product ratings. The objective of this work is to answer how various factors can influence the evaluation accuracy.
Let denote a rating aggregation rule which is used to summarize all ratings of a product. Two commonly used rating aggregating rules are the majority rule and the average scoring rule.
Majority rule. It evaluates the quality of a product via the majority ratings. Let represents the label which reflects the true quality of product under this policy. Let denote the evaluated label of product produced by applying the majority rule. The label can be computed as follows. Let be the number of ratings of that is of level , where . Then . There are a number of interesting questions to explore, i.e., How many ratings, or , do we need so as to have a strong guarantee in revealing the true label, or with high probability?
Average scoring rule. It evaluates the quality of a product via averaging all ratings of that product. Let denote the true quality of under this policy. Let denote the evaluated label of using the average scoring rule. Again, there are number of interesting questions to explore, i.e., how many ratings, or do we need, such that accurately reflects ?
Remark: There should be no confusion between and . They show two different ways in evaluating the quality of products either by the ratings of the majority population, or by averaging the ratings on the whole population respectively.
Because each user may rate a product differently. To describe a user’s rating behavior, let us first present the probabilistic model in product rating.
2.1 Model for rating behavior
When rating a product, a user needs to evaluate its quality. We consider two most important factors that may affect the evaluation: (a) intrinsic quality of products, and (b) preference of users on a product. The rating behavior of different users can be modeled by a random variable in which one can vary its mean or variance to reflect the above factors. Specifically, a higher mean implies that the product has a higher intrinsic quality, while a smaller variance implies that a user prefers a particular branding.
To illustrate, consider the user who rates product , and the rating is . The rating is a random variable, and its probability mass function (pmf) is:
| (1) |
where and . One can set the mean or variance by varying the probability mass distribution to reflect different intrinsic quality or users preference on product . To model the collective rating behavior of the whole user population over product , let
denote the space over all the possible probability distributions of a rating. We assume that there is an underlying distribution, say , over the space , that defines the collective rating behavior of the whole user population over product . In this study, is a Dirichlet distribution with density function:
| (2) |
where , and .
Remark: The choice of Dirichlet distribution is validated in [3].
3 Theoretical Analysis
In this section, we analyze two most representative rating aggregation rules: majority rule and average scoring rule, that are widely used in online rating systems. The central question we seek to answer is how many ratings of a given product we need so that the aggregate rating is statistically accurate to reflect the ground truth of that product’s quality? Furthermore, we also analyze the impact of misbehavior in product rating, e.g., when users intentionally rate a product beyond its ground truth level. In this section, we assume that the model parameters , are given. In Section 4, we will show how to infer these parameters from historical ratings.
3.1 Majority rule
Majority rule is suggested as a good rule to aggregate ratings[1]. This rule helps a user to understand how receptive the majority of the masses are toward a given product. Note that we only have partial information, and this makes it challenging to extract the true label of products. There are a number of interesting questions to explore, i.e., how many ratings do we need so that we can extract the true label with high probability? What is the effect of misbehavior in ratings? Let us begin our exploration by a simple case, say all users rate products honestly.
Analysis for Honest Rating: In this case, we assume that with a large enough number of ratings, one can successfully extract the true label of products. Recall that is the label of product produced by using the majority rule on its ratings, and is the true label of product . Intuitively, the true label of product occurs when . Recall that has ratings and its rating set is , where missing ratings are denoted by zeros. For convenience, here we use to denote a set of all positive (or observed) ratings of . Let us state the probability mass function (pmf) of , in the following lemma.
Lemma 1
The pmf of the rating is:
where and .
Proof: Please refer to the appendix for derivation.
Lemma 1 states that the probability of product receiving a rating is . It follows that . Let denote the second largest value among . Now we state the main theorem for the honest rating case.
Theorem 1 (Honest Rating Case)
Suppose all users rate honestly, and product has at least
| (3) |
ratings, then one can claim with high probability that the true label of product is . Mathematically, we have: .
Proof: Please refer to the appendix for derivation.
Table 1 shows some numerical results on the minimum number of ratings we need when all users rate honestly. It depicts the level of rating metric , the model parameter , the success probability and the lower bound of the minimum number of ratings denoted by respectively. From the table, we see that if we increase the success probability , we also need to increase .
| 5 | 0.7 | 67 | |
| 5 | 0.8 | 77 | |
| 5 | 0.9 | 93 |
Remark: Theorem 1 gives an lower bound on the minimum number of ratings . One may ask whether this bound is sufficiently tight. The following theorem answers this question.
Theorem 2 (Tightness)
Suppose all users rate honestly and . Then there exist a positive constant , such that for any , if product has at most
ratings, then we will fail to extract the true label with probability at least .
Proof: Please refer to the appendix for derivation.
Analysis of Rating under Misbehavior: Let us now explore the effect misbehavior in ratings. We consider the following typical cases of misbehavior:
-
•
Random misbehavior. A random misbehavior implies that a user assigns a random rating to a product. This is one typical misbehavior, because sometimes a user may not want to spend time to evaluate the quality of a product so that user just generates random rating.
-
•
Biased misbehavior: A biased misbehavior implies that a user is biased toward one particular rating, i.e., a user may be hired by a company to assign the lowest rating to a competitor’s product, or assign the highest rating to his employer’s product. This type of misbehavior has been observed in many web services, i.e., reported in TripAdvisor[1].
In the remaining of this sub-section, we model the ratings of misbehaving users as noise. We specify the collective rating behavior of honest users to product using our model with parameter . Again, is the true label of product and is the second largest value among . The following theorem states the effect of random misbehavior.
Theorem 3 (Resist Random Misbehavior)
Let denote the fraction of random misbehaving users who rate product . If product has
ratings, then one can claim with high probability that the true label of product is . Mathematically, we have: .
Proof: Please refer to the appendix for derivation.
Remark: Theorem 3 states that if the fraction of random misbehavior is less than 1, then one can always extract the true label of a product with a large enough number of ratings.
Table 2 shows some numerical results of the minimum number of ratings when some ratings are assigned by random misbehaving users. Table 2 depicts , , , , and the fraction of random misbehaving users respectively. We can see that if we increase , we also need to increase the minimum number of ratings.
| 5 | 0.8 | 0 | 77 | |
| 5 | 0.8 | 0.1 | 88 | |
| 5 | 0.8 | 0.2 | 102 |
We now consider the effect of biased misbehavior. Let denote the rating that biased misbehaving users bias toward. The goal of the biased users is to make the extracted label of a product to be the label that they bias toward. Then, how many biased users is needed such that they will achieve thier goal with high probability? The following theorem answers this question.
Theorem 4 (Biased Misbehaving Users Win)
Let denote the fraction of biased misbehaving users who rate product . If the fraction of biased misbehaving users is no less than then with at least
ratings, one can claim with high probability that the biased misbehaving users win. Mathematically, we have: .
Proof: Please refer to the appendix for derivation.
Remark: Theorem 4 states two conditions for biased misbehaving users to win: a large enough fraction of biased misbehaving users and a large enough number of such ratings.
Table 3 shows some numerical results of the minimum fraction of biased misbehaving users so that they can distort the evaluation process. Table 3 depicts , , , and the label that the biased misbehaving users bias toward respectively. From Table 3 we could see that if biased misbehaving users biased toward 5 (or 1), and to ensure they can distort, the minimum fraction of biased misbehaving users we need is 0.407 (or 0.375).
| 5 | 5 | 0.407 | |
| 5 | 1 | 0.375 |
Proposition 1
Suppose that the misbehaving users bias against the ground truth label, or . If the fraction of biased misbehaving users who rate product is at least , then it is impossible to extract the true label with high probability no matter how many ratings we have.
The following theorem states that when the fraction of biased misbehaving users is small, we can resist this type of anomaly.
Theorem 5 (Resist Biased Misbehavior)
Suppose that the biased misbehaving users bias against the ground truth label, say . If the fraction of biased misbehaving users who rate product is at most , then with at least
ratings, then one can claim with high probability that the true label of product is . Mathematically, we have: .
Proof: The derivation is similar to Theorem 4.
Table 4 shows some numerical examples of the minimum number of ratings we need to resist biased misbehavior, when the fraction of biased misbehaving users is small. From Table 4, we could see that when we increase the fraction of biased misbehaving users, we also need to increase the minimum number of ratings.
| 5 | 0.8 | 5 | 0 | 77 | |
| 5 | 0.8 | 5 | 0.1 | 93 | |
| 5 | 0.8 | 5 | 0.2 | 182 |
3.2 Average scoring rule
Average scoring rule evaluates the quality of a product by taking average on all ratings of that product. There are number of interesting question to explore, i.e., how many ratings do we need so that we can produce an average rating that reflects the quality of a product accurately? What is the effect of misbehavior in ratings? Let us explore these questions here.
Analysis for Honest Rating: We assume that for the honest rating case, with a large enough number of ratings, we can produce an average rating that reflects the quality of a product accurately. Recall that the average rating of product is , and is the ground truth value that reflects the true quality of product . Intuitively, can be computed by . From Lemma 1, we have that , where and . Thus, we have . Let us first explore the case that all users rate honestly. We present the main theorem for the honest rating case as follows.
Theorem 6 (Honest Rating Case)
Suppose all users rate honestly. If product has at least
| (4) |
ratings, then
holds with probability at least .
Proof: Please refer to the appendix for derivation.
Remark: The physical meaning of Theorem 6 is that with a large enough number of ratings, we can produce an accurate estimation of with an arbitrarily small error .
Table 5 shows some numerical results on the minimum number of ratings we need to produce an accurate estimation of when all users rate honestly. Table 5 depicts , , , and the absolute error bound between average rating and its ground truth value, or respectively. We could see that increasing the minimum number of ratings will decrease the error. It is also interesting to observe that using the average score rule, we need at least 221 ratings, while one only needs 77 ratings using the majority rule (please refer to Table 1).
| 5 | 0.8 | 1 | 221 | |
| 5 | 0.8 | 0.75 | 366 | |
| 5 | 0.8 | 0.5 | 716 |
Analysis of Rating under Misbehavior: We consider random misbehavior and biased misbehavior specified in last sub-section. We treat the ratings of misbehaving users as noise. The collective rating behavior of the honest users to product is specified by our model with parameter and is the ground truth value of average rating of product . The following theorems state the effect of random misbehavior and biased misbehavior respectively.
Theorem 7 (Random Misbehavior)
Let denote the fraction of random misbehaving users who rate product . If product has ratings, then
holds with probability at least .
Proof: Please refer to the appendix for derivation.
Theorem 8 (Biased Misbehavior)
Let denote the rating that the biased misbehaving users bias toward. Let denote the fraction of biased misbehaving users who rate product . If product has ratings, then
holds with probability at least .
Proof: Please refer to the appendix for derivation.
Remark: The physical meaning of Theorem 7 and 8 is that average scoring rule is sensitive to random and biased misbehavior. If the fraction of misbehaving users is small, then we can still reflect the true quality of products with a high probability, otherwise it is impossible to accurately reveal the ground truth.
4 Inferring Model Parameters
In last section, we presented the formal analysis of our model with the assumption that the model’s parameters are known. In this section, we show how to obtain these parameters’ values by presenting a maximum likelihood inference algorithm to infer these parameters from partial information, or historical ratings. With this inference algorithm, we can apply our framework to analyze and improve the applications of online rating systems in web services, i.e., eBay, TripAdvisor, etc.
Recall that represents a set of all observed ratings of product . We seek to infer from . From Lemma 1, we could write down the probability mass function (pmf) of as follows: , where and . Let denote the number of ratings of product that equal to . Then the likelihood of the parameter given a set of observed ratings can be expressed as:
The remaining issue is to derive the maximum likelihood estimation of the parameter , which is denoted by , via maximizing . This is equivalent to maximize the log likelihood function:
By maximizing , we obtain the maximum likelihood estimation of as follows:
The inference algorithm is outlined in Algorithm 1.
Remark: The running time of this algorithm is , or the running time is linear with respect to the number of ratings.
5 Experiments on Synthetic Data
Let us first use synthetic data to examine various factors that influence the accuracy of product quality evaluation. This will help us gain some insights on improving applications of online rating systems. We consider an online rating system with a 5-level cardinal rating metric, say . We start our evaluation from the context where the majority rule is used to aggregate ratings. Then we discuss the context corresponding to the average scoring rule.
5.1 Majority rule
We start with the case that all users are honest, then explore when some users misbehave in their ratings.
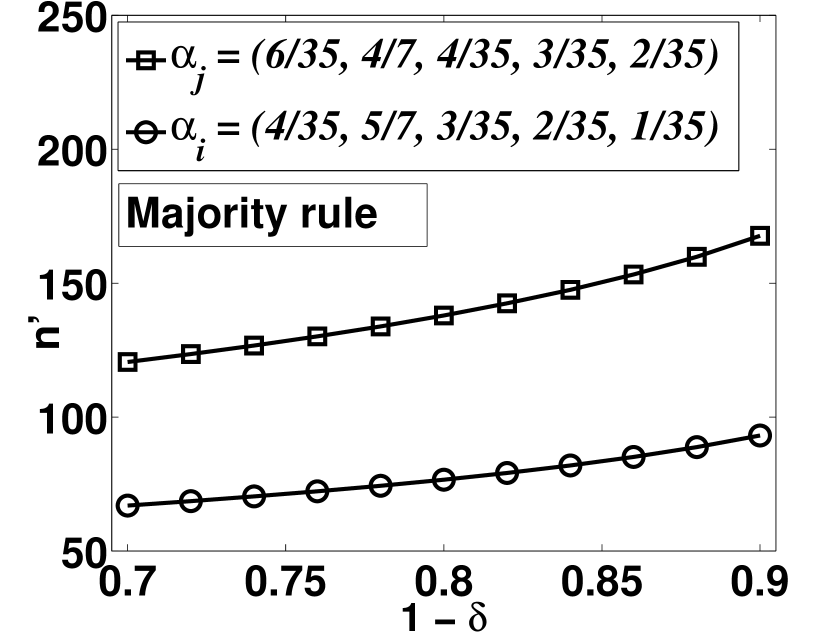
Experiment 1: Effect of Model Parameter and Success Probability. In this experiment, we study the honest ratings case where all users rate honestly. To examine the effect of model parameters, we synthesize the ratings of two products, say and , using our model with parameter and respectively. Let denote the minimum number of ratings we need to extract the true label of a product with success probability of at least . To examine the effect of the success probability, we vary from 0.7 to 0.9. The numerical results of are shown in Fig. 2, where the horizontal axis represents the success probability, or , and the vertical axis shows the corresponding minimum number of ratings, or . From Fig. 2 we have the following observations. First, when we increase the success probability, or , the minimum number of ratings increased. In other words, to improve the success probability, we need a larger the number of ratings. Note that the minimum number of ratings increases only with a small rate. To extract the true label with the same probability, we need far more ratings for product (with a higher variance in rating scores than ) than .
Lessons learned: Increasing the success probability increases the minimum number of ratings. The variance on rating scores of a product has a significant impact on the minimum number of ratings. So it is interesting to explore further, i.e., are these results sensitive to misbehavior? Let us continue to explore.
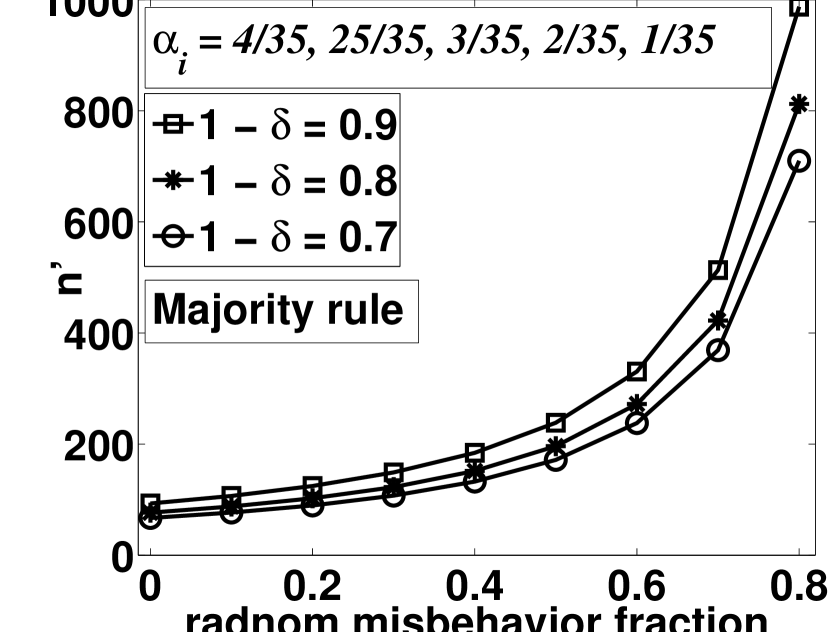
Experiment 2: Effect of Random Misbehavior. We extend the online rating system specified in Exp. 1 to a system where the user population consists of honest users and random misbehaving users. We synthesize the ratings of product from the honest users using our model with parameter . Here represents the same measure as specified in Exp. 1. To examine the effect of random misbehavior, we vary the fraction of random misbehaving users from 0 to 0.8. The numerical results of are shown in Fig. 2 in which three curves correspond to success probability of at least 0.7, 0.8, 0.9 respectively. We can observe that when the fraction of misbehavior is less than 0.6, increasing the fraction of random misbehaving users only increases the minimum number of ratings slightly. When the fraction of misbehavior is larger than 0.6, a small increase in the fraction of random misbehavior can increase the minimum number of ratings remarkably.
Lessons learned: When random misbehaving users exist, one can still extract the true label of a product with a price of increasing the minimum number of ratings. A small fraction of random misbehavior only increases the minimum number of ratings slightly. This shows the robustness of majority rule. But when this fraction is increased beyond a certain threshold, we need a lot more ratings to compensate. Next, we explore the impact of biased misbehavior in users’ ratings.
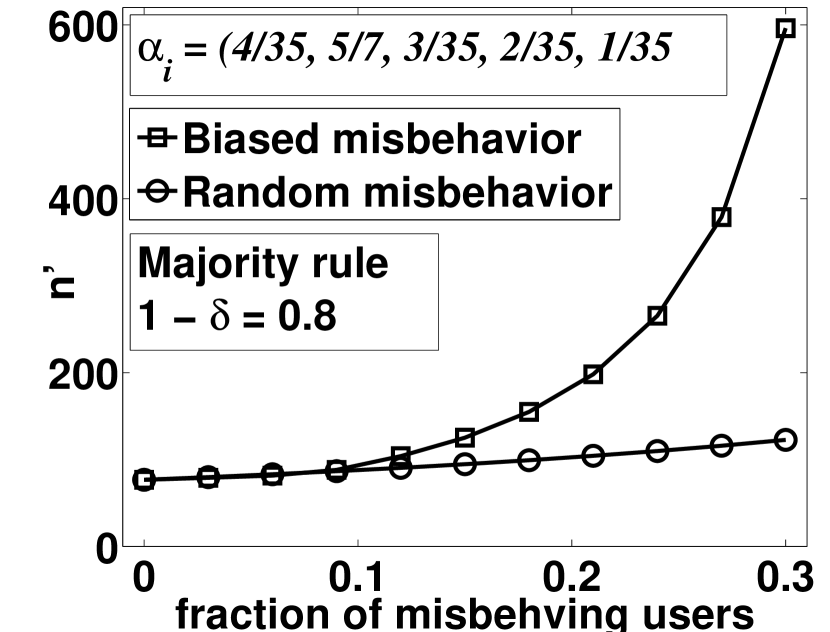
Experiment 3: Effect of Biased Misbehavior. We extend the online rating system specified in Exp. 1 to the system where the user population consists of honest users and biased misbehaving users who bias toward one specific rating. We synthesize the ratings of product from the honest users using our model with parameter . The biased misbehaving users bias toward rating 5. From Theorem 4 and 5, one can still extract the true label with a high probability if the fraction of biased misbehaving users is less than 0.407. But if that fraction is larger than 0.407, then it is impossible to extract the true label with high probability. We vary the fraction of biased misbehaving users from 0 to 0.3. Here represents the same measure as specified in Exp. 1. The numerical results of are shown in Fig. 4. To compare the impact of random misbehavior and biased misbehavior, we draw another curve corresponding to random misbehavior in Fig. 4 also. From Fig. 4 we have the following observations. When the fraction of biased misbehaving users is small, say less than 0.1, increasing the fraction of biased misbehaving users only increases the minimum number of ratings slightly. When that fraction is larger than 0.1, a small increase in the fraction of biased misbehaving users can remarkably increase the minimum number of ratings needed. The majority rule is more robust against random misbehavior compared to biased misbehavior, since the curve corresponding to random misbehavior is quite flat.
Lessons learned: Majority rule is robust and can resist a small fraction, say less than 0.1, of biased misbehaving users. Also, the majority rule is robust against random misbehavior. The biased misbehavior is more disruptive than the random misbehavior in distorting the evaluation process.
5.2 Average scoring rule
We start our study with a simple case, say all users rate honestly.
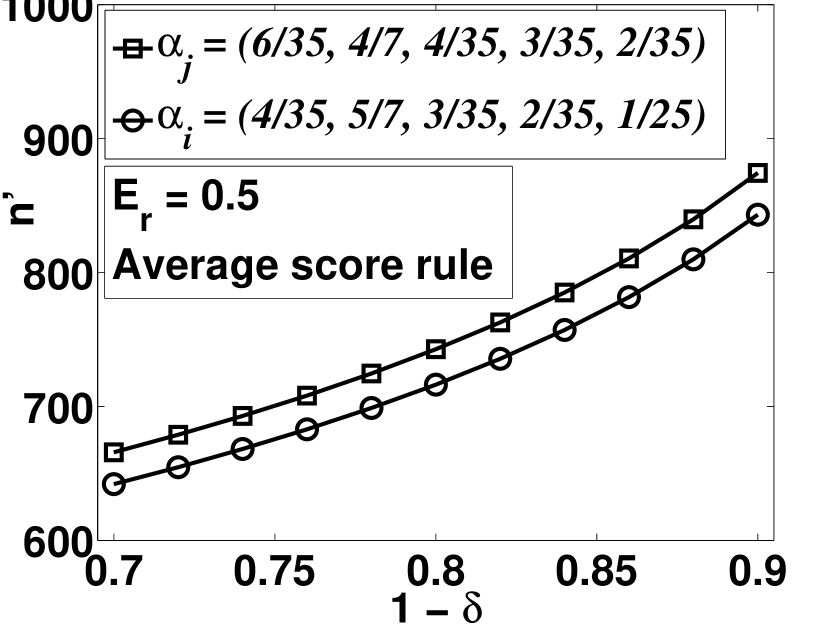
Experiment 4: Effect of Model Parameters and Success Probability. We study the case where all users rate honestly. To examine the effect of model parameters, we synthesize the ratings of two products, say and , using our model with parameter and respectively. Let denote the absolute error bound between the average rating and its ground truth value. We set . Let denote the minimum number of ratings a product needs so as to guarantee that the absolute error is less or equal to with probability of at least . We vary the success probability from 0.7 to 0.9. The numerical results of are shown in Fig. 4, where the horizontal axis represents the success probability, or , and the vertical axis shows the corresponding minimum number of ratings, or . We have the following observations. The minimum number of ratings is insensitive to the given parameters and , since these two curves in Fig. 4 similar. When we increase the success probability, we increase the minimum number of ratings slightly.
Now we compare the performance of the two score aggregation rules we study. We compare the minimum number of ratings for the majority rule and the average scoring rule and the results are shown in Table 6. One can see that to achieve the same level of confidence, we need a lot more ratings for average scoring rule.
Lessons learned: To obtain a reliable evaluation of product quality using the average scoring rule, we need remarkably more ratings than using the majority rule. The minimum number of ratings is insensitive to model parameters or success probability. This implies that the majority rule requires less ratings to guarantee the same level of confidence, so it is the preferred rating aggregation rule.
| 0.7 | 0.75 | 0.8 | 0.85 | 0.9 | |
|---|---|---|---|---|---|
| (majority) | 67 | 70 | 77 | 83 | 93 |
| (average score) | 642 | 675 | 716 | 769 | 843 |
Effect of Misbehavior. To examine the effect of misbehavior, we extend the online rating system as specified in Exp. 4: one consists of honest users and random misbehaving users, and the other one consists of honest users and biased misbehaving users. We synthesize the ratings of product from the honest users using our model with parameter . The biased misbehaving users bias toward rating 5. For both extensions, we vary the fraction of misbehaving users from 0.1 to 0.3. Here and (set to 0.5) represents the same measure as specified in Exp. 4. The numerical results of are shown in Table 7. To compare the robustness of the majority rule and the average scoring rule, we show the numerical results of corresponding to the majority rule in the same table. From Table 7, we could see that the majority rule is more robust against misbehavior (either random misbehavior or biased misbehavior), since to resist the same fraction of misbehaving users, the average scoring rule requires a lot more ratings.
| Random misbehavior | |||||
|---|---|---|---|---|---|
| fraction of bad users | 0.1 | 0.15 | 0.2 | 0.25 | 0.3 |
| (majority) | 89 | 94 | 102 | 112 | 122 |
| (average score) | 842 | 882 | 947 | 1018 | 1099 |
| Biased misbehavior | |||||
| fraction of bad users | 0.1 | 0.15 | 0.2 | 0.25 | 0.3 |
| (majority) | 93 | 125 | 181 | 296 | 259 |
| (average score) | 1107 | 1452 | 2027 | 3110 | 5600 |
6 Experiments on real data
In this section, we show the experimental results on three large datasets which we obtain via web crawling: hotel ratings from TripAdvisor, product ratings from Amazon, and seller ratings from Ebay. We first validate our model with these three datasets, and then explore a number of important questions, i.e., what’s the minimum number of ratings a hotel/product/seller needs to receive so that one can evaluate its quality accurately?
6.1 Datasets
TripAdvisor. It is one of the most popular travel websites which assists customers in booking hotels, restaurants, etc, and post travel-related opinions in the form of ratings (or reviews) to hotels, restaurants, etc. We crawled the historical ratings of 11,540 hotels. Table 8 shows the overall statistics of the data set.
Amazon. Amazon is one of the most popular recommendation systems that assists customers in product adoption, and one can post opinions on products in the form of ratings (or reviews). We crawled the historical ratings of 32,888 products. Table 8 shows the overall statistics of the data set.
Ebay. Ebay is an E-commerce system that assists customers in online product purchasing, and customers can post opinions of sellers in the form of ratings (or reviews) to reflect the reputation of a seller. We crawled the historical ratings of 4,586 sellers. Table 8 shows the overall statistics of the data set.
| TripAdvisor | Amazon | Ebay | |
| Number of items | 11,540 | 32,888 | 4,586 |
| Total number of ratings | 3,114,876 | 5,066,070 | 19,217,083 |
| Maximum / Minimum on | 9930/1 | 24,195/1 | 117,100/1 |
| number of ratings | |||
| Mean / Median on | 269.9/179 | 154/47 | 4190/1437 |
| number of ratings | |||
| Rating metricr: |
6.2 Model validation
We validate our model by showing that if an item meets the requirement on minimum number of ratings, then the evaluation of its quality is indeed reliable.
Extract minimum number of ratings. To extract the minimum number of ratings, we need to first estimate model parameters . Since the accuracy depends on the number of ratings, therefore, we select those items with a large number of ratings, i.e., those with at least 400 ratings. Table 9 shows the number of items in the dataset satisfy this selection criteria. From Table 9 we could see that in total we select items out. We map the ID of these 8071 items to and use to denote them. For each selected item , we applly Algorithm 1 on their rating sets, so as to obtain an estimation of its model parameter denoted by . We use the inferred parameters to compute the minimum number of ratings for item , setting the success probability , and . We use to denote the desired minimum number of ratings an item needs.
Model validation algorithm design. The dataset is with time stamps. Based on this, our validation procedure can be stated as follows. For each time stamp we first check if the number of ratings of a hotel (up to that time stamp) meets the requirement on minimum number of ratings. If yes, we then apply a rating aggregation rule to evaluate its quality (based on the historical ratings up to that time stamp), and check if the evaluation is reliable. After we finished the whole process, we compute the faction of evaluations which are reliable. We outline our model validation algorithm in Algorithm 2. We use the following notations in the algorithm. For each hotel, we sort its ratings based on ratings’ times tamps. Let denote a set of sorted ratings of hotel , where , is the number of ratings of , and is the earliest rating. Let denote the number of time stamps that an item meets the desired minimum number of ratings, denote the number of reliable evaluations, and the faction of reliable evaluations is denoted by .
| TripAdvisor | Amazon | Ebay | |
|---|---|---|---|
| of selected items | 2368 | 2396 | 3307 |
We apply Algorithm 2 on TripAdvisor, Amazon and Ebay datasets respectively, and we compute the faction of reliable evaluations for each of them seperately. The results of are shown in Table 10, which depicts rating aggregation rules, the number of time stamps a hotel meets the requirement of minimum number of ratings , the number of reliable evaluations , and the faction of reliable evaluations . From Table 10, we have two observations. First, if a product meets the requirement on minimum number of ratings, then the evaluation of its quality is indeed reliable, because the value of is around 99%. This shows the correctness of our model and our mathematical framework. Secondly, it shows the robustness of the majority rule since we have more time stamps (or ratings) that satisfy the minimum requirement. In fact, the majority rule has around three times (836088 / 296309 2.82, TripAdvisor), two times (2246804 / 981886 2.29, Amazon), and 1.28 times (16667935 / 13008919 1.28, Ebay) the number of ratings that can be used for reliable evaluation. We explore why this is the case in the next subsection.
| Aggregation Rule | |||
| TripAdvisor | |||
| Majority rule | 836088 | 835822 | 99.97% |
| Average scoring rule | 296309 | 295854 | 99.85% |
| Amazon | |||
| Majority rule | 2246804 | 2241196 | 99.75% |
| Average scoring rule | 981886 | 971987 | 98.99% |
| Ebay | |||
| Majority rule | 16705440 | 16667935 | 99.78% |
| Average scoring rule | 13008919 | 12990199 | 99.86% |
6.3 Examine minimum number of ratings
We consider the same set of items and we use the same settings specified in the previous sub-section. Again, denotes the required minimum number of ratings a product (hotel) needs. The statistics of across items are shown in Table 11, where denotes the fraction of items with , and we use MR and ASR to denote majority rule and average score rule respectively for brevity. From Table 11, we have the following observations. For the average scoring rule, nearly all items need more than 800 ratings. In fact 99.45% hotels (TripAdvisor), 99.08% products (Amazon), and 99.97% sellers (Ebay) need more than 800 rating. And a large fraction of them need more than 1200 ratings, say 47.55% hotels (TripAdvisor), 61.56% products (Amazon) and 98.34% sellers (Ebay). But for the majority rule, more than half the hotels only need less than 800 ratings, say 58.79% hotels, 88.22% products, 82.8% sellers need less than 800 ratings. What’s more, a large fraction of them need less than 400 ratings, i.e., around 39.74% hotels, 80.51% products and 58.06% sellers. In other words, the minimum number of ratings trend to be of smaller values for the majority rule.
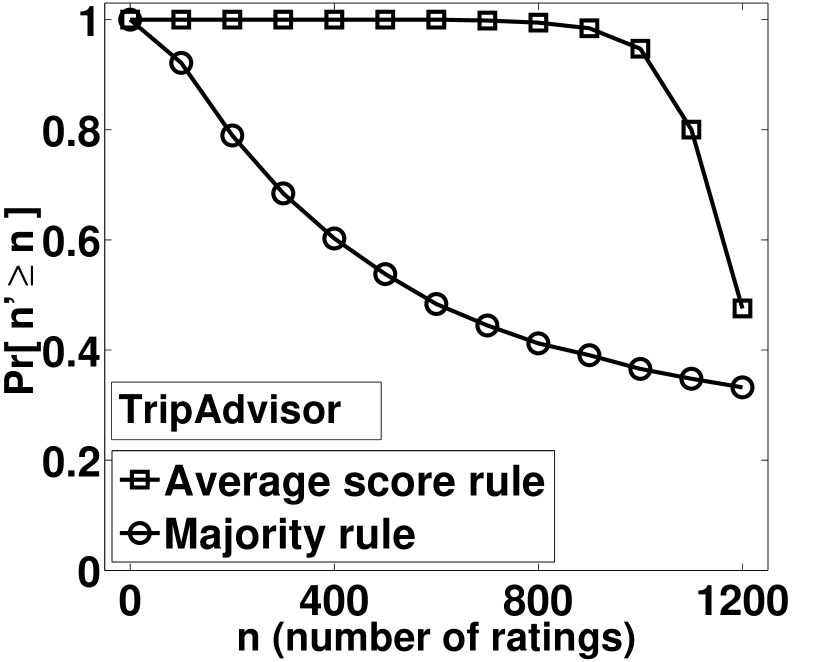
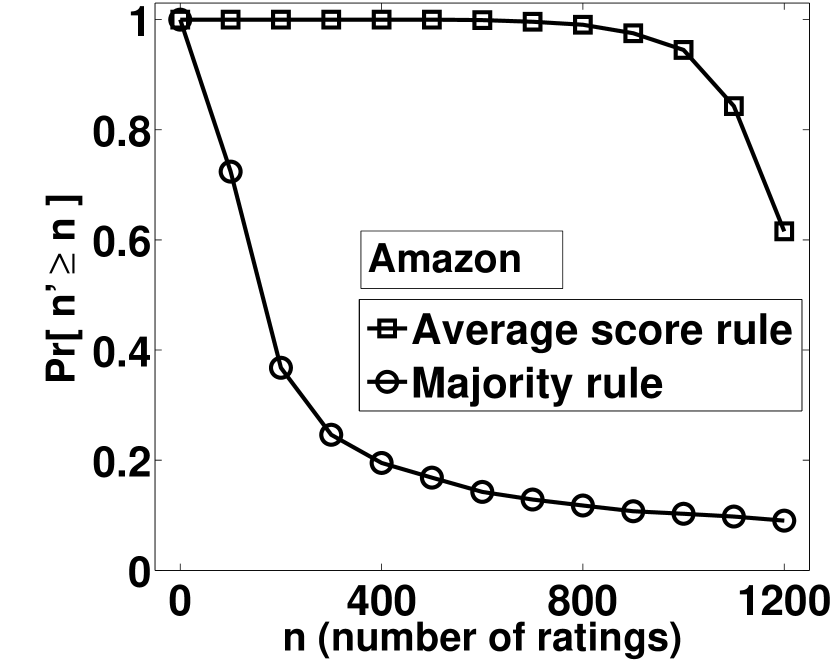
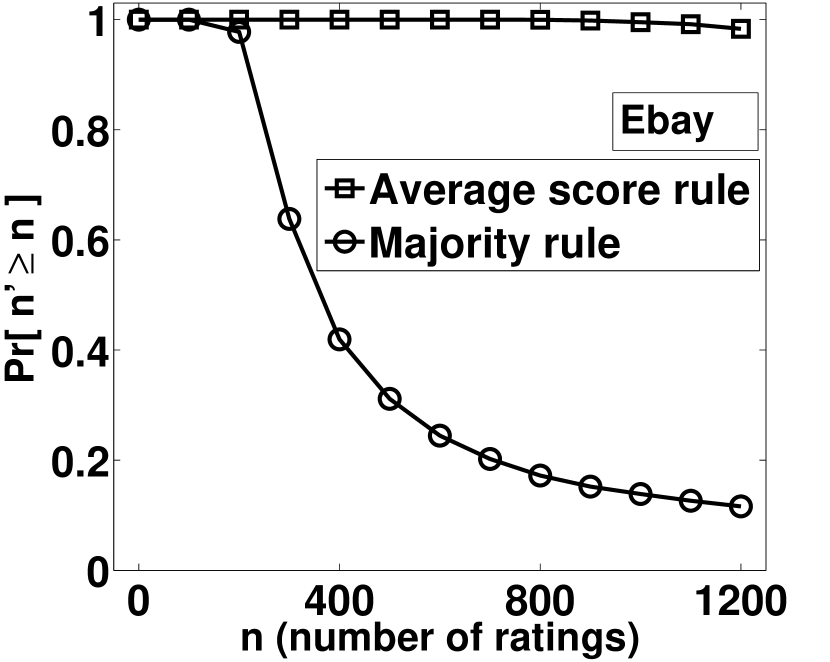
Evaluating rating aggregation rules. We compare robustness of majority rule and average score rule by examining the distribution of minimum number of ratings corresponding to them. We use notation to denote the fraction of items with minimum number of ratings larger or equal to . Fig. 6, 6 and 8 show the numerical results of corresponding to TripAdvisor, Amazon and Ebay dataset respectively, where the horizontal axis shows the number of ratings , and the vertical axis shows the corresponding value of . From Fig. 6 we could observe that the distribution curve corresponding to majority rule lies under the curve corresponding to average score rule. In other words, majority rule require less ratings than average score rule. This also holds for Fig. 6 and 8. These results show that majority rule is more robust than average score rule.
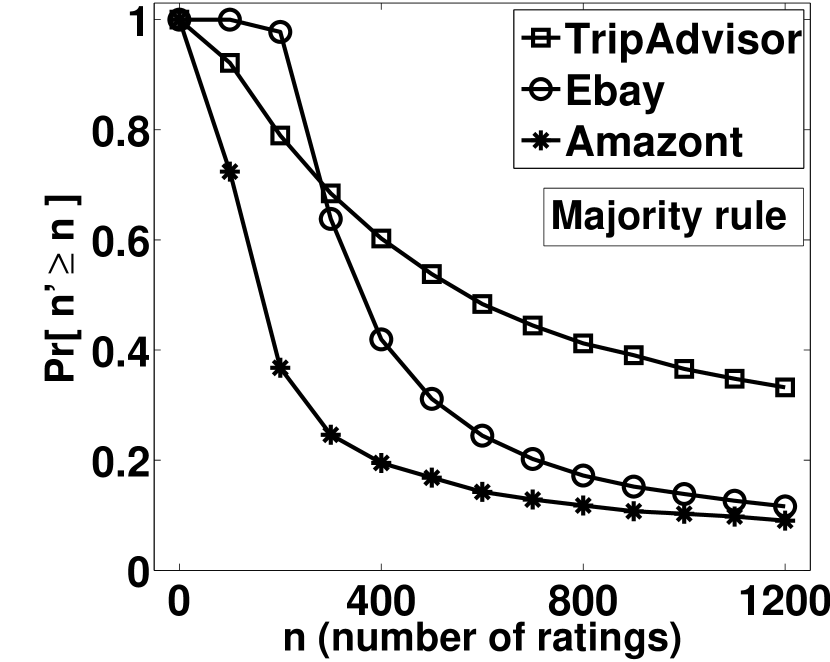
Case studies. We examine the following question: among TripAdivsor, Amazon and Ebay, whose ratings are more reliable ? We answer this question by comparing the distribution of minimum number of ratings across items for them. Here we fix the rating aggregation rule to be majority rule, since it is more robust than average score rule. Again, we use notation to denote the fraction of items with the minimum number of ratings larger or equal to . The numerical results of are shown in Fig. 8, where the horizontal axis shows the number of ratings , and the vertical axis shows the corresponding value of . From Fig. 8 one can observe that, as the web sites varies from Amazon, Ebay, and TripAdvisor, the corresponding distribution curve move up. In other words, the minimum number of ratings corresponding to Amazon is the least and that corresponding to TripAdvisor is the highest. This shows that Amazon requires less ratings than TripAdvisor and Ebay, and TripAdvisor requires more ratings than Amazon and Ebay. Thus, the ratings on Amazon is more reliable than TripAdvisor and Ebay.
Here, we study the fraction of items (products, hotels, sellers) which have sufficient number of ratings. Assume our data sets stated in Table 8 are representative samples from TripAdvisor, Amazon ane Ebay. Based on this assumption we explore, the fraction of items which have sufficient number of ratings. We set the desired minimum number of ratings a product/hotel/seller needs as the median of the value of minimum number of ratings obtained in the beginning of this section. Then we test the fraction of products in the data sets stated in Table 8 satisfy the minimum number of ratings. Let denote the fraction of hotels/products/sellers that satisfy the requirement on minimum number of ratings. The numerical results are shown in Table 12, where denote the number of hotels/products/sellers that meet the requirement. From Table 12, we have the following observations: Only 12.8% hotels on TripAdvisor, 21.6% products on Amazon, 74.1% sellers on Ebay, are with sufficient number of ratings. Ratings on Ebay is more sufficient than TripAdvisor and Amazon.
| TripAdvisor | ||||
|---|---|---|---|---|
| MR | 39.74% | 19.05% | 7.98% | 33.23% |
| ASR | 0% | 0.55% | 51.9% | 47.55% |
| Amazon | ||||
| MR | 80.51% | 7.71% | 2.75% | 9.02% |
| ASR | 0% | 0.92% | 37.52% | 61.56% |
| Ebay | ||||
| MR | 58.06% | 24.74% | 5.59% | 11.61% |
| ASR | 0% | 0.03% | 1.63% | 98.34% |
| # of items | ||||
|---|---|---|---|---|
| TripAdvisor | 573 | 11540 | 1481 | 12.8% |
| Amazon | 146 | 32888 | 7119 | 21.6% |
| Ebay | 356 | 4586 | 3397 | 74.1% |
Lessons learned & tips. Assume we use the majority rule to aggregate ratings, we need at least hundreds of ratings for a hotel (TripAdvisor) / product (Amazon) / seller (Ebay), so as to produce a reliable evaluation on the quality of a hotel/product or reputation of a seller. If the number of ratings of a hotel/product/seller is lower than 100, then we may be in danger of produce unreliable evaluations. If we use the average scoring rule to aggregate ratings, the system needs more ratings (around one thousand of ratings for each hotel/product/seller) than using the majority rule. The majority rule is more robust and reliable than the average scoring rule. The rating on Amazon is more reliable than TripAdvisor and Ebay, since to produce a reliable evaluation, Amazon needs less rating than TripAdvisor and Ebay. Ratings on Ebay are more sufficient than TripAdvisor and Amazon.
6.4 Inferring minimum number of ratings
In real world applications, it may be expensive or sometimes even impossible to obtain the exact desired minimum number of ratings for a product. Here we tackle this challenge by designing an efficient algorithm to infer the desired minimum number of ratings, stated in Algorithm 3. We show the effectiveness of Algorithm 3 by performing empirical experiments on TripAdvisor, Amazon and Ebay dataset.
Inferring minimum number of ratings algorithm design. In real world web services, ratings are with time stamps. For a given time stamp, we infer the desired minimum number of ratings for a product based on the historical ratings (up to the given time stamp) of that product. To infer the desired minimum of ratings, we first infer the model parameter by applying Algorithm 1 on the the historical ratings. Then based on the inferred model parameter, we compute the desired minimum number of ratings. We outline our algorithm for inferring minimum number of ratings in Algorithm 3, where denote a set of historical ratings (up to time stamp ) of hotel , and is the earliest rating. We use to denote the inferred minimum number of ratings.
Empirical evaluations. We illustrate the effectiveness of Algorithm 3 by showing that if a product meets the inferred minimum number of ratings, then the evaluations of its quality is indeed reliable. We work on the same dataset and use the same notations, say with Section 6.2. The datasets are with time stamps. For each time stamp, we first infer the minimum number of ratings of that product by performing Algorithm 3 on its historical ratings (up to that time stamp). And then we check whether the number of ratings is larger than the inferred minimum number of ratings. If yes, then the number of test time stamps will be increased by one, and at the meantime, we further evaluate the quality of that product based on its ratings up to that time stamp, if the evaluated quality reflects the true quality (obtained by step 3 of Algorithm 2), then the number of reliable evaluations is increased by one. We consider majority rule here. We perform experiments on TripAdvisor, Amazon and Ebay datasets. The experiment results of and are shown Table 13, where . From Table 13 we could observe that if a products meets the requirement on the inferred minimum number of ratings, then the evaluation of its quality is reliable because the value of is 97.27% for TripAdvisor, 98.50% for Amazon, 99.56% for Ebay. This shows the effectiveness of our algorithm for inferring minimum number of ratings.
Lessons learned. Our algorithm of inferring the minimum number of ratings is effective in producing reliable evaluations of product quality. Our algorithm can be deployed into real world applications of web services.
| TripAdvisor | 907810 | 883030 | 97.27% |
| Amazon | 2262036 | 2228173 | 98.50% |
| Ebay | 16516962 | 16444179 | 99.56% |
7 Related Work
Several works have investigated the problem of rating aggregation in online rating systems. For example, in [19, 4], authors proposed reputation based weighted average score rules that compute the average rating of products weighted on the reputation score of users. Other representative works on rating aggregation can be found in [13, 9, 10, 20]. However, in real online rating system based web services, average scoring rule and majority rule are two most widely deployed rating aggregation rules, because they are simple, easy to deploy and more importantly, tested to perform well for many web services.
Several works have investigated fraud detection. For example, authors in [11] explored review spam detection in online reviewing systems. In [5, 21] authors studied fraud detection in trading communities. Also, fraud detection in recommendation systems was investigated in [12, 16]. In our paper, we provide a probabilistic model and formal analysis of users misbehavior in online ratings systems, and show the condition in which online rating systems may not be able to reflect the true quality of products.
Online rating systems are widely deployed in recommendation systems [18, 2]. Recommendation systems were introduced since the seminal work on collaborative filtering [8, 17]. In general, recommendation systems interpret ratings as preferences of users, and try to make personalized recommendations by taking into account the preferences of users. Researchers investigate various algorithmic and complexity issues in designing recommendation systems [7, 18, 2]. The important distinction of our work is that we treat rating as product quality assessment and we consider the condition where we can reveal the true quality with high probability.
8 Conclusion
We present a mathematical framework to analyze online rating systems that are widely deployed in web services such as TripAdvisor, Amazon, eBay, etc. We first present a novel mathematical model to specify users’ rating behavior. We then formally analyze a general model of online rating systems. Through this analysis, we derived theoretical bounds on the desired minimum of the ratings we need to produce a reliable evaluation on the quality of products. We extend our model to accommodate users’ misbehavior (i.e., cheating) in product rating, and show that the majority rule is more robust and insensitive to misbehavior as compared with the average scoring rule. Based on our framework, we also propose an practical algorithm to infer the minimum number of ratings, which is effective in produce reliable product quality evaluations in real-world. We perform experiments on both synthetic data and three large real-world data sets (from TripAdvisor, Amazon, Ebay). Number of interesting observations were found, e.g., generally, hundreds of ratings are sufficient to reflect the true quality of a hotel / product on Amazon / Ebay, or the true reputation of a seller on Ebay. Ratings on Ebay are more sufficient than TripAdvisor and Amazon. We believe that our models and methodology can be used as important building blocks to refine and improve online rating systems for various web services.
References
- [1] Easily rigged travel review sites labeled untrustworthy. http://www.tecca.com/columns/travel-review-site-scams-travel-tech/, 2012.
- [2] G. Adomavicius and A. Tuzhilin. Toward the next generation of recommender systems: A survey of the state-of-the-art and possible extensions. IEEE TKDE, 17(6):734–749, 2005.
- [3] C. Bishop. Pattern recognition and machine learning. springer New York, 2006.
- [4] M. Chen and J. Singh. Computing and using reputations for internet ratings. In Proc. of ACM EC, 2001.
- [5] C. Dellarocas. Immunizing online reputation reporting systems against unfair ratings and discriminatory behavior. In Proc. of ACM EC, 2000.
- [6] W. Feller. Generalization of a probability limit theorem of cramer. Trans. Amer. Math. Soc, 54(3):361–372, 1943.
- [7] J. Herlocker, J. Konstan, L. Terveen, and J. Riedl. Evaluating collaborative filtering recommender systems. ACM TOIS, 22(1):5–53, 2004.
- [8] W. Hill, L. Stead, M. Rosenstein, and G. Furnas. Recommending and evaluating choices in a virtual community of use. In Proc. of ACM CHI, 1995.
- [9] R. Jin and L. Si. A study of methods for normalizing user ratings in collaborative filtering. In Proc. of ACM SIGIR, 2004.
- [10] R. Jin, L. Si, C. Zhai, and J. Callan. Collaborative filtering with decoupled models for preferences and ratings. In Proc. of ACM CIKM, 2003.
- [11] N. Jindal and B. Liu. Analyzing and detecting review spam. In Proc. of IEEE ICDM, 2007.
- [12] S. Lam and J. Riedl. Shilling recommender systems for fun and profit. In Proc. of WWW, 2004.
- [13] H. W. Lauw, E.-P. Lim, and K. Wang. Quality and leniency in online collaborative rating systems. ACM Trans. Web, 6(1):4:1–4:27, 2012.
- [14] J. Matous̆ek and J. Vondrák. The probabilistic method.
- [15] M. Mitzenmacher and E. Upfal. Probability and computing: Randomized algorithms and probabilistic analysis. Cambridge Univiversity Press, 2005.
- [16] B. Mobasher, R. Burke, and J. Sandvig. Model-based collaborative filtering as a defense against profile injection attacks. In Proceedings of the National Conference on Artificial Intelligence, 2006.
- [17] P. Resnick, N. Iacovou, M. Suchak, P. Bergstrom, and J. Riedl. Grouplens: an open architecture for collaborative filtering of netnews. In Proceedings of the ACM conference on Computer supported cooperative work, 1994.
- [18] P. Resnick and H. Varian. Recommender systems. Communications of the ACM, 40(3):56–58, 1997.
- [19] T. Riggs and R. Wilensky. An algorithm for automated rating of reviewers. In Proceedings of the 1st ACM/IEEE-CS joint conference on Digital libraries, pages 381–387. ACM, 2001.
- [20] J. Traupman and R. Wilensky. Collaborative quality filtering: Establishing consensus or recovering ground truth? Advances in Web Mining and Web Usage Analysis, pages 73–86, 2006.
- [21] J. Zhang and R. Cohen. Trusting advice from other buyers in e-marketplaces: the problem of unfair ratings. In Proc. of ACM EC, 2006.
Appendix
Proof of Lemma 1
Let denote the rating distribution of the user who assigns score . Recall that the probability distribution of is , and , where . Then we have:
so this proof is completed.
Proof of Theorem 1
Let us state a theorem on bounding the tail probability, that will be used in later derivation.
Theorem 9 (Chernoff Bound [15])
Let be independent random variables, with with probability and 0 otherwise. Let and let . Then for each , we have
Now we can prove Theorem 1 by applying Theorem 9 as follows. Let denote the number of ratings that equal to . By basic probability arguments, we can derive the probability of failing to extract the true label as follows:
| (5) |
Let us now proceed to individually derive these two terms of the above inequality.
One can apply the Chernoff Bound to bound the first term of Inequality (5). Observe that . Based on this observation, we can write down the first term of Inequality (5) as follows:
by applying Chernoff Bound we have
by substituting with Inequality (3), we have
| (6) |
The remaining issue is to derive the last term of Inequality (5). Since . Based on this observation, we can write down the last term of Inequality (5) as follows:
| (7) |
where the last step is obtained by applying Chernoff Bound. Since , thus we have
applying this inequality to Inequality (7), we obtain
| (8) |
We can further simplify this inequality under the following two cases.
Case 1: . In this case,
. Therefore
. Applying this to Inequality
(8) and substituting with
Inequality (3), we have
| (9) |
Case 2: . In this case, . We have . Applying this equation to Inequality (8) and substituting with Inequality (3), we have
| (10) |
Combining Inequality (9) and Inequality (10), we have
| (11) |
Applying Inequality (6) and
Inequality (11) to Inequality
(5), we complete the proof.
Proof of Theorem 2
Let us state a theorem on bounding the tail probability, that will be used in later derivation.
Theorem 10 ([14, 6])
Let be a sum of independent random variables, each attaining values in , and let . Then for all , we have
for a suitable constant .
Now we can prove Theorem 2 by applying Theorem 10 as follows. Recall that is the number of ratings that equal . Let . We can derive a general lower bound of the probability that we fail to extract the true label as follows:
Let , denote a set of random variables with
where the probability mass function of is derived in Lemma 1. Observe that if and only if the number of ratings equal is smaller than the number of ratings equal , or . Thus we have . In the following, we seek to complete the proof by showing .
Here we apply Theorem 10 to give a lower bound of . First we can express the expectation and variance of as:
Let , where . Observe that , thus . Before applying Theorem 10 to derive a lower bound of , we need to check whether some conditions specified in Theorem 10 are satisfied.
Let us first check whether holds. Since
| (12) |
Based this observation, we can derive a lower bound of as follow:
| (13) |
By applying Inequality (13), the lower bound of is
By making the left side of this inequality larger or equal to 40000, we guarantee that , or . Hence, by letting , then for any , we have .
Let us continue to check whether . By apply Inequality (12), we could derive an upper bound of as follows:
Thus we have that .
Proof of Theorem 3
We prove this theorem by extending Theorem 1. First let us present a probabilistic interpretation of the random misbehaving users as follows: with probability we generate a misbehaving user to rate product , and with probability we generate an honest user to rate product . This interpretation describes a new generative process for ratings with random misbehaving users. Let be a rating generated by that new generative process. Observe that and , where . Then we can compute the probability mass function of as follows:
It follows that and are the
largest and second largest among respectively. Then, by a similar derivation with
Theorem 1, we finish this proof.
Proof of Theorem 4
We prove this theorem by extending Theorem 1. First let us present a probabilistic interpretation of the bias misbehaving users as follows: with probability we generate a biased misbehaving user to rate product , and with probability we generate a honest user to rate product . This interpretation describes a new generative process for ratings with biased misbehaving users. Let be a rating generated by that new generative process. Observe that with and 0 otherwise, and . Then we have:
We have two cases to consider:
Case 1: . Observe that
Thus and are the largest and second largest among respectively. Therefore, with a large enough value of , the number of ratings that equal to will be the largest with high probability. Then by a similar derivation with Theorem 1, we could finish the proof for this case.
Case 2: . Observe that and
are the largest and second largest
among respectively.
Thus we extract the label with a high probability with
large enough value of . Finally, by a similar derivation with
Theorem 1, one completes the proof.
8.1 Proof of Theorem 6
Let . Observe that . Recall that we use , , to denote the number of ratings that equal to . Let , , denote the number of ratings which are no less than . Then we have
Then it follows that our problem can be formulated to bound
In the following, we will first seek to bound , and then we apply this bound to complete our proof.
We bound by the following claim:
- •
Let us prove this claim here. Let , , be a set of indicator random variables such that
From Lemma 1 we have that , where and . Thus . Therefore, we could have . It follows that . Observe that . Let us consider a special case, first. For this special case, by a simple check, we could see that claim 1 holds. Then we consider the case, . Observe that for this case the inequality holds. Based on this observation, we can further show:
where the last two steps are obtained by applying Chernoff Bound and by substituting with Inequality (4) respectively. Finally, we consider the case, . Observe that for this case the inequality holds. Then by a derivation as the previous case, we obtain
holds. Hence we proved Claim 1.
Let denote the event that Inequality (14) holds for a specific value . Then based on claim 1, we have . Then we can derive the probability that events all holds as follows:
Suppose that events all holds then,
by applying Cauthy’s Inequality we have:
The proof can be completed by recalling that the probability that events all holds is at least .
8.2 Proof of Theorem 7
When there is fraction of random misbehaving users, the average rating of product converges to . Since holds, then with a similar derivation of Theorem 6, we could obtain that:
| (15) |
holds with probability at least . Observe that
by applying Inequality (15) to this inequality we
can finish the proof of this theorem.