Ultra-Compact Dwarfs around NGC 3258 in the Antlia cluster ††thanks: Based on observations collected at the Cerro Tololo Interamerican Observatory (CTIO); observations obtained at the Gemini Observatory, which is operated by the Association of Universities for Research in Astronomy, Inc., under a cooperative agreement with the NSF on behalf of the Gemini partnership: the National Science Foundation (United States), the Science and Technology Facilities Council (United Kingdom), the National Research Council (Canada), CONICYT (Chile), the Australian Research Council (Australia), Ministério da Ciencia e Tecnologia (Brazil) and Ministerio de Ciencia, Tecnología e Innovación Productiva (Argentina); and observations carried out at the European Southern Observatory, Paranal (Chile), programme 71.B-0122(A).
Abstract
We present the first compact stellar systems with luminosities in the range of ultra-compact dwarfs (UCDs), discovered in the Antlia galaxy cluster (). The magnitude limit between UCDs and globular clusters (CGs) is discussed. By means of imaging from VLT (FORS1), CTIO (MOSAIC), and the HST (ACS) archive, eleven UCDs/bright GCs are selected on the basis of photometry and confirmed as Antlia members through radial velocities measured on new GEMINI (GMOS-S) spectra. In addition, nine UCD candidates are identified taking into account properties derived from their surface brightness profiles. All of them, members and candidates, are located in the proximity of NGC 3258, one of the two brightest elliptical galaxies in the cluster core. Antlia UCDs in this sample present absolute magnitudes fainter than and most of them have colours within the blue GC range, falling only two within the red GC range. Effective radii measured for the ones lying on the ACS field are in the range pc and are similar to equivalent objects in other clusters, obtained from the literature. The UCD sample shares the same behaviour on the size-luminosity plane: a linear relation between and is present for UCDs brighter than – while no trend is detected for fainter ones, that have an approximately constant . The projected spatial distribution of UCDs, GCs and X-ray emission points to an ongoing merger between two Antlia groups, dominated by NGC 3258 and NGC 3268. Nuclei of dwarf elliptical galaxies and blue UCDs share the same locus on the colour-magnitude diagram, supporting the hypothesis that some blue UCDs may be remnants of stripped nucleated dwarfs.
keywords:
galaxies: star clusters – galaxies: photometry – galaxies: nuclei1 Introduction
Ultra-Compact Dwarfs (UCDs) is the name that has been assigned (first by Drinkwater et al. 2000) to an apparently new class of compact objects with masses and luminosities ranging between globular clusters (GCs) and dwarf galaxies. Their origin and nature are not yet completely understood. Most authors assume that they in fact may have various formation channels (e.g. Hilker 2009; Norris & Kannappan 2011; Chilingarian et al. 2011). The first UCDs were discovered in the proximity of NGC 1399, the dominant galaxy of the Fornax cluster (Minniti et al. 1998; Hilker et al. 1999). Afterwards, UCDs have also been found in other galaxy clusters/groups (Mieske et al. 2007; Evstigneeva et al. 2008; Gregg et al. 2009; Madrid et al. 2010; Misgeld et al. 2011; Rejkuba et al. 2007; Hau et al. 2009; Da Rocha et al. 2011; Madrid 2011). Although there is no generally accepted definition of UCD luminosities, Hilker (2009) suggests a absolute magnitude range of .
The defining criterion of what is a UCD varies for different authors. Metallicity, radius, luminosity or mass-to-light ratio () tresholds have been proposed, according to the behaviour of these properties in compact objects (e.g. Mieske et al. 2006, 2008; Norris & Kannappan 2011). The presence of multiple stellar populations, as found in Cent (e.g. Anderson et al. 2009) is other possibility. Brodie et al. (2011) employ the effective radius () as the property which separates UCDs from GCs. Setting a limit of =10 pc, they include objects as faint as . Mieske et al. (2008) and Dabringhausen et al. (2008) suggested as a limiting mass.
Although some objects were found in merger remnants of intermediate age like W3 in NGC 7252 (Maraston et al. 2004), most UCDs present an old stellar population (t Gyr, Mieske et al. 2006; Evstigneeva et al. 2007) and colours within a similar range as GCs. Their can reach up to pc, and their brightness profiles present nuclear and halo components. However, UCDs usually present pc (Mieske et al. 2007, 2008; Evstigneeva et al. 2008; Chiboucas et al. 2011). Dynamical masses range between M (Mieske et al. 2008; Chilingarian et al. 2011). Some studies find that mass-to-light ratios () can assume values twice as high as those of Galactic GCs of similar metallicity (Evstigneeva et al. 2007; Mieske et al. 2008; Taylor et al. 2010). There is not a general agreement about the presence of dark matter haloes in these objects (e.g. Chilingarian et al. 2011). Frank et al. (2011) analysed the internal kinematics of UCD3 in Fornax with spatially resolved spectroscopy, and they did not find evidence for a dark matter component in this object.
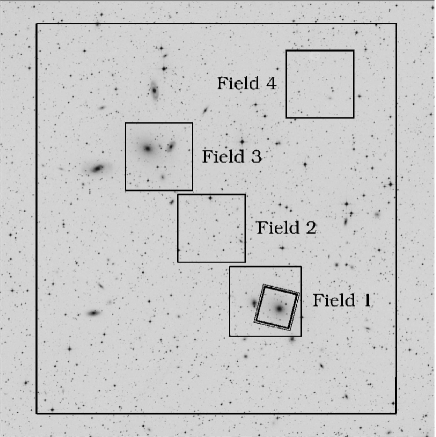
. The framed box indicates the ACS field. At the adopted Antlia distance, corresponds to . North is up, East to the left.
1.1 Possible formation scenarios for UCDs
1.2 The Antlia cluster
This work is part of the Antlia Cluster Project, that is devoted to study the different stellar systems of this cluster, from GCs (Dirsch et al. 2003b; Bassino et al. 2008) to the galaxy population (Smith Castelli et al. 2008a, b, 2012).
The Antlia galaxy cluster, located in the Southern sky at low Galactic latitude (), is after Virgo and Fornax the nearest populous galaxy cluster. The central part of the cluster consists of two subgroups, each one dominated by a giant elliptical galaxy (NGC 3258 and NGC 3268) of comparable luminosity. Galaxies located in both subgroups present an elongated projected distribution, in the direction that joins the two giant ones.
Hawley et al. (2011) recently presented a study of the inner 12 arcmin of the Antlia cluster, using XMM–Newton. They consider Antlia as ‘the nearest example of a galaxy cluster in an intermediate merger stage without a cool core’. While the early- to late-type galaxy ratio indicates an evolved system, the existence of two subgroups, which may also be present in the overall mass distribution, means that the total system has not yet completed its evolution. We might be witnessing the merging of two, rather evolved, compact groups/clusters.
Due to the influence that environmental conditions may have on the origin and dynamical evolution of the UCDs, the Antlia cluster is a very interesting system to study. Moreover, increasing the sample of analysed UCDs will help to understand their nature.
We present here the first results of the search for UCDs in the Antlia cluster, focusing on the surroundings of NGC 3258. In this investigation, first, we analyse a preliminary sample that also includes the ‘supposedly’ brightest GCs and will generally refer to both, bright GCs and UCDs, as ‘compact objects’. Then, we perform a more refined selection (see Sect. 4) of a specific ‘UCD sample’ (Antlia members and candidates) and use it for the second part of this research. Preliminary results on the search for UCD candidates in Antlia have been given by Caso et al. (2009, 2010).
This paper is structured as follows. Section 2 describes the observations, reductions, and adopted criteria for the compact objects selection. In Section 3 we present and discuss the results regarding their colour-magnitude relation (CMR), size, size-luminosity relation, and we also compare magnitudes and colours of the compact objects with those obtained for a sample of Antlia dE,N nuclei. The final selection of UCD members and candidates is performed in Section 4, that deals with their projected spatial distribution, colours, metallicities, as well as the Antlia global colour-magnitude diagram (CMD). Finally, a summary and the conclusions are provided in Section 5.
2 Observations and reductions
In this Section we describe the photometric and spectroscopic data, how the surface brightness profiles of Antlia dE galaxies have been obtained, and the identification and selection of the compact objects, i.e. UCDs and bright GCs.
2.1 Observational data

The photometric observations used in this paper are obtained from three different sources. Part of the material consists of FORS1–VLT images in the and bands (programme 71.B-0122(A), PI B. Dirsch). These images correspond to four fields, two of them are centred on each one of the dominant galaxies, NGC 3258 (Field 1) and NGC 3268 (Field 3), the third one is located in the region between them (Field 2), and the last one is located to the north-west direction (Field 4, see Fig. 1).
We also use wide–field images that were taken with the MOSAIC camera mounted at the CTIO 4-m Blanco telescope (indicated by the outer box in Fig. 1) during 4/5 April 2002. The Kron–Cousins and Washington filters were used, although the genuine Washington system uses instead of . However, Geisler (1996) showed that the Kron–Cousins filter is more efficient than and that there is only a small colour term and zero-point difference between magnitudes in both filters (we use from Dirsch et al. 2003b). These images were originally used to perform the first study of the GCSs of NGC 3258 and NGC 3268 in Antlia (Dirsch et al. 2003b).
In addition, an ACS field on NGC 3258 (indicated by the framed box in Fig. 1) observed with the filter was obtained from the Hubble Space Telescope Data Archive. This image is the composite of four 570 s exposures and corresponds to the programme 9427 (PI: W. E. Harris).
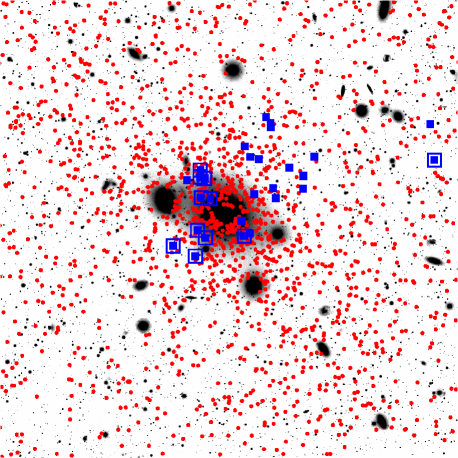
We have also obtained GEMINI–GMOS multi-object spectra for compact objects located in five Antlia fields (programmes GS-2008A-Q-56, PI T. Richtler; GS-2009A-Q-25, PI L. P. Bassino). The masks designed for these programmes were devoted to the study of the general population of the cluster, not only the compact objects. In all cases, the B600_G5303 grating blazed at was used, with three different central wavelengths (5000, 5050, and ) in order to fill in the CCD gaps. A slit width of 1 arcsec was selected. Considering an average seeing of 0.5 – 0.6 arcsec, this configuration gives a wavelength coverage of depending on the positions of the slits, and a spectral resolution of . The total exposure times ranged between 2 and 3.3 h. Individual calibration flats and CuAr arc spectra were obtained for each exposure during the programme time, in order to avoid small variations that could be introduced by flexion of the telescope. Figure 2 shows the projected spatial distribution of GC candidates with around NGC 3258 (circles), and the spectroscopically observed sources (squares).
2.2 Photometry and source selection
In order to work in an homogeneous way and not to lose any UCD candidate that might has been discarded in the past as too bright for being a GC, we redo the basic photometry for the FORS1 and MOSAIC data.
The FORS1 photometry was performed with DAOPHOT within IRAF, using a spatially variable point-spread function (PSF). The point source selection was based on the and sharpness parameters from the ALLSTAR task. We refer to Bassino et al. (2008) for more details on the observations and the calibration equations applied to obtain colours and magnitudes in the standard system.
The MOSAIC photometry was also performed with DAOPHOT. The extended galaxy light was subtracted, using a median ring filter with an inner radius of 9 arcsec and an outer radius of 11 arcsec. This facilitates point source detection, without modifying the results of the subsequent photometry (Dirsch et al. 2003a, b; Bassino et al. 2006a, b). The software SExtractor (Bertin & Arnouts 1996) was applied to the sky-subtracted image to obtain an initial selection of point sources. The software was set so as to consider a positive detection every group of, at least, five connected pixels above a threshold of (DETECT_MINAREA and DETECT_TRESH parameters, respectively). At the Antlia distance, that we adopt as approximately Mpc (distance modulus , Dirsch et al. 2003b), even the larger UCDs are seen as point sources on our MOSAIC images. Thus, to select point sources we use the star/galaxy classifier from SExtractor, through the CLASSSTAR parameter, that takes values close to one for point sources and close to zero for extended sources (see the right-hand panel in Fig. 4). All the objects with CLASSSTAR are rejected. The aperture photometry was performed using the task PHOT. Afterwards, a spatially variable PSF was built, employing about a hundred bright stars, well distributed over the whole field. The final point source selection was based on the and sharpness parameters from the ALLSTAR task, and the aperture corrections and calibration equations were obtained from Dirsch et al. (2003b).
In the reduction of the ACS data, the surface brightness profile of the galaxy was obtained with the task ELLIPSE and the corresponding synthetic galaxy generated with BMODEL (both IRAF tasks) was subtracted from the original image. A first source selection was made with SExtractor, considering a positive identification every detection of at least three connected pixels above a threshold of . In this case, as UCDs may be marginally resolved on ACS images at the Antlia distance, we decided to reject all objects with CLASSSTAR (see the left-hand panel in Fig. 4). Again, aperture photometry was performed using the task PHOT, and the PSF was built with the DAOPHOT/IRAF homonymous task, selecting bright stars well distributed on the field. In the following, we will keep just the instrumental magnitudes. A list of UCD and bright GC candidates was then compiled with the objects that satisfy the source selection criteria in the three photometric data sets (from FORS1, MOSAIC, and ACS images), and have magnitudes in the range . At the adopted Antlia distance, it corresponds to an apparent magnitude range . Considering the mean colour for early-type galaxies given by Fukugita et al. (1995) also valid for UCDs, the previous magnitude range corresponds to in the Washington photometric system. This list should be considered as a preliminary selection, namely the compact objects, as we will refine it later when sizes are also taken into account to separate the UCDs.
2.3 Surface brightness profiles of dwarf elliptical galaxies
On the basis of the hypothesis that links bright compact objects (i.e. UCDs) with the nuclei of dE,N galaxies, it was tried to isolate the nuclei of dE,N in order to compare their photometric properties with those of UCDs. A list of Antlia dEs was compiled considering the members confirmed by radial velocities (Smith Castelli et al. 2008a, 2012) as well as galaxies labelled as ‘definite members’ by Ferguson & Sandage (1990) (type-1, in their classification). Even though Ferguson & Sandage (1990) only used photometric galaxy properties as membership criteria of the galaxies, subsequent spectroscopic observations indicated that the vast majority of type-1 galaxies are in fact Antlia members (Smith Castelli et al. 2012, and references therein). Ten dwarf galaxies from this member list are located on our FORS1–VLT images, and for nine of them we could obtain luminosity profiles. The remaining one (FS90-109, where FS90 corresponds to the identification given by Ferguson & Sandage 1990) is very close to a saturated star, making it difficult to obtain an acceptable fit.
The following process was applied to get such galaxy profiles. First, the FORS1–VLT images were visually inspected to determine if the extended light of bright galaxies, present in the field, could affect the dwarf photometric measurements. In Field 1 the luminosity profile of NGC 3258 was obtained using the task ELLIPSE within IRAF, after masking all the bright objects in the field. Then, a model galaxy generated with the task BMODEL was subtracted from the original image. This second image, free of the extended light from NGC 3258, was used to fit the luminosity profile of NGC 3260, another bright galaxy present in this field. Once again, a model galaxy was generated with BMODEL and subtracted from the original image. The resultant image was used to obtain the surface brightness profile of NGC 3258, repeating the iterative process three times for each filter. The final models of both bright galaxies were then subtracted from the original image.
A similar process was implemented for Field 3, subtracting the light from galaxies NGC 3267, NGC 3268 and FS90-175. The Fields 2 and 4 do not contain bright galaxies. The correspoding background levels were calculated for each image using its mode. This was done applying a rejection level of three times the dispersion to eliminate outliers, and the mode was re-obtained. This iterative process was repeated 50 times. Also, for each dE the surrounding background was searched for possible gradients. A plane was fitted when necessary, in order to take into account possible variations of the background in the region where dwarfs were located, originated in the subtracted bright galaxies luminosity profiles, or the contribution of bright saturated stars.
For every galaxy, the ELLIPSE task was used to obtain the luminosity profiles in both and filters. These dE profiles are usually characterized by Sérsic models (Sérsic 1968), (e.g. Geha et al. 2002; Buzzoni et al. 2012). Considering surface brightness units (mag arcsec-2), an alternative form for the equation of such models is:
| (1) |
where is the central surface brightness, is a scale parameter and is the Sérsic index. If this is compared with the original form of the Sérsic law,
| (2) |
it follows that Nn, and
| (3) |
| (4) |
For each dwarf galaxy, its calibrated surface brightness profile was fitted by a Sérsic law. The residuals between the observed and fitted profiles were obtained in all cases. For those galaxies where one Sérsic law did not provided an acceptable fit, due to the presence of a nucleus, a two–component fit was performed. In these cases, first a single Sérsic profile was fitted to the outer region of the galaxy, providing a very good fit to the halo component. Then, it was subtracted from the intensity profile of the galaxy, resulting in a profile intrinsically dominated by the nuclear component. Nuclei present half-light radii of only a few parsecs (e.g., Coté et al. 2006), so they appear as point sources on our FORS1 images. For this reason, the total flux of the nucleus was directly obtained from the luminosity profile, once the outer component had been subtracted. Then, the integrated magnitude of the nucleus was calculated from this flux.
From this sample, only for one galaxy a single Sérsic profile could reproduce its surface brightness profiles. The remaining eight had nuclei, and seven were well described by compositions of a Sérsic halo and a point-source-like nucleus. Ferguson & Sandage (1990) classified three of them as dE,N (FS90-87, FS90-162 and FS90-176) and three as dE (FS90-103, FS90-186 and FS90-196). For one, the existence of a nucleus was under debate (FS90-159). FS90-136 was the only one well fitted by a single Sérsic profile, despite that Ferguson & Sandage (1990) classify it as a dE,N. The remaining dwarf is FS90-177. It is described by Ferguson & Sandage (1990) as d:E,N with total B magnitude . In this case a two–component Sérsic profile was needed to fit accurately the surface brightness profile of the galaxy extended component. The process was similar to that followed in the previous cases. Every component was fitted independently to the profile, after subtracting the profiles obtained for the outer ones. The implementation of an additional component must be carefully analysed, in the sense that it could have no physical support and be described just an image defect. However, as can be seen in Fig. 3 where the results of the fits for this galaxy are shown, this additional component was needed to obtain an acceptable fit.


2.4 Spectroscopic data
Data reduction was performed using the GEMINI.GMOS package within IRAF. A master bias was constructed for each observing run using approximately 20 bias images, obtained from the Gemini Science Archive (GSA).
These images are selected as the ones taken as close as possible to the science ones. In order to remove cosmic rays from science images, the FWHM of a Gaussian fit to the lines in the CuAr arc spectra was measured. Then, this value was used as a minimum rejection limit in the GSREDUCE task. The wavelength calibration was obtained with the task GSWAVELENGTH. The list of wavelength calibration lines was constructed from the default list provided by the GMOS package, after removing the lines that in a visual inspection of our CuAr arc images appeared to be faint, extremely close to another line, or with an unusual profile. Then, images were rectified and wavelength-calibrated with GSTRANSFORM task. For all the spectra, individual exposures were combined to achieve a higher S/N. The trace of every object was obtained from the combined images, and then used to extract spectra from the individual exposures. The y-positions in the slit for the individual exposures were the same for each object.
Radial heliocentric velocities for the compact objects in the GMOS fields were measured using the task FXCOR in the NOAO.RV package within IRAF. For this purpose, templates were obtained from the single stellar population (SSP) model spectra at the MILES website (http://www.iac.es/proyecto/miles, Sánchez-Blázquez 1996), considering a SSP with metallicity [M/H]= -0.71, a unimodal initial mass function with a slope of , and ages of 8 and 10 Gyr. The wavelength coverage of the templates is , and the spectral resolution is FWHM. In all cases the 10 Gyr template provided a slightly better correlation.
| ID | RA(J2000) | DEC(J2000) | V0 | (V - I)0 | (T1)0 | (C - T1)0 | RVhel | |||||||||||
|---|---|---|---|---|---|---|---|---|---|---|---|---|---|---|---|---|---|---|
| hh mm ss | dd mm ss | mag | mag | mag | mag | mag | km s-1 | |||||||||||
| ACO 1 | ||||||||||||||||||
| ACO 2 | ||||||||||||||||||
| ACO 3 | ||||||||||||||||||
| ACO 4 | ||||||||||||||||||
| ACO 5 | ||||||||||||||||||
| ACO 6 | ||||||||||||||||||
| ACO 7 | ||||||||||||||||||
| ACO 8 | ||||||||||||||||||
| ACO 9 | ||||||||||||||||||
| ACO 10 | ||||||||||||||||||
| ACO 11 | ||||||||||||||||||
2.5 Selected sample of compact objects
Following our previous studies on the galaxy populations of the Antlia cluster (Smith Castelli et al. 2008a, 2012), objects with radial velocities in the range km s-1 will be considered as Antlia members. As result of our measurements, eleven compact objects are confirmed as cluster members and listed in Table 1. As they have never been catalogued before, we use the acronym ‘ACO’ for Antlia Compact Object, and give their J2000 coordinates, extinction corrected , Washington photometry, and heliocentric radial velocities. Extinction corrections are applied to magnitudes and colours in the rest of this paper, and are described in Bassino et al. (2008) for the data and Dirsch et al. (2003b) for the Washington data. The sample listed in Table 1 includes five compact objects with magnitudes slightly fainter than the adopted luminosity limit (see Section 2.2). We prefer to keep them in the selected sample because they are identified as Antlia members by GMOS radial velocities. There is no available V,I photometry for the object ACO 1, because it is located outside the VLT fields. Framed squares in Fig. 2 indicate the confirmed Antlia members.
The left-hand panel of Fig. 4 shows the CLASSSTAR parameter for the compact objects detected in the ACS field ( from ACO 2 to ACO 9) as a function of the instrumental magnitude estimated by SExtractor. These magnitude estimations are used here just for illustrative purposes and will not be considered in any further analysis. The plot presents the usual structure, with objects with CLASSSTAR close to 1.0 covering the whole magnitude range, and doubtful point sources ( CLASSSTAR ) mostly located in the faint regime. Filled circles represent the Antlia members confirmed by radial velocity measurements (see Table 1). Their CLASSSTAR values are higher than except one compact member with CLASSSTAR 0.75, but in all cases this parameter is larger than the lower limit CLASSSTAR = 0.4 adopted for the selection. This gives us confidence that our selection criteria are not introducing any tendency in the sample.
The middle panel exhibits the FWHM in pixel units as a function of the instrumental magnitude, both estimated by SExtractor, for the compact objects in the ACS field. Symbols are as in the left-hand panel. Filled circles represent Antlia members, and asterisks represent foreground stars confirmed with radial velocities. Confirmed compact objects present FWHM higher than the foreground stars and the rest of bright point sources. These figures show that both, SExtractor’s FWHM and CLASSSTAR parameters, can be used as auxiliary tools for selecting UCD/GC candidates (Chiboucas et al. 2011; Misgeld et al. 2011).
3 Results
The eleven compact objects presented so far in this paper (UCDs and bright GCs, Table 1) have a weighted mean radial velocity and standard deviation of and , respectively. Smith Castelli et al. (2008a) measured for NGC 3258 a radial velocity of , while NED111This research has made use of the NASA/IPAC Extragalactic Database (NED) which is operated by the Jet Propulsion Laboratory, California Institute of Technology, under contract with the National Aeronautics and Space Administration. gives . If we take into account the more recent measurement of NGC 3258 velocity, the difference with the compact objects mean velocity is within the dispersion range. This points to a physical association of these compact objects with the host galaxy.
As it has been suggested that UCDs may have quite different origins, and that the environment is certainly playing an important role (e.g. Hilker 2009; Norris & Kannappan 2011), we will compare the characteristics of the Antlia UCDs/bright GCs and dE,N nuclei with those belonging to other galaxy clusters. That is, as literally said by Hilker (2011): ‘A promising way to learn more about the nature of UCDs is to study their global properties in galaxy clusters and compare them to those of other dwarf galaxies and rich globular cluster systems around central cluster galaxies’.

3.1 Colour-magnitude diagram of compact objects
The CMD of the compact objects in the neighbourhood of NGC 3258, confirmed as members of the Antlia cluster and with available photometry, is shown in Fig. 5. Only one object lacks photometric data (ACO 1, see Table 1) as it is located outside the VLT fields. We have also plotted compact objects found in nearby galaxy clusters (Virgo UCDs from Evstigneeva et al. 2007, Fornax UCDs/GCs from Mieske et al. 2004) as well as Centauri (Harris 1996, 2010 Edition), the only Galactic GC that presents an absolute magnitude similar to these extragalactic compact objects. More recently published data from Fornax and Virgo compact objects, have not been included as they use different photometric systems. We prefer to avoid photometric transformations that introduce more uncertaintes. articles, have been published about Fornax and Virgo compact objects, but they used different photometric systems, and we prefer to avoid the application of photometric transformations, who introduce more uncertainties.
None of the Antlia compact objects confirmed in this paper presents a luminosity as high as those of the brightest Virgo or Fornax UCDs. It is difficult to find a clear CMR due to the large dispersion, but a mild trend is present in the sense that brighter objects seem to be redder. We will come back later to the CMR once the Antlia dE,N nuclei have been added.
All Antlia compact objects shown in Fig. 5 are bluer than , while the Fornax sample reaches significantly redder colours. If we accept that compact objects brighter than are mostly UCDs, their mean colour is in Antlia, and in Fornax. In order to compare with colours of regular GCs (not just the brightest ones), we recall that for old GCs, the limit between metal-poor (‘blue’) and metal-rich (‘red’) ones is taken at by Bassino et al. (2008), using the same VLT data set. Thus, only two out of the ten Antlia compact objects in the CMD are redder than this limit. Although the Virgo UCD sample is small, it can be seen that except the two very bright ones, the rest seem to be evenly distributed with respect to this blue/red GCs’ colour limit. In this sense, Brodie et al. (2011) analysed a larger sample of UCDs around M 87, and show that for magnitudes fainter than , these objects cover a narrow colour range, similar to the blue M 87 GCs. Regarding the sample of Fornax compact objects, they cover the whole GC colour range, that is approximately (e.g. Larsen et al. 2001; Bassino et al. 2008).
However, this cannot be taken yet as an evidence that our Antlia compact objects are particularly blue. On one side, we are dealing with a small sample. On the other side, if we compare the GCSs associated to both dominant galaxies in Antlia, NGC 3258 and NGC 3268, the system around NGC 3258 has a smaller fraction of red GCs and it does not extend to redder colours as much as the NGC 3268 one does. Then, it may be just a consequence of the whole GC colour distribution being bluer too. In this case, one might wonder whether these UCDs around NGC 3258 are closely related to an extension of the GCS towards brighter luminosities. Before sustaining such conjecture, in the next Section we will compare Antlia compact objects with nuclei of same cluster dE,N galaxies, and also come back to the Antlia CMD in Section 4.4.
3.2 Luminosity profiles and nuclei of dE galaxies
As said above, one of the hypotheses for the origin of UCDs states that they could be remnants of dE,N galaxies, that had been disrupted by the tidal forces of massive galaxies. In this Section we describe the results of the study of nine dE galaxies located on the Antlia FORS1–VLT fields and their nuclei when present, with the aim of comparing the photometric properties of our UCDs and dE nuclei.
Table 2 lists the dwarf galaxies analysed in the present work, the parameters of the Sérsic models fitted to their luminosity profiles in both filters and , and the total magnitude of each component. Besides the nucleus, FS90-177 presents an extended halo and an inner component, with similar central surface brightness but more concentrated towards the nucleus.
As a result of the analysis of the surface brightness profiles, we stress that except FS90-136, the remaining eight galaxies listed in Table 2 will be considered as dE,N galaxies in the rest of this paper.
| ID | Sérsic profile parameters | |||||||||||||||||||||
| [] | [] | [] | [] | [] | [] | [] | [] | |||||||||||||||
| FS90-87 | ||||||||||||||||||||||
| FS90-103 | ||||||||||||||||||||||
| FS90-136 | ||||||||||||||||||||||
| FS90-159 | ||||||||||||||||||||||
| FS90-162 | ||||||||||||||||||||||
| FS90-176 | ||||||||||||||||||||||
| FS90-177 | ||||||||||||||||||||||
| Inner comp. | ||||||||||||||||||||||
| Outer comp. | ||||||||||||||||||||||
| FS90-186 | ||||||||||||||||||||||
| FS90-196 | ||||||||||||||||||||||
NOTES: Columns and indicate the total integrated apparent magnitude of the external component in the V and I filter, respectively. In the case of FS90-177, the integrated magnitude of each one of the external components is shown separately. Columns and indicate the apparent magnitude of the nuclei in the V and I filter, respectively. At the adopted Antlia distance, corresponds to .


The upper panel of Fig. 6 shows the magnitude of the eight dE,N nuclei measured with our surface photometry versus the those of the host galaxies. For comparison, we include in this plot dE,N galaxies from the Virgo and Fornax clusters studied by Lotz et al. (2004) whose magnitudes were available from Stiavelli et al. (2001). The galaxies in the three clusters seem to follow a similar trend, with brighter galaxies having brighter nuclei. Similar correlations can be detected in Fig. 7 of Lotz et al. (2004), where a larger sample of Virgo and Fornax nuclei are plotted versus , as well as in Coté et al. (2006) where Virgo galaxies are studied within the ACS Virgo Cluster Survey. Ferrarese et. al. (2006) found for early-type Virgo galaxies a correlation between the masses of nuclei and both host galaxy luminosity and virial mass. If a constant mass-to-luminosity ratio for dE,N nuclei is assumed, the correlation depicted in our plot would also point to a correlation between nuclei mass and galaxy luminosity. In addition, Coté et al. (2006) found that the luminosity ratio between nucleus and host galaxy does not depend on the galaxy luminosity, though a significant scatter is present in their relation. A similar conclusion can be drawn for our Antlia sample, if total luminosities are derived from the apparent magnitudes given in Table 2.
In the lower panel of Fig. 6 we present the CMD of 10 ACOs listed in Table 1 (those with data), 8 nuclei of our dE,N sample (Table 2) as well as those from Virgo and Fornax taken from Lotz et al. (2004). The solid line represents the CMR relation for Antlia confirmed elliptical galaxies from Smith Castelli et al. (2012). In order to transform the CMR from Washington system to , it was considered that (Fukugita et al. 1995) and . This last equation was derived from the relation given by Forbes & Forte (2001) for GCs, assuming that it can be applied to elliptical galaxies as well. All compact objects and dE,N nuclei seem to occupy the same region in the CMD, presenting similar colours for similar luminosities. Even though the dispersion in the plot is large, they follow a common correlation where brighter objects tend to have redder colours. The CMRs defined by early-type cluster galaxies (e.g. Smith Castelli et al. 2012, and references therein) present the same behaviour. Moreover, considering the uncertainties in the photometry, dE,N nuclei, dE,N nuclei and UCDs seem to follow the same trend as the Smith Castelli et al. (2012) CMR. For early-type galaxies, the metallicity is supposedly the parameter driving the relation, as more massive galaxies should be able to retain more metals during their evolution. However, Paudel et al. (2011) have shown that the nuclei of early-type dwarfs in Virgo cover a large range in age, so it cannot be assumed that their colours depend just on metallicity. Taking into account both plots displayed in Fig. 6, it can also be suggested that brighter dE,N galaxies have brighter and redder nuclei, in agreement with the findings of Coté et al. (2006).
3.3 Effective radius and size-luminosity relation
HST data permit to measure effective radii of extragalactic GCs or UCDs (e.g. Mieske et al. 2007, 2008; Evstigneeva et al. 2008; Madrid et al. 2010) out to the Antlia distance. The knowledge of effective radii will result in a cleaner distinction of GCs and UCDs. Moreover, new candidates may be identified, which could not be resolved by ground-based data.
At the adopted Antlia distance, the ACS pixel size of 0.055 arcsec represents pc, which is of the same order as the effective radius of small UCDs (Mieske et al. 2008; Misgeld et al. 2011).
In order to estimate the size of the confirmed Antlia compact objects located in the ACS field, ISHAPE (Larsen 1999) was used for fitting their light profiles. Through this code, intrinsic shape parameters can be derived for slightly extended sources, whose size is comparable to the FWHM of the Point Spread Function (PSF). It models the source as the convolution of an analytic profile and the PSF (obtained as explained in Section 2.1). For each source, the output given by ISHAPE includes the FWHM of the object, the ratio of the minor over major axis, the position angle and the reduced parameter.
From the list of analytic profiles offered by ISHAPE, we chose the King profile which accurately fits GC light profiles (King 1962, 1966). Different concentration parameters (, defined as the ratio of the tidal over the core radius) were applied, finding that for most of the compact objects the best estimation was obtained for , in agreement with previous determinations (e.g. Madrid et al. 2010, and references therein). It was also attempted to use as a free parameter, but most objects are only marginally resolved so that satisfactory fits could not be obtained.
ISHAPE was run on eight out of the eleven confirmed compact objects close to NGC 3258, that are located in the ACS field, i.e. ACO 2 to ACO 9. Additionally, two foreground stars confirmed by radial velocities as well as another fourteen photometric UCD candidates were fitted. In this way, we could test the goodness of the ISHAPE output for these observations and obtain, in the case of objects without spectroscopic data, a refined list of candidates.

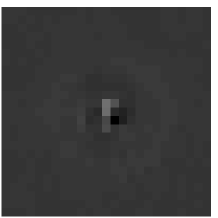
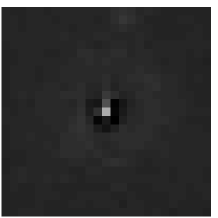
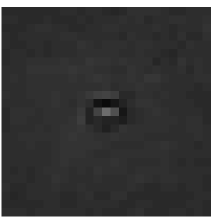
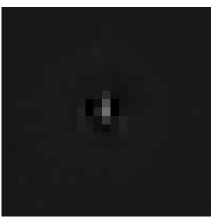
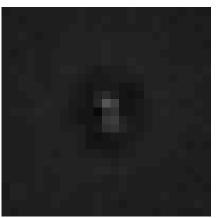
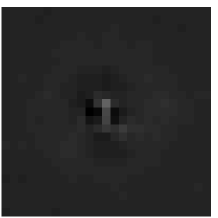
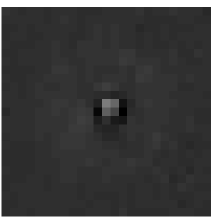
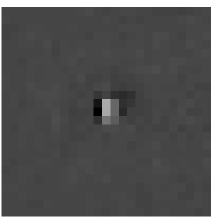
The ISHAPE estimation of the FWHM for the two foreground stars was in pixel units, i.e. one tenth of the smallest FWHM obtained for the confirmed Antlia members. Considering that the FWHM of all the compact objects measured with ISHAPE in this investigation is less than one pixel, the eccentricities will not be taken into account. We should point out that there is no evidence for large projected ellipticities of GCs or UCDs (e.g. Harris 2009 and references therein; Chiboucas et al. 2011). The residual maps for Antlia confirmed members (Fig. 7), given by ISHAPE show clean subtractions.
Fig. 8 shows the in logarithmic scale versus , for the eight confirmed Antlia compact objects close to NGC 3258 and located in the ACS field, together with similar objects from Fornax (Mieske et al. 2008), Virgo (Evstigneeva et al. 2008), and Centaurus (Mieske et al. 2007). The brightest UCDs discovered in Virgo and Fornax, (VUCD 7 and UCD 3, according to the identification given by Evstigneeva et al. 2008) are also shown. Both of them, with pc, can easily be distinguished from the rest of the objects classified as UCDs/bright GCs, suggesting that their origin could in fact be different (Evstigneeva et al. 2008). The obtained for our sample of compact objects are in good agreement with those UCDs/bright GCs of similar absolute magnitudes studied in other clusters.
The existence of a correlation between and luminosity for the brighter subsample has been discussed in the literature (Mieske et al. 2006; Evstigneeva et al. 2008; Chiboucas et al. 2011; Madrid 2011; Brodie et al. 2011). Most authors support the existence of a size-luminosity relation for objects with (e.g. Mieske et al. 2006; Misgeld et al. 2011)) while no correlation is present for fainter objects (mainly GCs according to Mieske et al.). Brodie et al. (2011) studied a sample of 34 confirmed UCDs around M 87 with half-light radii of at least 10 pc. They added a compilation from the literature of several different stellar systems, including objects of smaller sizes, and show a plot of half-light radii versus luminosity, where a break between UCDs and GCs (in their fig. 8, lower panel) can be seen at a slightly different magnitude: , though the general dispersion makes it difficult a clear determination. In fact, Brodie et al. argue that UCDs do ‘not’ show a clear size-luminosity relation, but different interpretations arise provided that the size and luminosity limits between GCs and UCDs are not widely agreed.
In order to analyse the mean sizes in different magnitude ranges, we work with the joint sample of GCs/UCDs in Antlia, Centaurus, Fornax, and Virgo. Dividing this whole sample into three magnitude ranges, the mean values of for objects with , , and , are pc, pc, and pc, respectively. That is, a trend is present with brighter objects having larger sizes. Considering a sample of 84 Galactic GCs with (Harris 1996, 2010 Edition), a mean of is obtained. This is consistent, within the errors, with the result for our faintest range, showing that the transition in size of classic GCs towards brighter systems may be within or close to that magnitude bin.

As our Antlia sample reaches small -values, it might serve to sharpen the size-luminosity relation. For this, we show in Fig. 9 in a linear scale versus for the eight confirmed compact objects, two foreground stars, and the fourteen UCD/bright GC candidates located in the ACS field. The segregation between the confirmed compact objects and the foreground stars is very clear at pc. This gap allows us to clean the list of UCD/bright CG candidates from unresolved objects, i.e. probably foreground stars. Only nine out of the fourteen original candidates present effective radii in the same range as the confirmed compact objects do. The rest of them, according to the given by ISHAPE, have low probabilities of being UCDs belonging to the Antlia cluster.
Now, we go back to the SExtractor’s CLASSSTAR and FWHM parameters that proved to be useful to select UCD/bright GC candidates. These nine marginally resolved UCD candidates selected according to the ISHAPE results, have been added as filled squares to the plots depicted in Fig. 4. Moreover, framed squares and circles denote the confirmed members and candidates with pc, respectively. In the left panel, the confirmed member with the largest has the lowest value of the SExtractor CLASSSTAR=0.74, suggesting that it cannot be considered as a genuine point source. Adding these marginally resolved UCD candidates, the parameters CLASSSTAR and FWHM show an acceptable capability to discriminate them from point sources. As expected, all compact objects with pc present higher FWHM in the right panel.
Chiboucas et al. (2011) confirmed a sample of 27 UCDs as Coma cluster members, deriving their structural parameters with GALFIT (Peng et al. 2002) and ISHAPE, employing Sérsic profiles and King profiles, respectively. They found a good agreement between the derived from both methods. Only the results for the largest object presents a clear discrepancy, but they attributed it to the presence of a halo component, that could affect the Sérsic fits more than the King ones. Therefore, Sérsic () fits were performed with ISHAPE to the Antlia compact objects located in the ACS field. The obtained with both analytic functions are depicted in Fig. 10, showing a good consistency between the results within the errors. This suggests that none of these compact objects presents an extended, diffuse component and that the calculated are reliable and not model–dependent.
If Fig. 8 and Fig. 9 are compared, it can be noticed that plotting the in a linear, not logarithmic scale, a break about could be seen, while for the fainter sources the seems to be independent of the visual absolute magnitude. As said above, a similar effect has been found by Mieske et al. (2006) at for the compact objects in Fornax. Mieske et al. also found a break in the metallicity distribution at this luminosity and argue that it can be considered as the limit between UCDs and GCs. Chiboucas et al. (2011) studied the size-magnitude relation adding to the UCD Coma cluster members, a large amount of compact objects taken from the literature. They found that GCs in the range have nearly constant half-light radii, independently of their luminosity, but the compact objects brighter than (i.e. in the UCD luminosity regime) display a trend of increasing size with increasing luminosity. A similar break about can be seen in the half-light radius versus luminosity plot presented by Misgeld et al. (2011) for Hydra I compact objects in addition to other star clusters and UCDs.
This break in the size-luminosity plane, attributed to the limit between GCs and UCDs, does not appear to be well defined as in the literature it spans integrated magnitudes . However, it should be taken into account that the existence of such an ‘abrupt’ change in the slope of this relation is quite unlikely, as the evidence points to a magnitude range where both UCDs and GCs coexist, and also the distance and photometric errors are affecting directly the absolute magnitude determination.

4 Properties of the UCD sample
After studying the sizes of the Antlia compact objects lying within the ACS field and measuring radial velocities that confirm several cluster members, it is possible to define a new sample with the most reliable selection of UCD Antlia members and candidates, which we will refer to in the rest of the paper. Among them, we have chosen those that are brighter than , that is the luminosity limit we adopt for this ‘final UCD sample’. In this way, we gather six ACO objects from Table 1 (i.e. confirmed by radial velocities) plus the nine candidates located in the ACS field that are marginally resolved sources according to their light profiles, all of them with . This leaves us with 15 UCDs that are Antlia members or candidates around NGC 3258.
4.1 Projected spatial distribution through Principal Component Analysis
In order to compare the projected spatial distribution of the UCD sample with that of the GC candidates surrounding NGC 3258, we apply Principal Component Analysis (PCA).
PCA is a very popular tool in modern data analysis, used for a diverse field of problems because it has the ability of reducing a complex data set to a lower dimension, revealing the structures that sometimes underlie it. PCA uses an orthogonal transformation to convert a set of observations of possibly correlated variables into a set of values of uncorrelated variables, less than or equal to the number of original variables, called principal components. As a consequence of the transformation, the greatest variance by any projection of the data will lie on the first coordinate of the new coordinated system (first eigenvector), the second greatest variance on the second one, and so on. For more details on PCA, we refer to Jolliffe (2002).
A PCA has been run on the spatially projected coordinates of the UCD sample, using the task PRINCOMP from the software R Project for Statistical Computing (R Development Core Team 2011).
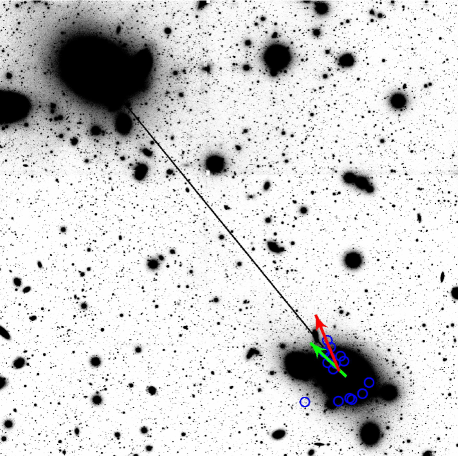
The position angle (PA) of the first eigenvector (PA , red arrow in Fig. 11), is slightly different than that of the corresponding eigenvector obtained for the GC candidates ( and ) within the radial range 0.5–2 arcmin from NGC 3258 (PA , green arrow in Fig. 11). This latter PA is in agreement with those obtained by Dirsch et al. (2003b) and Bassino et al. (2008) studying the azimuthal distribution of the NGC 3258 GCS, i.e. and , respectively. Taking into account the small size of the UCD sample, it can be considered that the results of PCA of both samples, UCDs and GCs, show similar preferential directions for their projected spatial distributions. In addition, they also agree with the PA with origin in NGC 3258 pointing to the direction of NGC 3268, of (Bassino et al. 2008, , black solid line in Fig 11).
Thus, the GCS of NGC 3258 is elongated in the direction towards NGC 3268, and a similar effect is present in the X-ray emission around NGC 3258, that has an extension in the same direction. The results of the PCA suggest that UCDs also present a projected distribution with a similar orientation. All this evidence lends support to the idea that tidal forces, between both giant ellipticals, may be playing an important role in modelling the spatial distribution of the hot intra-cluster gas and stellar systems at the Antlia cluster core. Smith Castelli et al. (2012) have shown that each giant is surrounded by a retinue of normal and dwarf early-type galaxies, and this scenario may correspond to an ongoing merger between two groups in which all, i.e. galaxies, UCDs, GCs, and hot gas, seem to participate. In fact, preliminar results of the X-ray study performed by Hawley et al. (2011) lend support to the idea that Antlia is a galaxy cluster at a phase of an intermediate merger.
4.2 Colour distribution

Fig. 12 shows the colour distribution for the UCD sample. Clearly, there is a high fraction of UCDs with , with relatively low dispersion. For the inner region of the NGC 3258 GCS, Bassino et al. (2008) fitted two Gaussians to the GC colour distribution and obtained peaks at for the blue GCs, and at for the red ones, being the colour limit between them . This would place the colour distribution of our UCD sample closer to the colour range of the blue GCs. A KMM test was applied, using the algorithm described by Ashman et al. (1994). Considering as the null hypothesis that the UCD sample colour distribution is better represented by the sum of two homoscedastic (i.e. with similar dispersion) Gaussians than by a single Gaussian, the result indicates that this hypothesis cannot be rejected, with a of confidence. However, the results of this KMM test point out that the existence of the second (redder) Gaussian is based only on the two redder members of the sample. These are the only UCDs for which the algorithm estimates a probability of belonging to the red subpopulation significantly different from zero. Then, we decided to rerun the KMM test excluding these two red objects from the UCD sample, and then the null hypothesis was rejected. According to these results, the colour distribution of UCDs in the vicinity of NGC 3258 is mainly described by a single Gaussian, with the exception of the two redder members. Their colours are , i.e. within the colour range of blue GCs and in agreement with the results obtained at Section 3.1 for the preliminar sample, where fainter objects (probable GCs) were also included.
Although our Antlia sample is rather small, we note that the majority of the UCDs, i.e. 13 out of the 15 discovered ones, have colours corresponding to the blue GC range, as well as 6 out of the 8 dE,N nuclei studied in the same cluster. In other clusters, UCDs cover the whole GC range as shown for instance by Evstigneeva et al. (2008) for Virgo and Fornax, and by Madrid et al. (2010) and Chiboucas et al. (2011) for Coma. On the other hand, UCDs in the Hydra cluster mostly appear as an extension of the red GC subpopulation towards brighter magnitudes (Wehner & Harris 2007). Such colour differences can be understood as another evidence that UCDs have multiple origins, even in similar environments, and there is no single theory that could explain all of them (Norris & Kannappan 2011). We will come back to this issue in Section 4.4.
4.3 Antlia colour-magnitude diagram
Fig. 13 shows the Antlia CMD corresponding to the faint luminosity regime, where GCs, UCDs, and dE,N nuclei are plotted. The GC photometric data were obtained from Bassino et al. (2008) and the rest of the data from this paper.
It has already been noticed by Harris et al. (2006), in an ACS–HST photometric study, that bright blue GCs in NGC 3258 and other brightest cluster galaxies present a correlation in the CMD, in the sense that they get redder with increasing luminosity, i.e. the currently called ‘blue tilt’ (e.g. Strader et al. 2006; Brodie & Strader 2006). In a later study of the NGC 3258 GCS by Bassino et al. (2008), the blue tilt is still perceptible in the CMD (their fig. 6) though it is not specifically examined, and it can also be detected at Fig. 13 as the high luminosity limit of the GCs. In order to quantify this effect, NGC 3258 GCs with where separated in four equally populated magnitude bins. For each range, we obtained the background-corrected colour distribution and fitted the sum of two Gaussians to it. The solid line in Fig. 13 is the result of fitting the mean values of the blue GCs in each bin, while the dashed lines indicate its extrapolation. This corresponds to a ‘blue tilt’ slope of . In this latter figure, the framed filled circles show all the Antlia members confirmed with radial velocities (Table 1), including both UCDs and GCs. The empty circles correspond to the UCD candidates located in the ACS field that are marginally resolved. The majority have colours in the range of blue GCs (bluer than ) except two objects with that are located on the ‘red’ side. Those identified with large circles on the ‘blue’ side follow the same trend as the blue tilt does; in fact, some of the faintest ones probably belong to the GC population.
One of the most accepted explanations of the GC blue tilt is that it corresponds to a mass-metallicity relation of metal-poor clusters, mainly driven by chemical self-enrichment (e.g. Mieske et al. 2010; Forbes et al. 2010). Moreover, the possibility of a pre-enrichment process, or a combination of both, has also been addressed with models by Bailin & Harris (2009).
The dE,N galaxies whose nuclei are depicted in Fig. 13 are Antlia members located on our four VLT fields; that is, not all of them are close to NGC 3258 but within the cluster core. Most of the dE,N nuclei in the CMD share the same location, on the blue side, with UCDs and GCs of our sample, with the exception of one nucleus that is blue but much fainter (corresponding to the faintest dwarf galaxy in our sample), and another one that is clearly on the red side and has the brightest magnitude of the sample. This sequence is also in agreement with that followed by Fornax and Virgo dE,N nuclei displayed at the lower panel of Fig. 6.
Coté et al. (2006) compared Virgo dE,N nuclei with UCDs in the same cluster from Haşegan et al. (2005), and they point out that there is agreement between both samples in terms of colour, luminosity and size. Also in Virgo, Paudel et al. (2010) performed a comparison of the stellar population of a sample of UCDs and dE,N nuclei. They obtained different metallicities and stellar population ages for the UCDs and the general nuclei sample. However, if their dE,N sample is restricted to those located in the high-density regions of Virgo, where most of the UCDs are also located, the authors reported that no significant differences are found between the populations of both kind of objects, being all old and metal-poor. Taking this into account, they suggest that Virgo UCDs may in fact be dE,N remnants.
For the Antlia cluster, we find a similar agreement regarding colours and luminosities between dE,N nuclei and mainly blue UCDs. All this evidence points to a close relation between them, as already mentioned by Harris et al. (2006), that suggests that blue UCDs may be the remnants of disrupted dE,N galaxies, i.e. stripped dwarf galaxy nucleus that may be the result of minor merger events. This idea has been sustained since the original models performed by Bassino et al. (1994) and later on by Bekki et al. (2001), among others, until some of the most recent observational evidence given by e.g. Brodie et al. (2011) and Norris & Kannappan (2011). However, the same origin does not seem to apply for red UCDs, that appear to be in a minority close to NGC 3258 in Antlia, as we just find two confirmed ones. For instance, Norris & Kannappan (2011) propose that red UCDs are just the most luminous GCs associated to the host galaxy, while Brodie et al. (2011) add a third scenario and suggest that some red UCDs may be related to the remnants of more massive and metal-rich galaxies. We can not discard that part of the UCDs in our sample may belong to the bright end of the NGC 3258 GCS.

5 Summary and conclusions
On the basis of images obtained with FORS1, MOSAIC, and the ACS–HST archive, as well as radial velocities measured on GMOS–GEMINI spectra, we have studied the first ‘compact objects’ discovered in the Antlia cluster, that comprise UCD members, UCD candidates and bright GCs located in the surroundings of the giant elliptical NGC 3258. Particularly, UCD members and candidates are selected among these compact objects, on the basis of luminosity, colour, and size. Our main results and conclusions are summarized in the following.
-
•
The Antlia compact objects comprise eleven new members (Table 1), named with the acronym ‘ACO’, whose cluster membership is kinematically confirmed with our GMOS spectra. Except for one object that lacks photometry, they follow a CMR similar to that defined by Fornax and Virgo compact objects, but they do not reach luminosities as high as their counterparts in the other clusters (Fig. 5). They have and colours mostly in the range corresponding to blue GCs.
-
•
We have obtained surface brightness profiles of nine dE galaxies in the range from the FS90 catalog (Ferguson & Sandage 1990), that are Antlia confirmed members (Smith Castelli et al. 2008a, 2012). Sérsic models have been fitted to them and the best fit parameters (central surface brightness, scale parameter, and Sérsic index) as well as total and magnitudes of the different components have been determined. Out of these nine galaxies, seven have two components (a nuclear component plus a halo), one has three components (a nucleus plus two components necessary to fit accurately the outer halo), while the other one has only one component. Thus, we can confirm their classification as one non-nucleated dE (FS90-136) and eight nucleated dE,N galaxies.
-
•
We verify that absolute magnitudes of the Antlia dE,N stellar nuclei correlate with total absolute magnitudes of their host galaxies, so that brighter galaxies tend to have brighter nuclei, in a similar way as has been detected in Fornax and Virgo (e.g. Lotz et al. 2004; Coté et al. 2006). If the nuclei have a constant mass-to-luminosity ratio, then this relation would point to the existence of a nuclei mass versus host galaxy luminosity (and mass) correlation, as found by Ferrarese et. al. (2006) in the Virgo cluster.
-
•
The nuclei of dE,N Antlia galaxies share the same locus in the CMD with nuclei of dE,N galaxies from Fornax and Virgo (Fig. 6). They all get redder with increasing luminosity, following a colour-luminosity relation that was first noticed by Coté et al. (2006) (see also Paudel et al. 2011). With regard to colours, few nuclei in this sample from Antlia, Fornax, and Virgo, are redder than , i.e. the adopted limit between blue and red GC. However, this may be a consequence of the selected sample being not bright enough, as brighter nuclei tend to be redder. Paudel et al. (2011) suggest that the processes that govern the formation of nuclei might be quite different for bright or faint dE galaxies. According to Paudel et al., the nuclei of faint dEs have old and metal-poor populations, while those of bright dEs are younger and more metal-rich. The Antlia compact objects () are located at the same position in the CMD as the dE,N nuclei from Antlia, Fornax, and Virgo (Fig. 6).
-
•
By means of the ISHAPE code, we have determined the sizes of eight Antlia compact objects located on ACS images. They have effective radii in the range pc. These objects together with nine new photometric candidates with effective radii within the same range constitute our ‘UCD sample’ close to NGC 3258, i.e. our most reliable selection. A pc is taken as the lower limit for Antlia UCDs, where a clear gap is present in the versus plot (Fig. 9). Two foreground stars, confirmed with radial velocities, are included in this plot and show that point sources are located below such limit. We remind that GCs are detected as point sources on the ACS images at the Antlia distance.
-
•
The Antlia UCD sample as well as UCDs/bright GCs in Fornax, Virgo, and Centaurus show the same behaviour regarding the size-luminosity relation. For objects brighter than a limiting magnitude, the seems to increase with increasing luminosity, while for fainter magnitudes the remains almost constant. We find this limiting magnitude or ‘break’ in the size-luminosity relation at , though different authors set it at slightly different magnitudes (e.g. Mieske et al. 2006; Chiboucas et al. 2011; Misgeld et al. 2011).
-
•
The projected spatial distribution of the UCD sample has similar characteristics as those of the NGC 3258 GCS and X-ray emission. They all present a PA in the direction to the other giant elliptical that dominates Antlia, NGC 3268. These pieces of observational evidence point to an ongoing merger between two groups in Antlia. Future kinematic studies will help to settle the question.
-
•
Most UCDs in our sample have colours within the range defined by the blue GCs, and only two appear on the red side. The blue ones follow a CMR similar to the blue tilt defined by the brightest blue GCs (Strader et al. 2006; Brodie & Strader 2006), getting redder with increasing luminosity. Moreover, six out the eight Antlia dE,N nuclei share the same locus on the CMD. As a consequence, we propose that some blue UCDs around NGC 3258 may be the remnants of stripped dwarf galaxies captured during minor merger events. Regarding the red ones, they seem to be much less numerous than the blue ones in this location, and we speculate that they may be part of a UCD subpopulation whose origin/s is/are different from the blue ones (e.g. Brodie et al. 2011; Norris & Kannappan 2011). We plan to extend our research on Antlia UCDs to the rest of the cluster in order to gather more evidence to deepen on these hypotheses.
Acknowledgments
We thank the anonymous Referee for useful comments that improved the original version. This work was funded with grants from Consejo Nacional de Investigaciones Científicas y Técnicas de la República Argentina, Agencia Nacional de Promoción Científica y Tecnológica, and Universidad Nacional de La Plata (Argentina). TR is grateful for financial support from FONDECYT project Nr. 1100620, and from the BASAL Centro de Astrofísica y Tecnologías Afines (CATA) PFB-06/2007. ASC acknowledges finantial support from Agencia de Promoción Científica y Tecnológica of Argentina (BID AR PICT 2010-0410).
References
- Anderson et al. (2009) Anderson J., Piotto G., King I.R., Bedin L.R., Guhathakurta P., 2009, ApJ, 697, L58
- Ashman et al. (1994) Ashman K.M., Bird C. M., Zepf S. E., 1994, AJ, 108, 2348
- Bailin & Harris (2009) Bailin J., Harris W.E., 2009, ApJ, 695, 1082
- Bassino et al. (1994) Bassino L.P., Muzzio J.C., Rabolli M., 1994, ApJ 431, 634
- Bassino et al. (2006a) Bassino L.P., Faifer F.R., Forte J.C., Dirsch B., Richtler T., Geisler D., Schuberth Y., 2006a, A&A, 451, 789
- Bassino et al. (2006b) Bassino L.P., Richtler T., Dirsch B., 2006b, MNRAS, 367, 156
- Bassino et al. (2008) Bassino L.P., Richtler T. , Dirsch B., 2008, MNRAS 386, 1145
- Bekki et al. (2001) Bekki K., Couch W.J., Drinkwater M.J., 2001, ApJ, 552, L105
- Bertin & Arnouts (1996) Bertin E., Arnouts S., 1996, A&AS, 117, 393
- Brodie & Strader (2006) Brodie J.P., Strader J., 2006, ARA&A 44, 193
- Brodie et al. (2011) Brodie, J.P., Romanowsky A.J., Strader J., Forbes D.A., 2011, AJ, 142, 199
- Buzzoni et al. (2012) Buzzoni A., Cellone S.A., Saracco P., Zucca E., 2012, MNRAS, 420, 3427
- Caso et al. (2009) Caso J.P., Bassino L.P., Smith Castelli A.V., 2009, BAAA, 52, 169
- Caso et al. (2010) Caso J.P., Bassino L.P., Smith Castelli A.V., 2010, BAAA, 53, 59
- Chiboucas et al. (2011) Chiboucas K. et al., 2011, ApJ, 737, 86C
- Chilingarian et al. (2011) Chilingarian I.V., Mieske S., Hilker M., Infante, L., 2011, MNRAS, 412, 1627
- Coté et al. (2006) Coté P. et al., 2006, ApJSS, 165, 57
- Dabringhausen et al. (2008) Dabringhausen J., Hilker M., Kroupa P., 2008, MNRAS, 386, 864
- Da Rocha et al. (2011) Da Rocha C., Mieske S., Georgiev I. Y., Hilker M., Ziegler B. L., Mendes de Oliveira C., 2011, A&A, 525, 86
- Dirsch et al. (2003a) Dirsch B., Richtler T., Geisler D., Forte J.C., Bassino L.P., Gieren W.P., 2003a, AJ, 125, 1908
- Dirsch et al. (2003b) Dirsch B., Richtler T., Bassino L.P., 2003b, AA, 408, 929
- Drinkwater et al. (2000) Drinkwater M.J., Jones J.B., Gregg M.D., Phillipps S. 2000, PASA, 17, 227
- Evstigneeva et al. (2007) Evstigneeva E.A., Gregg M.D., Drinkwater M.J., Hilker M., 2007, AJ, 133, 1722
- Evstigneeva et al. (2008) Evstigneeva E.A. et al., 2008, AJ, 136, 461
- Fellhauer & Kroupa (2002) Fellhauer M., Kroupa P., 2002, MNRAS, 330, 642
- Fellhauer & Kroupa (2005) Fellhauer M., Kroupa P., 2005, MNRAS, 359, 223
- Ferguson & Sandage (1990) Ferguson H.C., Sandage A., 1990, AJ, 100, 1
- Ferguson & Sandage (1991) Ferguson H.C., Sandage A., 1991, AJ, 101, 765
- Ferrarese et. al. (2006) Ferrarese L. et al., 2006, ApJ, 644, L21
- Forbes & Forte (2001) Forbes D.A., Forte J.C., 2001, MNRAS, 322, 257
- Forbes et al. (2010) Forbes D.A., Spitler L.R., Harris W.E., Bailin J., Strader J., Brodie J.P., Larsen S.S., 2010, MNRAS, 403, 429
- Fukugita et al. (1995) Fukugita M., Shimasaku K., Ichikawa T., 1995, PASP, 107, 945
- Frank et al. (2011) Frank M.J., Hilker M., Mieske S., Baumgardt H., Grebel E.K., Infante L., 2011, MNRAS, 414, L70
- Geha et al. (2002) Geha M., Guhathakurta P., van der Marel R.P., 2002, AJ, 124, 3073
- Geisler (1996) Geisler D., 1996, AJ, 111, 480
- Goerdt et al. (2008) Goerdt T., Moore B., Kazantzidis S., Kaufmann T., Maccio A.V., Stadel J., 2008, MNRAS, 385, 2136
- Gregg et al. (2009) Gregg M. et al., 2009, AJ, 137, 498
- Harris (1996) Harris W.E., 1996, AJ, 112, 1487
- Harris et al. (2006) Harris W.E., Whitmore B. C., Karakla D., Okon W., Baum W.A., Hanes D.A., Kavelaars J. J., 2006, ApJ, 636, 90
- Harris (2009) Harris W.E., 2009, ApJ, 699, 254
- Haşegan et al. (2005) Haşegan M. et al., 2005, ApJ, 627, 203
- Hau et al. (2009) Hau G.K.T., Spitler L.R., Forbes D.A., Proctor R.N., Strader J., Mendel J.T., Brodie J.P., Harris W.E., 2009, MNRAS, 394, 97
- Hawley et al. (2011) Hawley W., Machacek M., Kraft R., 2011, American Astronomical Society, HEAD meeting #12, #39.03
- Hilker (2009) Hilker M., 2009, Highlight Talk at the JENAM2008 Symposium ”Star Clusters – Witnesses of Cosmic History” (arXiv: 0906.0776)
- Hilker (2011) Hilker M., 2011, EAS Publications Series, 48, 219, doi:10.1051/eas/1148050
- Hilker et al. (1999) Hilker M., Infante L., Vieira G., Kissler-Patig M., Richtler T., 1999, A&AS, 134, 75
- Jolliffe (2002) Jolliffe I.T., 2002, Principal Component Analysis, Series: Springer Series in Statistics, 2nd ed., Springer, NY, ISBN 9780387954424
- King (1962) King I.R., 1962, AJ, 67, 471
- King (1966) King I.R., 1966, AJ, 71, 64
- Larsen (1999) Larsen S. S., 1999, A&AS, 139, 393
- Larsen et al. (2001) Larsen S.S., Brodie J.P., Huchra J.P., Forbes D. A., Grillmair C.J., 2001, AJ, 121, 2974
- Lotz et al. (2004) Lotz J., Miller B. and Ferguson H., 2004, ApJ, 613, 262
- Madrid et al. (2010) Madrid J.P. et al., 2010, ApJ, 722, 1707
- Madrid (2011) Madrid J.P., 2011, ApJ, 737L, 13M
- Maraston et al. (2004) Maraston C., Bastian N., Saglia P.R., Kissler-Patig M., Schweizer F., Goudfrooij P., 2004, A&A,416,467
- Mieske et al. (2004) Mieske S., Hilker M., Infante L., 2004, A&A, 418, 445
- Mieske et al. (2006) Mieske S., Hilker M., Infante L., Jordán A., 2006, AJ, 131, 2442
- Mieske et al. (2007) Mieske S., Hilker M., Jordán A., Infante L., Kissler-Patig M., 2007, A&A, 472, 111
- Mieske et al. (2008) Mieske S. et al., 2008, A&A, 487, 921
- Mieske et al. (2010) Mieske S. et al., 2010, ApJ, 710, 1672
- Minniti et al. (1998) Minniti D., Kissler-Patig M., Goudfrooij P., Meylan G., 1998, AJ, 115, 121
- Misgeld et al. (2011) Misgeld I., Mieske S., Hilker M., Richtler T., Georgiev I.Y., Schuberth Y., 2011, A&A, 531, A4
- Nakasawa et al. (2000) Nakasawa K., Makishima K., Fukasawa Y., Tamura T., 2000, PASJ, 52, 623
- Norris & Kannappan (2011) Norris M.A., Kannappan S.J., 2011, MNRAS, 414, 739
- Paudel et al. (2010) Paudel S., Lisker T. and Janz J., 2010, ApJ, 724, L64
- Paudel et al. (2011) Paudel S., Lisker T., Kuntschner H., 2011, MNRAS, 413, 1764
- Peng et al. (2002) Peng C.Y., Ho L. C., Impey C. D., Rix H.-W., 2002, AJ, 124, 266
- R Development Core Team (2011) R Development Core Team, 2011, R Foundation for Statistical Computing, Vienna, Austria. ISBN 3-900051-07-0, URL http://www.R-project.org/
- Rejkuba et al. (2007) Rejkuba M., Dubath P., Minniti D., Meylan G., 2007, A&A, 469, 147
- Sánchez-Blázquez (1996) SánchezBlázquez P. et al, 2006, MNRAS, 371, 703
- Sérsic (1968) Sérsic J.L., 1968, Atlas de Galaxias Australes (Córdoba: Obs. Astron., Univ. Nac. Córdoba)
- Smith Castelli et al. (2008a) Smith Castelli A.V., Bassino L.P., Richtler T., Cellone S., Aruta C., Infante L., 2008a, MNRAS, 386, 2311
- Smith Castelli et al. (2008b) Smith Castelli A.V., Faifer F.R., Richtler T., Bassino L.P., 2008b, MNRAS, 391, 685
- Smith Castelli et al. (2012) Smith Castelli A.V., Cellone, Faifer F.R., Bassino L. P., Richtler T., Romero G.A., Calderón J.P., Caso J.P., 2012, MNRAS, 419,2472
- Stiavelli et al. (2001) Stiavell M., Miller B., Ferguson H.C., Mack J., Withmore B.C., Lotz J.M., 2001, AJ, 121, 1385
- Strader et al. (2006) Strader J., Brodie J.P., Spitler L., Beasley M.A., 2006, AJ, 132, 2333
- Taylor et al. (2010) Taylor M.A., Puzia T.H., Harris G.L., Harris W.E., Kissler-Patig M., Hilker M., 2010, ApJ, 712, 1191
- Wehner & Harris (2007) Wehner E.M.H., Harris W.E., 2007, ApJ, 668, L35