Evidence for effective mass reduction in GaAs/AlGaAs quantum wells
Abstract
We have performed microwave photoresistance measurements in high mobility GaAs/AlGaAs quantum wells and investigated the value of the effective mass. Surprisingly, the effective mass, obtained from the period of microwave-induced resistance oscillations, is found to be about % lower than the band mass in GaAs, . This finding provides strong evidence for electron-electron interactions which can be probed by microwave photoresistance in very high Landau levels. In contrast, the measured magnetoplasmon dispersion revealed an effective mass which is close to , in accord with previous studies.
pacs:
73.43.Qt, 73.40.-c, 73.63.HsThe most frequently quoted value of the effective mass in GaAs/AlGaAs-based two-dimensional electron systems (2DES) is the value of the band mass of bulk GaAs, ( is the free electron mass) Sze (1981). One of the oldest and still frequently employed experimental methods to obtain is based on Shubnikov-de Haas oscillations (SdHOs).Shoenberg (1984); Pudalov (2011) Being a result of Landau quantization in a magnetic field , SdHOs are controlled by the filling factor, , where is the Fermi energy, is the carrier density, and is the cyclotron energy. Since does not enter the filling factor, it cannot be obtained from the oscillation period but, instead, one has to analyze the temperature damping of the SdHO amplitude.
The SdHO approach applied to 2DES with cm-2 usually yields values which are close to, or somewhat higher than, .(Smrčka et al., 1995; Hang et al., 2007) However, there exist studies (Coleridge et al., 1996; Tan et al., 2005) which report values significantly ( 10 %) lower than . The disagreement in obtained mass values can, at least in part, be accounted for by a relatively low accuracy of the SdHO approach.(not, a) There also exist other factors which might affect extracted , even when the procedure seems to work properly.(Hayne et al., 1992, 1997; Coleridge et al., 1996; Coleridge, 1991) According to Ref. Tan et al., 2005, the lower values of might very well be a signal of electron-electron interactions which, in contrast to the case of dilute 2DES, can actually reduce the effective mass at intermediate densities.(Smith et al., 1992; Kwon et al., 1994; Zhang and Das Sarma, 2005; Asgari et al., 2005; Asgari and Tanatar, 2006; Drummond and Needs, 2009) Therefore, it is both interesting and important to revisit the issue of low effective mass values using alternative experimental probes, which we do in this paper.
In addition to SdHOs, several other types of magnetoresistance oscillations are known to occur in high mobility 2DES.(Zudov et al., 2001a, b; Yang et al., 2002; Zhang et al., 2007, 2008; Hatke et al., 2008, 2008; Khodas et al., 2010) Unlike the filling factor entering SdHOs, the parameters controlling these oscillations do depend on , thus making it available directly from the oscillation period. In what follows, we briefly discuss one such oscillation type, microwave-induced resistance oscillations (MIROs),Zudov et al. (2001a) whose period can be measured with high precision.
MIROs appear in magnetoresistivity when a 2DES is irradiated by microwaves. Being a result of electron transitions between Landau levels owing to photon absorption, MIROs are controlled by , where is the radiation frequency. It is well established both theoretically (Durst et al., 2003; Vavilov and Aleiner, 2004; Dmitriev et al., 2005, 2009, 2012) and experimentally,(Mani et al., 2002; Zudov, 2004; Mani et al., 2004; Hatke et al., 2009) that MIROs can be described by , provided that and that the microwave power is not too high.(Hatke et al., 2011a) As a result, the higher order () MIRO maxima are accurately(Hatke et al., 2011b) described by
| (1) |
where is the magnetic field of the th maximum and .(not, b) Once the value of is verified experimentally, one can obtain using, e.g., the dispersion of the th MIRO maximum, .(not, c) Equivalently, the mass can be obtained directly from the oscillation period at a given , e.g., from the dependence of on , .
In this paper we investigate the effective mass in very high mobility GaAs/AlGaAs quantum wells using microwave photoresistance measurements performed over a wide frequency range from 100 GHz to 175 GHz. Remarkably, the effective mass extracted from MIROs is found to be considerably lower than the band mass value. More specifically, MIROs are found to be well described by Eq. (1) with the effective mass at all frequencies studied. These findings provide strong evidence for electron-electron interactions which can be probed by microwave photoresistance in very high Landau levels. In contrast, the measured dispersion of the magnetoplasmon resonance (MPR) reveals , in agreement with previous studies.
Our sample A (sample B) is a lithographically defined Hall bar of width m ( m) fabricated from a 300 Å-wide GaAs/Al0.24Ga0.76As quantum well grown by molecular beam epitaxy at Purdue (Princeton). The low-temperature density and mobility of sample A (sample B) were cm-2 ( cm-2) and cm2/Vs ( cm2/Vs), respectively. Microwave radiation, generated by a backward wave oscillator, was delivered to the sample placed in a 3He cryostat via a 1/4-in.- (6.35-mm)-diameter light pipe. The resistivity was measured under continuous microwave irradiation using a standard low-frequency lock-in technique.
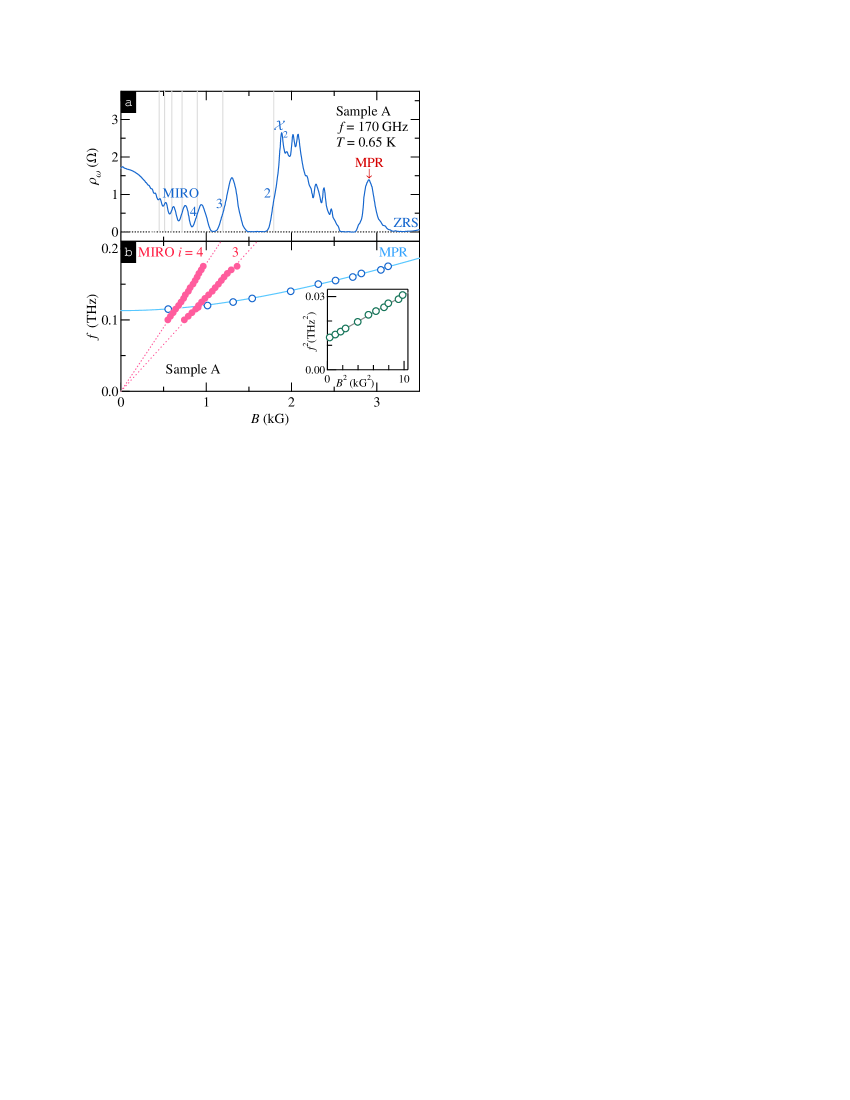
In Fig. 1(a) we present the magnetoresistivity measured at K in sample A under microwave irradiation of frequency GHz. The data reveal a giant negative magnetoresistance effect,(Bockhorn et al., 2011; Hatke et al., 2012) pronounced MIROs, zero-resistance states,(Mani et al., 2002; Zudov et al., 2003; Andreev et al., 2003; Smet et al., 2005; Zudov et al., 2006, 2006; Dorozhkin et al., 2011) and a strong peak (marked by “MPR”) which corresponds to the lowest mode of the dimensional magnetoplasmon resonance.(Vasiliadou et al., 1993; Kukushkin et al., 2006; Hatke et al., 2012) Finally, we notice a series of fast oscillations superimposed on the second MIRO maximum. The origin of these oscillations is unknown at this point, but the peak closest to the second harmonic of the cyclotron resonance (marked by “”) looks similar to the recently discovered radiation-induced peak.(Dai et al., 2010, 2011; Hatke et al., 2011c, d, b) We will return to this peak when we discuss our results in sample B.
One can accurately determine the effective mass entering Eq. (1) by trial and error, namely, by adjusting until each calculated cyclotron resonance harmonic falls symmetrically between maximum and minimum of the same order. Remarkably, such a procedure applied to the data in Fig. 1(a) results in , used to calculate the positions of vertical lines (marked by ) drawn at . The obtained value is considerably ( %) lower than and its confirmation warrants further investigation.
To this end, and to confirm that the strong peak in Fig. 1(a) is due to MPR, we have repeated our measurements at a variety of microwave frequencies, from 100 to 175 GHz. From these data we have then extracted the magnetic field positions of the MIRO maxima and of the MPR peak for all frequencies studied. Our findings are presented in Fig. 1(b) showing microwave frequency as a function of corresponding to MIRO maxima (solid circles) and to the MPR peak (open circles). It is clear that the MIRO maxima follow the expected linear dispersion relation, which extrapolates to the origin, as expected from Eq. (1). By fitting the data (dotted lines) with Eq. (1), , we obtain and for and , respectively. Since the obtained values are both very close to each other, we conclude that the effective mass accurately describes MIRO in sample A.
On the other hand, the MPR peak follows a dispersion [cf. open circles in Fig. 1(b)] characteristic of a magnetoplasmon resonance,(Chaplik, 1972)
| (2) |
where is the frequency of the lowest mode of standing plasmon oscillation. As shown in the inset, is a linear function of , in agreement with Eq. (2). From the slope of the fit to the data with (cf. solid line in the inset) we obtain . We also notice that previous MPR experiments obtained values ranging from 0.067 to 0.071.(Vasiliadou et al., 1993; Yang et al., 2006; Kukushkin et al., 2006; Muravev et al., 2007; Dorozhkin et al., 2007)
Using ,(Stern, 1967; Vasiliadou et al., 1993; Mikhailov, 2004; Mikhailov and Savostianova, 2005; not, d) where , is the permittivity of vacuum, and is the average dielectric constant of GaAs (12.8) and free space (1), we estimate GHz. This value is in good agreement with GHz obtained from the value of the fit at . The MPR dispersion [cf. solid curve in Fig. 1(b)], calculated using Eq. (2) and extracted and , shows excellent agreement with our experimental data. We thus conclude that the peak marked by “MPR” in Fig. 1(a) originates from the fundamental MPR mode.(Vasiliadou et al., 1993; Kukushkin et al., 2006; Hatke et al., 2012)
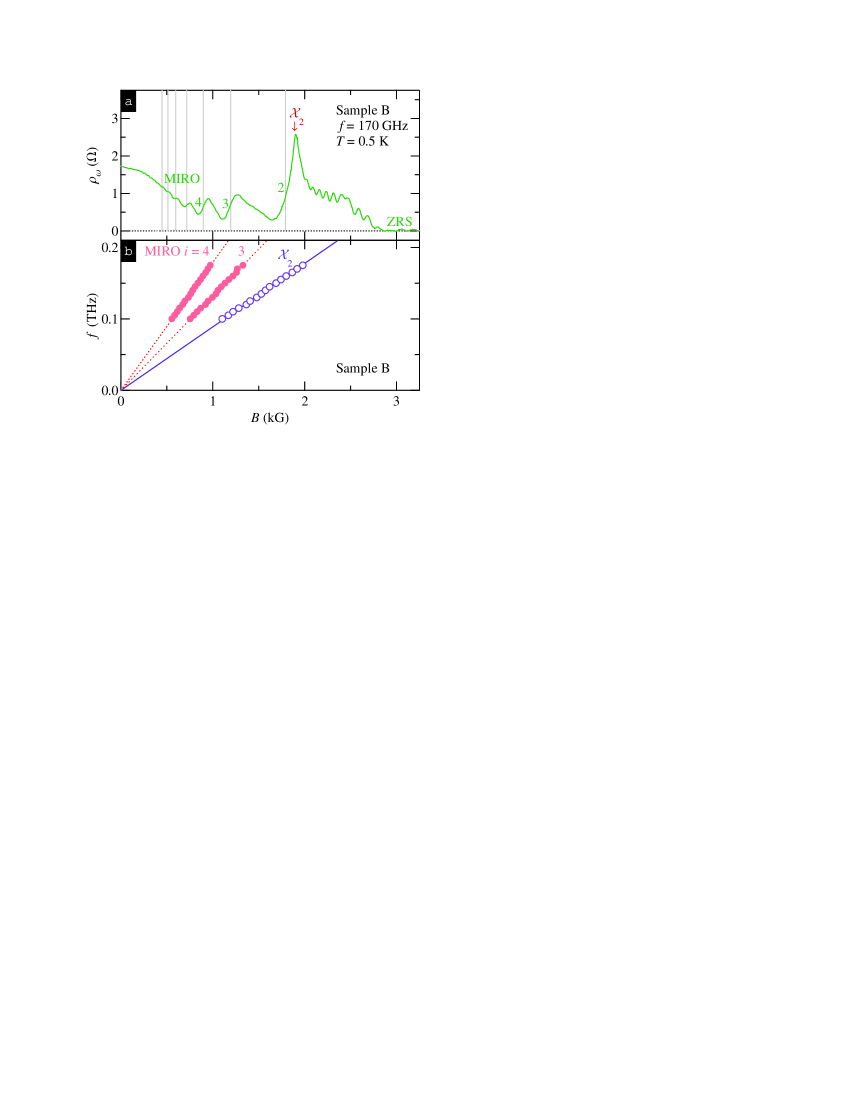
The main conclusion of our study on sample A is that the effective mass obtained from MIROs is significantly lower than both the mass entering the magnetoplasmon resonance and the band mass in GaAs. To confirm this finding we have performed similar measurements on sample B. Figure 2(a) shows measured at K in sample B under microwave irradiation of GHz. Following the procedure of trial and error, we again find that aligning MIROs with the harmonics of cyclotron resonance (cf. vertical lines) calls for a low value of the effective mass, . By repeating the measurements at different from 100 to 175 GHz, we have obtained the dispersion relations for the and MIRO maxima, which are shown in Fig. 2(b) as solid circles. The linear fits with generate and for and , respectively. We thus again find a considerably reduced effective mass value which nearly matches our result in sample A.
Close examination of Fig. 2(a) reveals that the photoresistance maximum near the second harmonic of the cyclotron resonance is considerably higher and sharper than all other maxima. We attribute this maximum to the peak recently discovered in high mobility 2DES.(Dai et al., 2010, 2011; Hatke et al., 2011c, d, b) While the origin of the peak remains unknown, its large amplitude(Dai et al., 2010; Hatke et al., 2011c) and distinct responses to dc(Hatke et al., 2011d) and to in-plane magnetic(Dai et al., 2011) fields strongly support the notion that the peak and MIROs are two different phenomena. However, there exists a controversy regarding its exact position. More specifically, Refs. Dai et al., 2010 and Dai et al., 2011 concluded that the peak occurs exactly at the second harmonic of the cyclotron resonance, . However, Refs. Hatke et al., 2011b, Hatke et al., 2011c and Hatke et al., 2011d found that the peak occurs at somewhat higher than the second harmonic. This apparent controversy can be resolved by noticing that the above conclusions were made based on different approaches. While Ref. Dai et al., 2010 has determined the peak position from the cyclotron resonance measured in absorption, Refs. Hatke et al., 2011b, Hatke et al., 2011c and Hatke et al., 2011d used MIROs as a reference. Indeed, using the latter approach we find that the peak occurs at a magnetic field somewhat higher than the second harmonic, as in previous studies.(Hatke et al., 2011c, d, b)
On the other hand, we have just established that the MIRO effective mass is significantly lower than the mass entering the MPR, which is closely related to the cyclotron resonance. Therefore it is interesting to examine the effective mass obtained from the peak, assuming that it appears exactly at the second harmonic of the cyclotron resonance, as found in Refs. Dai et al., 2010 and Dai et al., 2011. As shown in Fig. 2(b) by open circles, the peak follows a linear dispersion relation extrapolating through the origin. A linear fit with , shown by the solid line, generates ,(not, e) which is noticeably higher (lower) than the MIRO (MPR) mass.
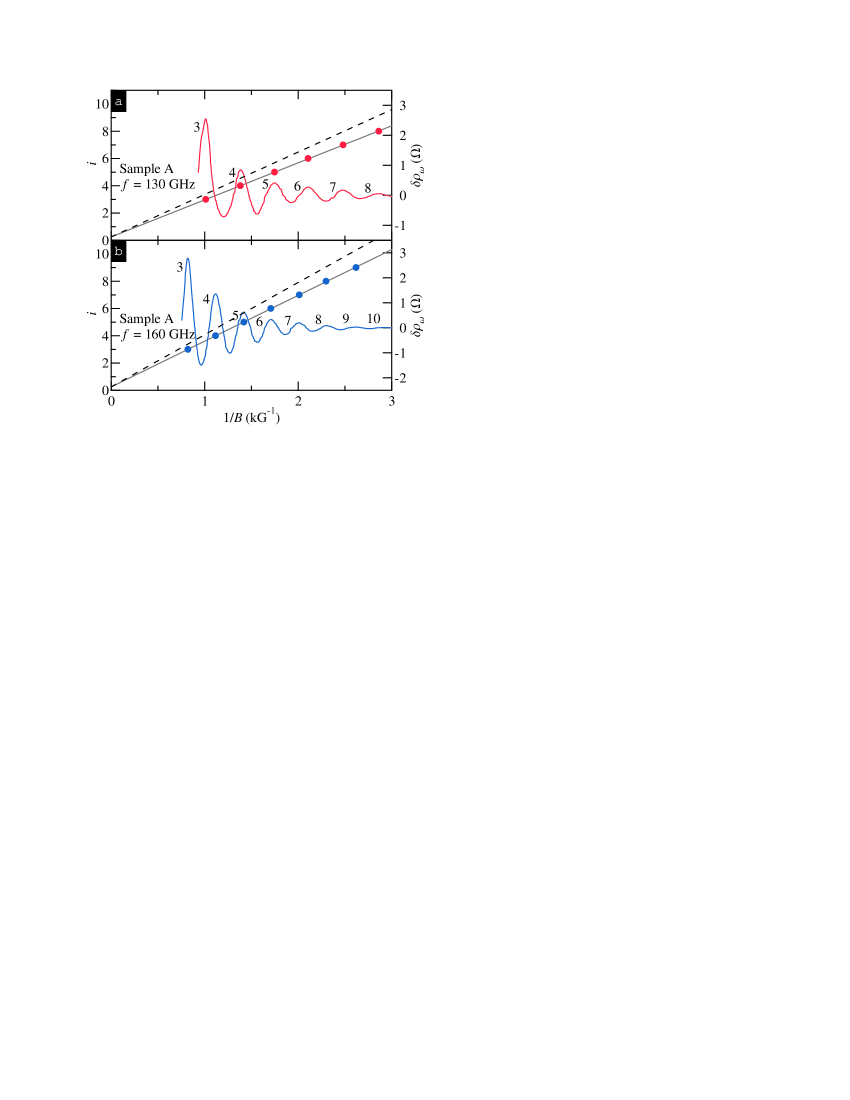
As mentioned above, one can also obtain directly from the MIRO period. This method is based on scaling of multiple oscillations and does not a priori assume . To illustrate this approach, we present on the right axis of Fig. 3 microwave photoresistivity as a function of measured in sample A at (a) GHz and (b) GHz. Both data sets exhibit multiple oscillations whose period scales with . To extract from the data, we plot the order of the MIRO maxima (circles, left axis) as a function of for both frequencies and observe expected linear dependence. From the slope of the linear fits to the data (solid lines), , we find () for GHz ( GHz).(not, f) These values are in excellent agreement with the values found from the dispersions of the MIRO maxima (cf. Figs. 1 and 2). In addition, we find that both fits intercept the vertical axis at , in agreement with Eq. (1), confirming the equivalence of two approaches. Finally, to illustrate that our data cannot be described by the band mass, we include dashed lines which are calculated using .
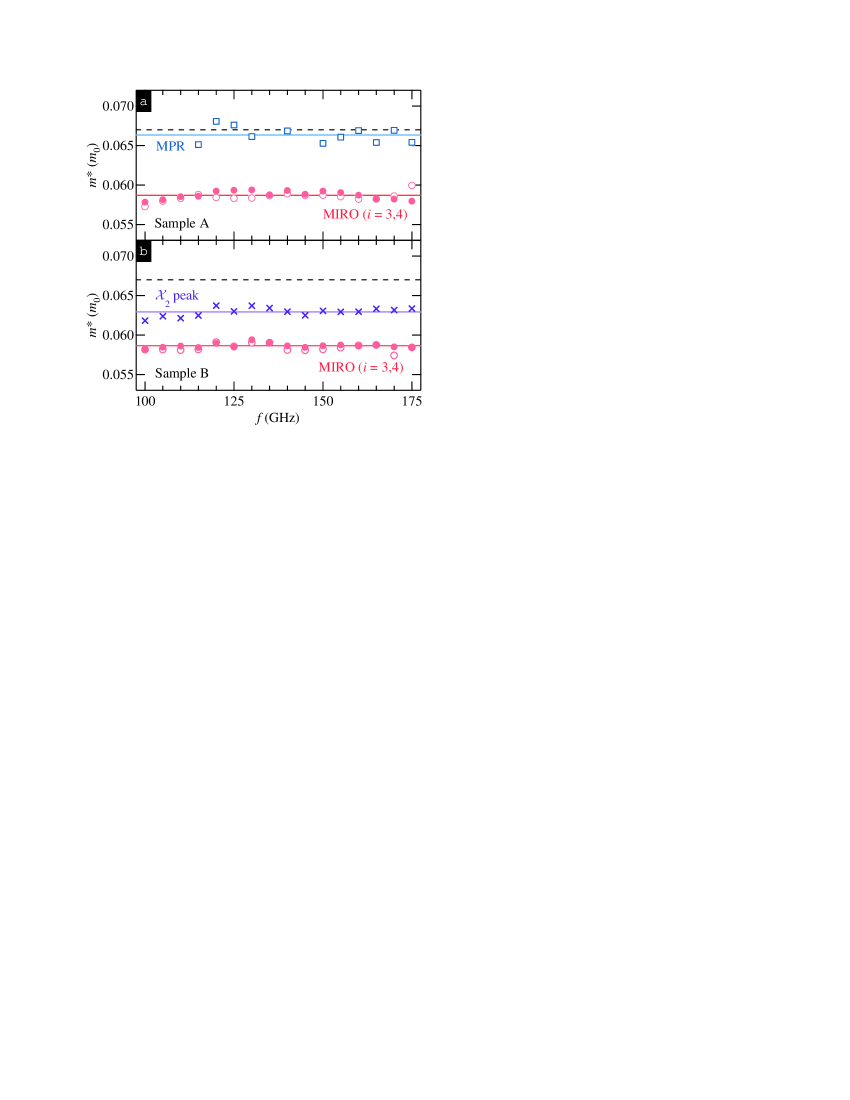
We summarize our findings in Fig. 4, showing effective mass values, obtained from the dispersion relations of different phenomena, as a function of microwave frequency. More specifically, obtained from the MIRO maxima for (open circles) and (solid circles) measured in samples A and B are shown in Fig. 4(a) and Fig. 4(b), respectively. In addition, Fig. 4(a) shows obtained from the MPR (squares), while Fig. 4(b) shows from the peak, assuming that it occurs at the second cyclotron resonance harmonic. Solid horizontal lines represent the averages of the measured values (see figure caption) and dashed horizontal lines are drawn at . Figure 4 further confirms that the masses extracted from the fits in Fig. 1(b) and Fig. 2(b) accurately describe our experimental data over the entire range of frequencies studied.
In summary, we have investigated microwave photoresistance in very high mobility GaAs/AlGaAs quantum wells over a wide range of microwave frequencies. The analysis of the period of microwave-induced resistance oscillations reveals an effective mass , which is considerably lower than the GaAs band mass . These findings provide strong evidence for electron-electron interactions in very high Landau levels and for sensitivity of MIROs to these interactions. On the other hand, the measured dispersion of the magnetoplasmon resonance is best described by . It would be interesting to examine if the low value of the effective mass is confirmed in studies of other nonlinear phenomena, such as Hall-field induced resistance oscillations.(Yang et al., 2002; Zhang et al., 2007; Hatke et al., 2012, 2011)
We thank M. Dyakonov and B. Shklovskii for discussions and J. Jaroszynski, J. Krzystek, G. Jones, T. Murphy, and D. Smirnov for technical assistance. This work was supported by the US Department of Energy, Office of Basic Energy Sciences, under Grant Nos. DE-SC002567 (Minnesota) and DE-SC0006671 (Purdue). A portion of this work was performed at the National High Magnetic Field Laboratory (NHMFL), which is supported by NSF Cooperative Agreement No. DMR-0654118, by the State of Florida, and by the DOE. The work at Princeton was partially funded by the Gordon and Betty Moore Foundation and the NSF MRSEC Program through the Princeton Center for Complex Materials (DMR-0819860).
References
- Sze (1981) S. M. Sze, Physics of Semiconductor Devices (Wiley, New York, 1981), p. 850.
- Shoenberg (1984) D. Shoenberg, Magnetic Oscillations in Metals, Cambridge Monographs on Physics (Cambridge University Press, Cambridge, 1984).
- Pudalov (2011) V. M. Pudalov, Low Temp. Phys. 37, 8 (2011).
- Smrčka et al. (1995) L. Smrčka, P. Vašek, J. Koláček, T. Jungwirth, and M. Cukr, Phys. Rev. B 51, 18011 (1995).
- Hang et al. (2007) D. Hang, C. Huang, Y. Zhang, H. Yeh, J. Hsiao, et al., Solid State Commun. 141, 17 (2007).
- Coleridge et al. (1996) P. Coleridge, M. Hayne, P. Zawadzki, and A. Sachrajda, Surf. Sci. 361-362, 560 (1996).
- Tan et al. (2005) Y.-W. Tan, J. Zhu, H. L. Stormer, L. N. Pfeiffer, K. W. Baldwin, et al., Phys. Rev. Lett. 94, 016405 (2005).
- not (a) At cm-2, Ref. Coleridge et al., 1996 (Ref. Tan et al., 2005) obtained between () and , including error bars.
- Hayne et al. (1992) M. Hayne, A. Usher, J. J. Harris, and C. T. Foxon, Phys. Rev. B 46, 9515 (1992).
- Hayne et al. (1997) M. Hayne, A. Usher, J. J. Harris, and C. T. Foxon, Phys. Rev. B 56, 10446 (1997).
- Coleridge (1991) P. T. Coleridge, Phys. Rev. B 44, 3793 (1991).
- Smith et al. (1992) A. P. Smith, A. H. MacDonald, and G. Gumbs, Phys. Rev. B 45, 8829 (1992).
- Kwon et al. (1994) Y. Kwon, D. M. Ceperley, and R. M. Martin, Phys. Rev. B 50, 1684 (1994).
- Zhang and Das Sarma (2005) Y. Zhang and S. Das Sarma, Phys. Rev. B 72, 075308 (2005).
- Asgari et al. (2005) R. Asgari, B. Davoudi, M. Polini, G. F. Giuliani, M. P. Tosi, et al., Phys. Rev. B 71, 045323 (2005).
- Asgari and Tanatar (2006) R. Asgari and B. Tanatar, Phys. Rev. B 74, 075301 (2006).
- Drummond and Needs (2009) N. D. Drummond and R. J. Needs, Phys. Rev. B 80, 245104 (2009).
- Zudov et al. (2001a) M. A. Zudov, R. R. Du, J. A. Simmons, and J. L. Reno, Phys. Rev. B 64, 201311(R) (2001a).
- Zudov et al. (2001b) M. A. Zudov, I. V. Ponomarev, A. L. Efros, R. R. Du, J. A. Simmons, et al., Phys. Rev. Lett. 86, 3614 (2001b).
- Yang et al. (2002) C. L. Yang, J. Zhang, R. R. Du, J. A. Simmons, and J. L. Reno, Phys. Rev. Lett. 89, 076801 (2002).
- Zhang et al. (2007) W. Zhang, M. A. Zudov, L. N. Pfeiffer, and K. W. West, Phys. Rev. Lett. 98, 106804 (2007).
- Zhang et al. (2008) W. Zhang, M. A. Zudov, L. N. Pfeiffer, and K. W. West, Phys. Rev. Lett 100, 036805 (2008).
- Hatke et al. (2008) A. T. Hatke, H.-S. Chiang, M. A. Zudov, L. N. Pfeiffer, and K. W. West, Phys. Rev. B 77, 201304(R) (2008).
- Hatke et al. (2008) A. T. Hatke, H.-S. Chiang, M. A. Zudov, L. N. Pfeiffer, and K. W. West, Phys. Rev. Lett 101, 246811 (2008).
- Khodas et al. (2010) M. Khodas, H. S. Chiang, A. T. Hatke, M. A. Zudov, M. G. Vavilov, et al., Phys. Rev. Lett. 104, 206801 (2010).
- Durst et al. (2003) A. C. Durst, S. Sachdev, N. Read, and S. M. Girvin, Phys. Rev. Lett. 91, 086803 (2003).
- Vavilov and Aleiner (2004) M. G. Vavilov and I. L. Aleiner, Phys. Rev. B 69, 035303 (2004).
- Dmitriev et al. (2005) I. A. Dmitriev, M. G. Vavilov, I. L. Aleiner, A. D. Mirlin, and D. G. Polyakov, Phys. Rev. B 71, 115316 (2005).
- Dmitriev et al. (2009) I. A. Dmitriev, M. Khodas, A. D. Mirlin, D. G. Polyakov, and M. G. Vavilov, Phys. Rev. B 80, 165327 (2009).
- Dmitriev et al. (2012) I. A. Dmitriev, A. D. Mirlin, D. G. Polyakov, and M. A. Zudov, Rev. Mod. Phys. 84, 1709 (2012).
- Mani et al. (2002) R. G. Mani, J. H. Smet, K. von Klitzing, V. Narayanamurti, W. B. Johnson, et al., Nature (London) 420, 646 (2002).
- Zudov (2004) M. A. Zudov, Phys. Rev. B 69, 041304(R) (2004).
- Mani et al. (2004) R. G. Mani, J. H. Smet, K. von Klitzing, V. Narayanamurti, W. B. Johnson, et al., Phys. Rev. Lett. 92, 146801 (2004).
- Hatke et al. (2009) A. T. Hatke, M. A. Zudov, L. N. Pfeiffer, and K. W. West, Phys. Rev. Lett. 102, 066804 (2009).
- Hatke et al. (2011a) A. T. Hatke, M. Khodas, M. A. Zudov, L. N. Pfeiffer, and K. W. West, Phys. Rev. B 84, 241302(R) (2011a).
- Hatke et al. (2011b) A. T. Hatke, M. A. Zudov, L. N. Pfeiffer, and K. W. West, Phys. Rev. B 84, 241304(R) (2011b).
- not (b) Strictly speaking, “1/4” in Eq. (1) should be replaced by which approaches for . For instance, according to Ref. Hatke et al., 2011b, and . However, using 1/4 in Eq. (1) instead of more accurate values is well justified since it will result in less than 1 % error in the mass.
- not (c) Alternatively, can be obtained from (a) the MIRO minima, described by , (b) the zero-response nodes, , where microwave photoresistance vanishes, or (c) directly from the oscillation period, which can be found from the positions of, e.g., th and th maxima.
- Bockhorn et al. (2011) L. Bockhorn, P. Barthold, D. Schuh, W. Wegscheider, and R. J. Haug, Phys. Rev. B 83, 113301 (2011).
- Hatke et al. (2012) A. T. Hatke, M. A. Zudov, J. L. Reno, L. N. Pfeiffer, and K. W. West, Phys. Rev. B 85, 081304(R) (2012).
- Zudov et al. (2003) M. A. Zudov, R. R. Du, L. N. Pfeiffer, and K. W. West, Phys. Rev. Lett. 90, 046807 (2003).
- Andreev et al. (2003) A. V. Andreev, I. L. Aleiner, and A. J. Millis, Phys. Rev. Lett. 91, 056803 (2003).
- Smet et al. (2005) J. H. Smet, B. Gorshunov, C. Jiang, L. Pfeiffer, K. West, et al., Phys. Rev. Lett. 95, 116804 (2005).
- Zudov et al. (2006) M. A. Zudov, R. R. Du, L. N. Pfeiffer, and K. W. West, Phys. Rev. B 73, 041303(R) (2006).
- Zudov et al. (2006) M. A. Zudov, R. R. Du, L. N. Pfeiffer, and K. W. West, Phys. Rev. Lett. 96, 236804 (2006).
- Dorozhkin et al. (2011) S. I. Dorozhkin, L. Pfeiffer, K. West, K. von Klitzing, and J. H. Smet, Nature Phys. 7, 336 (2011).
- Vasiliadou et al. (1993) E. Vasiliadou, G. M ller, D. Heitmann, D. Weiss, K. von Klitzing, et al., Phys. Rev. B 48, 17145 (1993).
- Kukushkin et al. (2006) I. V. Kukushkin, V. M. Muravev, J. H. Smet, M. Hauser, W. Dietsche, et al., Phys. Rev. B 73, 113310 (2006).
- Hatke et al. (2012) A. T. Hatke, M. A. Zudov, J. D. Watson, and M. J. Manfra, Phys. Rev. B 85, 121306(R) (2012).
- Dai et al. (2010) Y. Dai, R. R. Du, L. N. Pfeiffer, and K. W. West, Phys. Rev. Lett. 105, 246802 (2010).
- Dai et al. (2011) Y. Dai, K. Stone, I. Knez, C. Zhang, R. R. Du, et al., Phys. Rev. B 84, 241303 (2011).
- Hatke et al. (2011c) A. T. Hatke, M. A. Zudov, L. N. Pfeiffer, and K. W. West, Phys. Rev. B 83, 121301(R) (2011c).
- Hatke et al. (2011d) A. T. Hatke, M. A. Zudov, L. N. Pfeiffer, and K. W. West, Phys. Rev. B 83, 201301(R) (2011d).
- Chaplik (1972) A. V. Chaplik, Sov. Phys. JETP 35, 395 (1972).
- Yang et al. (2006) C. L. Yang, R. R. Du, L. N. Pfeiffer, and K. W. West, Phys. Rev. B 74, 045315 (2006).
- Muravev et al. (2007) V. M. Muravev, C. Jiang, I. V. Kukushkin, J. H. Smet, V. Umansky, et al., Phys. Rev. B 75, 193307 (2007).
- Dorozhkin et al. (2007) S. I. Dorozhkin, J. H. Smet, K. von Klitzing, L. N. Pfeiffer, and K. W. West, JETP Lett. 86, 543 (2007).
- Stern (1967) F. Stern, Phys. Rev. Lett. 18, 546 (1967).
- Mikhailov (2004) S. A. Mikhailov, Phys. Rev. B 70, 165311 (2004).
- Mikhailov and Savostianova (2005) S. A. Mikhailov and N. A. Savostianova, Phys. Rev. B 71, 035320 (2005).
- not (d) Equation (2) is valid when the retardation effects can be ignored, i.e. when (Refs. Mikhailov, 2004 and Mikhailov and Savostianova, 2005). In sample A, we estimate .
- not (e) This value is lower than obtained in Ref. Dai et al., 2010.
- not (f) Similar values have been obtained from the MIRO minima and from the zero-response nodes (not shown).
- Zhang et al. (2007) W. Zhang, H.-S. Chiang, M. A. Zudov, L. N. Pfeiffer, and K. W. West, Phys. Rev. B 75, 041304(R) (2007).
- Hatke et al. (2012) A. T. Hatke, M. A. Zudov, L. N. Pfeiffer, and K. W. West, Phys. Rev. B 79, 161308(R) (2009).
- Hatke et al. (2011) A. T. Hatke, M. A. Zudov, L. N. Pfeiffer, and K. W. West, Phys. Rev. B 83, 081301(R) (2011).