The photospheric solar oxygen project:††thanks: Based on observations collected at ESO Paranal Observatory, Programme 182.D-5053(A)
Abstract
Context. In the Sun, the two forbidden [OI] lines at 630 and 636 nm were previously found to provide discrepant oxygen abundances.
Aims. We investigate whether this discrepancy is peculiar to the Sun or whether it is also observed in other stars.
Methods. We make use of high-resolution, high signal-to-noise ratio spectra of four dwarf to turn-off stars, five giant stars, and one sub-giant star observed with THEMIS, HARPS, and UVES to investigate the coherence of the two lines.
Results. The two lines provide oxygen abundances that are consistent, within observational errors, in all the giant stars examined by us. On the other hand, for the two dwarf stars for which a measurement was possible, for Procyon, and for the sub-giant star Capella, the 636 nm line provides systematically higher oxygen abundances, as already seen for the Sun.
Conclusions. The only two possible reasons for the discrepancy are a serious error in the oscillator strength of the Ni I line blending the 630 nm line or the presence of an unknown blend in the 636 nm line, which makes the feature stronger. The CN lines blending the 636 nm line cannot be responsible for the discrepancy. The Ca i autoionisation line, on the red wing of which the 636 nm line is formed, is not well modelled by our synthetic spectra. However, a better reproduction of this line would result in even higher abundances from the 636 nm, thus increasing the discrepancy.
Key Words.:
Sun: abundances – Sun: photosphere –- Star: abundances – line: formation -– radiative transfer1 Introduction
We investigate the discrepancy in the oxygen abundance derived from the two forbidden oxygen lines at 630.0 and 636.3 nm. This discrepancy in the solar photosphere was highlighted by our analysis (Caffau et al., 2008). We wish to establish if this disagreement is peculiar to the Sun or if it is shared by other stars. In this context, we are not interested in the oxygen abundance itself, but in the agreement of the two [OI] forbidden lines with respect to the abundance determination. In Caffau et al. (2008) we investigated four solar atlases, and for all of them we found that the oxygen abundance derived from the resonance line at 630 nm is about 0.1 dex lower than the abundance derived from the subordinate line at 636 nm. The [OI] lines at 630 and 636 nm are blended, with a Ni i line and some weak CN lines, respectively. These CN lines are mainly on the red wing of the blend: they are negligible in solar temperature stars but become visible in cooler stars. The subordinate line at 636 nm also lies on the red wing of a Ca i auto-ionisation line. Generally, we can envisage several explanations for the disagreement:
-
•
the oscillator strength of one/both oxygen lines is in error
-
•
the oscillator strength(s) of one/some blending line(s) is/are incorrect
-
•
there are unknown lines blending one/both [OI] lines
-
•
the line profile of the Ca i auto-ionisation line is not modelled with sufficient precision
-
•
there are some unknown blends making the 636 nm feature stronger
-
•
hydrodynamical effects
-
•
non-local thermodynamical equilibrium effects.
We already investigated the last of these explanations in Caffau et al. (2008) and feel confident about excluding it. The level populations of the [OI] lines are close to local thermodynamical equilibrium. For CN and Ni i lines there is no investigation of the deviation from local thermodynamical equilibrium (NLTE), but we do not think NLTE can be responsible for this disagreement. The values for the two [OI] lines are of good quality (Storey & Zeippen, 2000) and come from the same computation. Thus we expect that, if any systematic error affects the calculation, it affects both lines in the same way and both lines should scale in the same way. We discard errors in the oscillator strengths of the oxygen lines as a possible explanation for the discrepancy.
In the following we describe the observations and analysis of four dwarf, one sub-giant, and five giant stars. Since the different blending components have a different response to effective temperature and gravity, we can make some progress discarding some of the possible explanations.
A third forbidden oxygen line at 557.7 nm is observable in the solar spectrum. However, the oxygen contribution to the feature is minor with respect to the contribution of C2, for which only uncertain molecular data are available (see Meléndez & Asplund, 2008).
| Wavelength | Transition | Elow | |
|---|---|---|---|
| nm | eV | ||
| 630.0304 | 3PD | 0.000 | –9.717 |
| 636.3776 | 3PD | 0.020 | –10.185 |
2 Atomic data and model atmospheres
For the [OI] lines we adopted from Storey & Zeippen (2000) listed in Table 1. For the Ni i blending line we adopted the = –2.11 from Johansson et al. (2003) and an isotopic structure as described in Caffau et al. (2008). For CN molecules we used the line list of Kurucz111http://kurucz.harvard.edu/. We also tested the CN atomic data kindly provided by Bertrand Plez. There are differences between the two line lists overall for the 636 nm line, but this more updated list has the effect of increasing the solar abundance of oxygen derived from this line, aggravating the disagreement between the two lines as A(O) indicators.
For each star we computed an ATLAS 9 or ATLAS 12 model, running the Linux version of ATLAS (Kurucz, 2005; Sbordone et al., 2004; Sbordone, 2005). In the cases for which an opacity distribution functions (ODF) with similar parameters was available, we ran an ATLAS 9 model; otherwise we ran an ATLAS 12. The line profiles were computed with SYNTHE (Kurucz, 1993, 2005) in its Linux version (Sbordone et al., 2004; Sbordone, 2005).
3 Observations
We obtained high-resolution, high signal-to-noise (S/N) ratio spectra with THEMIS (Arnaud et al., 1998) and HARPS (see below) for five stars. We complemented this data with high-quality spectra for the other four stars obtained with either HARPS or UVES (Dekker et al., 2000), which were retrieved from the ESO archive222archive.eso.org or the UVES-POP database (Bagnulo et al., 2003). For three of the stars observed with THEMIS we also retrieved UVES spectra from the UVES-POP database.
3.1 THEMIS
Observations with the French telescope THEMIS (INSU/CNRS), which is located at Observatorio del Teide, Tenerife, Canary Islands, were obtained in April and September 2011. THEMIS is an altazimuthal one-meter telescope with primary focus at f/17 and secondary focus at f/60. A tip-tilt mirror is located at the secondary focus for image stabilisation and feature tracking. The slit of the spectrograph has an aperture of 0.5 arc sec. The spectrograph operates with two gratings: a predisperser and a disperser. The dispersion is 5 mm for 0.1 nm wavelength at 630 nm. The resolution of the spectrograph in the red part of the spectrum is R = 300 000. Data were registered using a cooled EMCCD device (electron multiplication) with high gain (100) for stellar spectra. The spectral pixel on the EMCCD device was 12 mÅ in the spectral direction and 0.2 arc sec in the spatial direction. The typical exposure time was one hour for the stellar spectra (S/N ratio 100, depending on the magnitude).
3.2 HARPS
Stellar spectra observed with the High Accuracy Radial velocity Planet Searcher(HARPS; Mayor et al., 2003) spectrograph mounted at the 3.6 m telescope at the La Silla ESO observatory were also obtained from the pipeline processed data archive333http://archive.eso.org/wdb/wdb/eso/repro/form. HARPS is a fibre-fed, cross-dispersed echelle spectrograph, which provides a resolution R=115.000 with a fixed format covering the 380-690 nm spectral range. The HARPS pipeline delivers science-quality products. In particular, master calibrations are created (master-bias and master-flat fields), and data are bias subtracted and divided by the flat field by using the calibrations closest in time to the science observations. Spectral orders are located and extracted, and the wavelength solution obtained using a Thorium-Argon calibration lamp is then applied. We refere to the documentation of the data reduction pipeline for further information444http://www.eso.org/sci/facilities/lasilla/instruments/harps/doc/index.html.
3.2.1 HARPS observations
We observed HD 26297 on the night of September 19th, 2008. Two 1 hr plus one 50 min exposure were collected with air mass (AM) varying in the range 1.5-1.1. The seeing conditions were variable between 1-1.5 arcsec, and we obtained a S/N ratio of about 300 at 630 nm in the single frames, which converted to a S/N of the median combined, final spectrum.
3.2.2 HARPS archival data
Archive HARPS spectra for HD 30562 were retrieved from the ESO archive. Observations were taken on November 17th, 2011 at AM1.3 and with seeing conditions below 1 arcsec. Three 300 s spectra were retrieved, yielding a S/N ratio of the median spectrum of about 280 at 630 nm.
For Cen A we used a sequence of 12 spectra, each of 2 s exposure, observed on 10/06/2006; the spectra were co-added. For Cen B we co-added (after shifting to rest wavelength) 182 exposures, obtained between 10/06/2006 and 30/03/2009. The exposures were either of 5 s or 10 s duration. The resulting S/N ratio is better than 500 for both co-added spectra.
3.3 UVES
The UVES spectra for Aldebaran, Arcturus, Procyon, and HD 152786 were downloaded from the UVES-POP database (Bagnulo et al., 2003)555http://www.eso.org/sci/observing/tools/uvespop.html.html. These spectra have all been acquired with a 05 slit that provides a resolution of about 80 000.
| Star | Instr. | [Fe/H] | [C/H] | [N/H] | [Ni/H] | A(O)630 | A(O)636 | EW | EW | ||
|---|---|---|---|---|---|---|---|---|---|---|---|
| Aldebaran | THEMIS | 3891 | 1.20 | -0.15 | 8.30 | 8.16 | 6.08 | 8.74 | 8.76 | 7.5 | 4.6 |
| Arcturus | THEMIS | 4300 | 1.50 | -0.50 | 8.00 | 7.36 | 5.75 | 8.57 | 8.54 | 7.1 | 3.2 |
| Pollux | THEMIS | 4750 | 2.74 | 0.00 | 8.52 | 7.92 | 6.25 | 8.78 | 8.81 | 3.0 | 1.3 |
| HD 152786 | UVES | 4350 | 1.50 | -0.40 | 8.10 | 7.46 | 5.85 | 8.87 | 8.90 | 8.4 | 4.3 |
| HD 26297 | HARPS | 4400 | 1.10 | -1.87 | 7.17 | 5.51 | 4.06 | 7.51 | 7.52 | 4.0 | 1.3 |
| Capella | THEMIS | 5270 | 3.05 | -0.37 | 8.13 | 7.49 | 5.88 | 8.34 | 8.62 | 1.3 | 3.7 |
| HD 30562 | HARPS | 5876 | 4.00 | +0.19 | 8.71 | 8.11 | 6.64 | 5.0 | 0.3 | ||
| Cen A | HARPS | 5824 | 4.34 | +0.24 | 8.76 | 8.16 | 6.49 | 8.82 | 8.93 | 0.8 | 0.3 |
| Cen B | HARPS | 5223 | 4.44 | +0.25 | 8.77 | 8.17 | 6.50 | - | - | 0.5 | 0.3 |
| Sun | 5780 | 4.44 | +0.00 | 8.50 | 7.86 | 6.25 | 8.69 | 8.81 | 0.47 | 0.14 | |
| Procyon | UVES | 6500 | 4.00 | 0.00 |
1 EWs take into account the contributions of oxygen and all blends; they are not used for the abundance analysis, but give an order of magnitude of the strength of the lines.
4 Data analysis
4.1 Sun
We already analysed the two solar [OI] lines in Caffau et al. (2008), where we derived the abundance from equivalent width (EW) measurements and used as model a (Freytag et al., 2002, 2012) solar model. The oxygen abundances derived from the two forbidden lines at 630 and 636 nm in Caffau et al. (2008) are and , respectively. However, there is no unanimous opinion about the disagreement of the oxygen abundance derived from the two [OI] lines. Asplund et al. (2004) find a very good agreement between the two oxygen abundances derived from the two [OI] lines (A(O)=8.69 and 8.67, respectively). More recently the oxygen derived from the two [OI] lines by the group led by Asplund is quoted as A(O) of 8.64 and 8.70, respectively (Stasińska et al., 2012).
In the present work we are not interested in the solar oxygen abundance as such, but in the disagreement between the A(O) derived from the two forbidden lines. In preparation is a detailed study of the two forbidden lines in the solar photosphere, with spectra observed especially for this purpose, as well as a discussion of the results derived from other groups.
We here approach the solar spectra in the same way as we do for the other stars to be consistent with the analysis of the other stars when we compare them, with the just difference that we consider only two disc-centre spectra. We already know from Caffau et al. (2008) that disc-centre and integrated-disc spectra give consistent results with respect to the disagreement between the oxygen abundance derived from the two [OI] lines; we prefer to do the analysis with disc-centre spectra because the full width half maximum of the lines is smaller than in the integrated disc spectra. We analysed two disc-centre solar spectra: Neckel & Labs (1984) absolutely calibrated Fourier transform spectra obtained at Kitt Peak, and Delbouille et al. (1973) observed at Jungfraujoch666http://bass2000.obspm.fr/solar_spect.php.
As solar model atmospheres we used the model obtained by averaging each 3D snapshot of the solar model, , used in Caffau et al. (2008) over surfaces of equal (Rosseland) optical depth. For the blending lines, the adopted abundances of the relevant elements are A(C)=8.50 and A(N)=7.86 from Caffau et al. (2011a) and A(Ni)=6.25 from Grevesse & Sauval (1998). In this analysis, as well as in Caffau et al. (2008), the abundance from the subordinate line comes out more than 0.1 dex higher than from the resonance line when analysing the Kitt Peak solar atlas (see Table 1). In the case of the Jungfraujoch spectrum, the disagreement from the two lines is 0.08 dex.
According to a SYNTHE simulation, by using as input the model, the Ni contribution to the total EW of the 630 nm blend is about 36.7%, 31.7%, and 27.0% if A(O) is of 8.56, 8.66, and 8.76, respectively. The CN contribution to the total EW of the 636 nm line is 18.8%, 15.6%, and 12.9%, if A(O) is of 8.56, 8.66, and 8.76, respectively.
The best fit (lowest reduced as described in Bonifacio & Caffau 2003) of the subordinate line is obtained with a broadening larger (by about 0.5 ) than the one required for the best fit of the forbidden line at 630 nm. A change of 0.5 in the broadening produces a change in the oxygen abundance of 0.02 dex from the 636 nm line. In conclusion, with the broadening fixed at the value derived from the best fit of the line at 630 nm, the fit of the subordinate line is not as well reproduced as the [OI] 630 nm line.
An increase of 0.2 dex in the oscillator strengths of the CN lines blending the subordinate line is not enough to decrease significantly the derived oxygen abundance. It decreases the A(O) by 0.06 dex, which is the right direction, but not enough.
The shape of the auto-ionisation Ca i line is not well reproduced by the synthetic spectra. The Ca line seems somewhat deeper in the observed spectrum. We increased the Ca abundance to improve the agreement between observed and synthetic spectra. An increase of 0.1 dex in A(Ca) improves the all-in-all comparison of the range, but increases the oxygen abundance by 0.02 dex. This difference is negligible and anyway in the wrong direction to improve the agreement between the two lines. We also shifted a high-excitation Fe i line so that it blends the [OI] 636 nm line, and the presence of this line decreases A(O) derived from this line by 0.05 dex (see Section 5 for details). A decrease in the Ni abundance of 0.1 dex implies an increase of A(O) by about 0.04 dex.
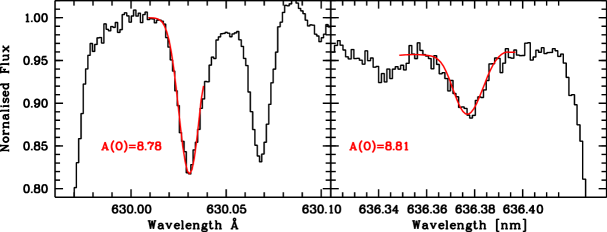
4.2 Aldebaran
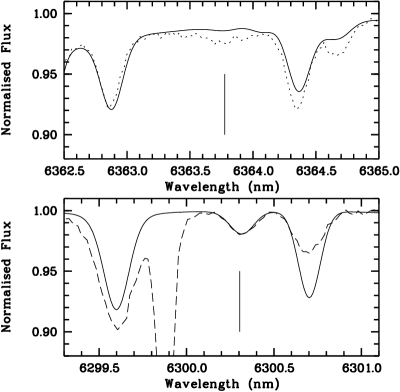
We analysed a spectrum observed with THEMIS and two spectra observed with UVES-VLT that we downloaded from the UVES-POP database (Bagnulo et al., 2003). The stellar parameters //[M/H] (3891/1.2/–0.15) and the abundances of the relevant elements ([C/Fe]=–0.20, [N/Fe]=+0.30) are from Meléndez et al. (2008). We computed an ATLAS 9 model with parameters 3891/1.2/0.0 and adjusted the abundances in the spectral-synthesis computation. We scale Ni as Fe. With a line-profile fitting of the two [OI] lines and an ATLAS+SYNTHE grid, we derive the oxygen abundances shown in Table 2. The agreement between the observations we have from the two spectrographs is good, but the data are not of the quality to derive A(O) from such complicated spectra. The uncertainty related to the continuum placement and the broadening is large (on the order of 0.04 dex). The oxygen abundance from the [OI] 630 nm line is in close agreement with the abundance derived from the subordinate line, but there are several uncertainties due to a feature on the red side of the 636.6 nm line that is not reproduced in the synthetic spectrum. The best fits are shown in Fig. 1, but as it can be seen in the plot, the fit on the subordinate line does not incorporate the red wing.
According to an ATLAS+SYNTHE simulation, the Ni contribution to the complete EW of the 630 nm blend is negligible. This is also because the 630 nm line is saturated (EW of about 7.5 pm) and an EW of about 0.6 pm of the Ni line has no effect on the A(O) determination. As expected, a change of 0.1 dex in the Ni abundance does not affect the oxygen abundance derived from the [OI] 630 nm line. The CN contribution to the complete EW in the 636 nm line is still small, but somewhat larger than the Ni contribution in the O+Ni blend at 630 nm (about 16% in EW, but one should take into account the saturation effects). The largely prevalent contribution in both features is due to oxygen.
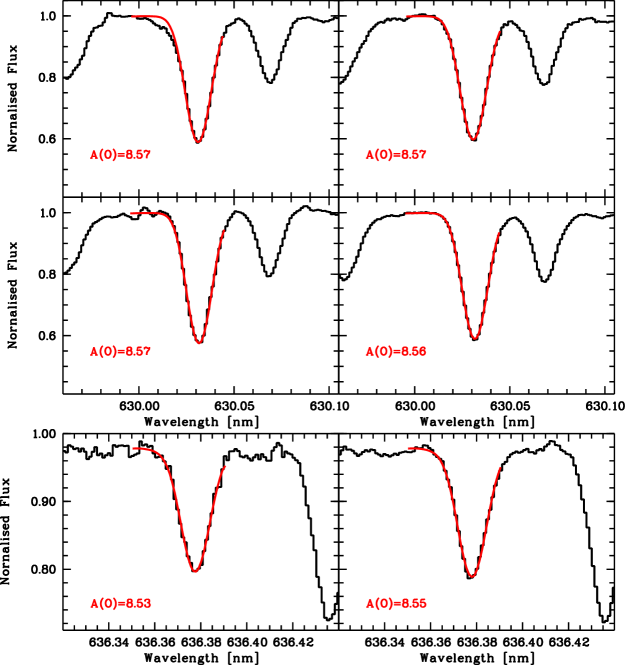
4.3 Arcturus
We analysed four spectra of the 630.0 nm [OI] line and two of the 636.3 nm [OI] line, observed with THEMIS, and a spectrum observed with UVES-VLT that we downloaded from the UVES-POP database (Bagnulo et al., 2003). The stellar parameters that we adopted are //[M/H] = 4300/1.5/–0.5, and [/Fe]=0.0. The oxygen abundance that we derive from line profile fitting of the two [OI] lines with an ATLAS+SYNTHE grid are given in Table 2. Both the agreement between the two spectrographs and the agreement between the two [OI] lines are good. The oxygen abundance of the 630 nm line is insensitive to the Ni abundance because the contribution from Ni in the O+Ni blend is negligible. According to a SYNTHE simulation, when an input ATLAS model is used, the Ni contribution to the complete EW of the 630 nm blend is small (6.4% in EW) and the CN contribution to the complete EW in the 636 nm line is similar (6.9%).
The abundance of the relevant elements is A(C)=8.00, A(N)=7.36, and A(Ni)=5.75. Adopting A(C)=8.06, A(N)=7.55 the agreement between the oxygen abundance derived from the two [OI] lines is still good. The fits are shown in Fig. 2
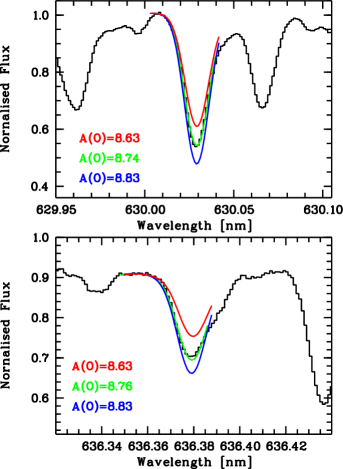
4.4 Pollux
Pollux is another giant, 4750K/2.74/0.0 (Mallik, 1998), observed with THEMIS, for which we have a reasonable agreement between the oxygen derived from the two [OI] lines, giving a difference of 0.03 dex (see Fig. 3 and Table 2). The uncertainty in the continuum placement for the 636 line is up to 0.05 dex. This is a solar metallicity giant, but the contribution of the Ni line in the O+Ni blend is negligible. We fitted the line profile with a grid of synthetic spectra containing only the lines of O and Ni. The neglect of the other lines in the range increases the O abundance by 0.01 dex. For a decrease of 0.1 dex in the Ni abundance (from 6.25 to 6.15), A(O) increases by less than 0.02 dex. The major contribution in both blends is oxygen.
4.5 HD 152786
HD 152786 has stellar parameters very similar to those Arcturus (4350 K/1.5/–0.40). We retrieved spectra from the UVES-POP database (Bagnulo et al., 2003). We obtain satisfactory agreement between the abundance derived from the two oxygen lines (see Table 2), assuming A(C)=8.10, A(N)=7.46, and A(Ni)=5.85. The Ni contribution in the blend at 630 nm is very small.
4.6 HD 26297
We decided to analyse a metal-poor giant to understand if the disagreement in A(O) seen in un-evolved stars can be related to the strength of the lines. In fact, at fixed metallicity the [OI] lines are much stronger in the spectra of giant stars. We computed an ATLAS 12 model with the parameters from Burris et al. (2000), which are of 4400 K, gravity of 1.1, and [Fe/H]=–1.87. We fixed C and N from Gratton & Ortolani (1986) and Ca and Ni from Pilachowski et al. (1996). The oxygen abundances derived from the two lines are in very good agreement (see Table 2).
4.7 Capella
The stellar parameters we adopted are from McWilliam (1990) ( =5270 K, =3.05, [M/Fe]=–0.37). The spectra are not of as good quality as for Aldebaran and Arcturus, but this suboptimal quality cannot justify the disagreement in the oxygen abundance derived from the two forbidden lines of almost 0.3 dex, that is A(O) of 8.34 and 8.62 from the line at 630 and 636 nm, respectively (see Table 2) with A(C)=8.13, A(N)=7.49, and A(Ni)=5.88. The model atmosphere used was with [/Fe]=0. If we take the model atmosphere with [/Fe]=0.4, we obtain A(O) of 8.46 and 8.76 from the line at 630 and 636 nm, respectively.
According to ATLAS+SYNTHE simulations, when an input ATLAS model with [/Fe]=0 is used, the Ni contribution to the complete EW of the 630 nm blend is non-negligible (18.1% in EW), a change in A(Ni) of –0.1 dex decrease A(O) of 0.02 dex. The CN contribution to the complete EW in the 636 nm line is smaller (12.5%).
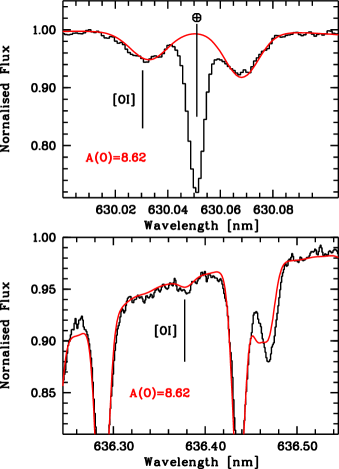
4.8 HD 30562
We analysed the HARPS spectra for HD 30562, but unfortunately one of the telluric lines of the range falls on the wing of the 630.0 nm [OI] line. We computed a synthetic spectrum ATLAS+SYNTHE with the stellar parameters from Feltzing & Gustafsson (1998) (5876/4.0/+0.19), and [O/Fe]=–0.6. The quality of the data is not good enough to permit a line profile fitting. Synthetic spectra are, however, shown in Fig.4. At this uncertainty, the two lines seem to agree, but the telluric line absorption close to the 630 nm line probably alters the profile of the oxygen line. As a result A(O)=8.62 can be seen as an upper limit for the line at 630.0 nm, while it is perhaps a lower limit for the line at 636.3 nm.
4.9 Centauri A
We downloaded HARPS observations from the ESO archive777http://archive.eso.org/eso/eso_archive_adp.html. The stellar parameters (5824/4.34/+0.24) are from Porto de Mello et al. (2008). We used an ATLAS12 model computed with the parameters of the star. The two [OI] lines are in strong disagreement, giving an oxygen abundance of A(O)=8.82 from the 630 nm line and A(O)=8.92 from the line at 636.3 nm (see the fits in Fig. 5 and the results in Table 2). From the figure it can appear that the fit of the subordinate line is suboptimal because the shape of the Ca i auto-ionisation line is not properly modelled.
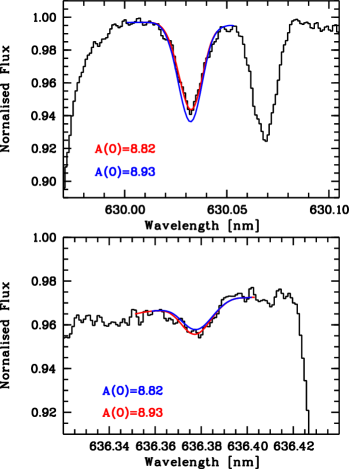
An increase of the Ni abundance of 0.1 dex reduces the abundance of oxygen by 0.06 dex. This value is not sufficient to reconcile the oxygen derived from the two [OI] lines. When only O and Ni are included in the fit of the 630 nm line, the fit of the line profile gives A(O)=8.86 and 8.92 if A(Ni)=6.49 and 6.39, respectively.
According to a SYNTHE simulation, when an input ATLAS model is used, the Ni contribution to the complete EW of the 630 nm blend is large (48.6% in EW) and the CN contribution to the complete EW in the 636 nm line is also large, but smaller than Ni in the resonance line (29.0%).
4.10 Centauri B
We downloaded HARPS observations from the ESO archive. The stellar parameters (5223/4.44/+0.25) are from Porto de Mello et al. (2008). We used an ATLAS12 model computed with the parameters of the star. The two [OI] lines are in strong disagreement, but we think that it is not possible to derive A(O) from the 636 nm line. In fact, in this blend the major contribution is due to CN molecules, and by increasing A(O) the total EW is reduced. Also, the contribution of Ni in the blend is dominant; in fact, a decrease of A(Ni) by 0.1 dex introduces an increase in A(O) by 0.20 dex.
According to a SYNTHE simulation, when an input ATLAS model is used, the Ni contribution to the complete EW of the 630 nm blend is large (69.2% in EW) and the CN contribution to the complete EW in the 636 nm line is also large, but smaller than Ni in the resonance line (62.8%). For the subordinate line a change in A(O) changes the strengths of the lines of CN in the opposite direction.
4.11 Procyon
We also considered the spectrum of Procyon, retrieved from the UVES-POP database (Bagnulo et al., 2003) and adopted the parameters of 6500 K/4.0/0.0 from Steffen (1985). The 636 nm line implies a higher A(O) than the 630 nm line, but this line is very weak and the S/N of the spectrum does not permit a definite determination of A(O) from this line.
From Fig. 6 it is clear that by adopting A(Ni)=6.25 the oxygen abundance implied by the 630 nm line is at least 0.2 dex lower than the solar abundance; this low-oxygen abundance fails to reproduce the 636 nm line. This could indicate that the contribution of Ni i to the 630 nm line is, as in the Sun, overestimated. But it could also be that the same unidentified blend in the 636 nm line in the solar spectrum is present in Procyon.
5 Uncertainties
Our goal is the comparison of the oxygen abundance from the two [OI] lines. We think we can neglect any uncertainty of the oscillator strength of the oxygen lines because they come from the same source and we can expect the same effect on both lines. We will also neglect the uncertainties related to effective temperature and gravity. The two oxygen lines are similarly sensitive to changes in temperature and gravity, so any effect would not affect the difference of the oxygen abundance derived from these two lines. This is not true for their blends, Ni and the CN lines, which can have a different reaction to a change in and . But the stars we analyse are bright so that stellar parameters should be well known. The effect due to uncertainties on and on Ni are not large: a change in 100 K and 0.5 dex, respectively, results in a change of about 10% and 6% in the EW of Ni, respectively, in a model with parameters close to solar. The CN lines are not so sensitive to gravity (0.5 dex change produces a difference in the EW of about 7%), while their EW change by about a factor 2 for a change in temperature of 100 K.
We also neglect any uncertainty due to deviation from the assumed local thermal equilibrium (LTE) and to granulation effects (3D corrections). We know that the two levels involved in the [OI] transitions are close to LTE conditions. But this is not true for the lines blending the oxygen features. No study on NLTE is available on Ni transitions or on CN lines, but we do not expect this weak line to deviate strongly from LTE conditions. The 3D corrections were investigated in the solar case (Caffau et al., 2008), and we know from our experience that they are small for weak lines in models close to solar metallicity.
To synthesise the CN lines we used the line lists from Kurucz. We compared the synthesis with the one obtained by using the line lists kindly provided by Bertrand Plez. For the solar model we found a difference in EW of about 8% and 2% in the CN blending the 630 and 636 nm [OI] lines. For the latter, although the difference in EW is negligible, the shape of the CN lines is different.
5.1 [OI] 630 nm line
The uncertainty of the of the Ni blending component is 0.06 dex. The uncertainty of the Ni abundance depends on the star. Since the stars we are analysing are bright, we can expect an uncertainty of about 0.05 dex. Taking into account both the uncertainty of the and of the A(Ni), we can suppose an uncertainty of about 0.1 dex for the Ni line. This is translated into an uncertainty of about 0.07 dex in the oxygen abundance for Cen A and 0.11 dex for Cen B. For giants the effect of the Ni uncertainty on the A(O) determination is smaller (e.g. less than 0.02 dex for Arcturus and Pollux). The other blending lines usually have a smaller effect. For the giants, completely neglecting them gives a difference of about 0.03 dex in the A(O) determination. For a dwarf star ( Cen A) there is an increase in A(O) of 0.04 dex. The effect on Cen B is much larger, 0.09 dex. If taken into account in a cool dwarf, the weaker blends on the 630 nm line can introduce an uncertainty up to about 0.05 dex. The uncertainty on A(O) due to continuum placement is about 0.03 dex in dwarfs, while in giants the effect is small and can be neglected.
Considering an average value, the total uncertainty on the A(O) determination can be estimated to be about 0.10 dex for dwarf stars and about 0.04 dex for giant stars.
5.2 [OI] 636 nm line
Any uncertainty in the shape of the Ca i auto-ionisation line and the Ca abundance introduces an uncertainty of the A(O) abundance derived from the [OI] 636 nm line. This problem affects only dwarf stars; the Ca i auto-ionisation line is not visible in the spectra of giant stars. As stated in Sec. 4.1, an increase of the Ca abundance of 0.1 dex produces an increase of 0.02 dex of A(O). Since the [OI] line is weak and occupies only a small range on the wing of the Ca i auto-ionisation line, we do not think that the shape of this line can have a major effect on A(O).
Another effect is the uncertainty in wavelength and of the CN lines. An increase of 0.2 on the of the CN lines produces a decrease of 0.06 dex in the oxygen abundance in the solar case. We think that the Sun can be a representative general case; only Cen A and B have a larger contribution to the EW due to CN lines.
We tested the two CN line lists in the case of Pollux. The line list provided by B. Plez introduces an increase in A(O) of 0.07 dex. While in Cen A, the two line lists give a difference of less than 0.01 dex.
The abundances of C and N also affect the A(O) derived from the 636 nm line, but in different ways for hot and cool stars. An increase of 0.1 dex of A(C) and A(N), at fixed A(O), increases by about 4-6% the EW of the blend O+CN (CN contributes about 14%) in a the solar spectrum, while it slightly decreases (by about 2%) the EW of the blend O+CN (CN contributes of about 12%) in the spectrum of Arcturus. This decrease in the giant stars is related to the CO formation. These effects are anyway small.
The impact on the A(O) determination due to the continuum placement is about 0.03 dex. The total uncertainty of the A(O) determination can be estimated to be about 0.15 dex for dwarf stars and about 0.10 dex for giant ones.
6 Discussion and conclusions
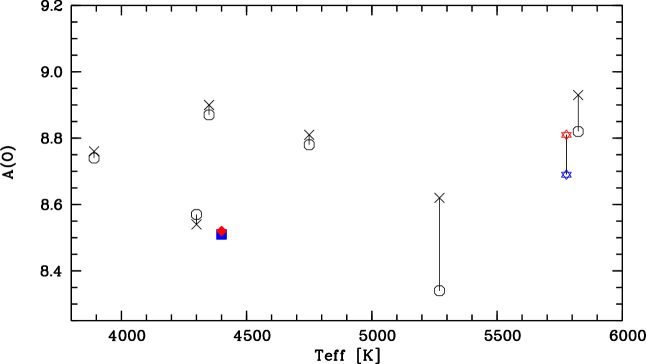
We compared the two forbidden oxygen lines in the Sun, five giants, one sub-giant, and four dwarfs. The results are summarised in Fig. 7. For the giants the oxygen abundance derived from the two lines agree within errors. For two dwarf stars we have no conclusive evidence: in Procyon the 636 nm line is too weak to provide a measurement, although the subordinate line definitely seems to be too strong in comparison to the other; the spectrum of HD 30562 is contaminated by a telluric absorption on the 630.0 nm line. For the sub-giant Capella and the two dwarfs ( Centauri A and B) the disagreement of the A(O) determination from the two [OI] lines is clear.
We verified that the strength of the CN lines is a function of the oxygen abundance: the larger A(O), the weaker are the CN lines lying in the range of the 636 nm [OI] line. This happens because the increase in the number of atoms of oxygen increases the CO formation at the expense of CN molecules. This effect is evident in giants and dwarfs, but it is larger in giants. Due to this effect, the blend of O+CN decreases in giants by increasing A(C) and A(N) at fixed oxygen abundance (4.6% and 2.4% decreases in the EW of the blend O+CN for an increase of A(C) and A(N) of 0.2 dex and 0.1 dex, respectively), while in dwarfs the increase in A(C) and A(N) results in a larger EW for the O+CN blend.
The reason for the discrepancy in the Sun that we previously favoured (Caffau et al., 2008) was that the CN molecules blending the subordinate line are poorly known. The idea was that the values underestimate the contribution of CN to the blend or some CN lines are completely missing, resulting in a too high estimated contribution from oxygen. This view is in disagreement with the use of the recent CN line compilation of Plez, which gives a smaller contribution of CN in the blend. We also verified in this work that for cold giant stars, where the contribution from CN molecules is not negligible, the two [OI] lines give consistent oxygen abundances. Since in the giant stars the Ni contribution to the EW of the O+Ni feature at 630 nm becomes smaller than the contribution of CN in the 636 nm line, we conclude that the CN components in the subordinate line are probably not responsible for the disagreement of the two lines in dwarfs.
Three possibilities are still in the game: i) the value of the Ni i line has an uncertainty larger that expected, ii) the shape of the Ca i auto-ionisation line influences the A(O) derived more than expected, iii) there is an unknown line in the vicinity of the 630 nm oxygen line, with atomic characteristics to be strong enough in the atmospheres of dwarf stars.
It is difficult to believe that the value of the Ni i line blending the 630 nm line is in error; the value is from Johansson et al. (2003), who did a very careful investigation and claim an uncertainty of 14%, which is not sufficient to solve the problem. But there is strong support in the sense that the is overestimated. The study of solar spectra at different limb angles supports a Ni about 0.1 dex lower.
We introduced a weak (=–2.974) Fe i line at 636.378 nm, of high-excitation energy ( eV) so that is negligible for a giant star, but it has a non-negligible contribution in a dwarf star. A line (at 636.4763 nm) with these parameters exists in the line list of Kurucz. The introduction of such line has no impact on the A(O) derived from the 636 nm line in Arcturus. For Pollux we see a decrease in A(O) of 0.02 dex, for Centauri A of about 0.07 dex, and for the Sun of 0.05 dex. An opportune high-excitation Fe i line is a possible explanation.
The profile of the Ca i auto-ionisation line is not properly modelled. Although synthetic spectra are not able to reproduce satisfactorily the Ca i auto-ionisation line, on whose red wing the 636 nm is formed, this cannot be the reason for the disagreement of the two lines among dwarf stars. A better modelling of the Ca i auto-ionisation line would result in larger A(O) abundances derived from the subordinate line.
Our results can be summarised as follows.
-
1.
In giants the two forbidden lines provide a consistent oxygen abundance to within 0.1 dex.
-
2.
CN blending in the subordinate line is minor and does not prevent an accurate A(O) determination from this line in giants.
-
3.
In dwarfs and sub-giants, A(O) derived from the two [OI] lines is not in agreement.
-
4.
The profile of the Ca i auto-ionisation line, visible in dwarfs and sub-giants, is not properly modelled by synthetic spectra.
-
5.
An increase in the strength of the Ca i auto-ionisation line by changing the calcium abundance improves the agreement between the observed solar profile and the synthetic spectrum in the range of the [OI] 636 nm line. However,it does not have a strong effect on the oxygen abundance. A better reproduction of the Ca i auto-ionisation line would provide even larger oxygen abundances from this line, thus increasing the discrepancy.
-
6.
An increase of 0.2 dex in the oscillator strengths of the CN lines is not sufficient to make the oxygen abundances from the two [OI] lines match.
-
7.
The use of an updated line list for the CN lines does not solve the problem.
This evidence strongly suggests that either the of the nickel line is smaller than measured by Johansson et al. (2003) or that an unknown blend at 636 nm affects the spectrum of dwarfs. All other possible explanations for the discrepancy are ruled out.
To make progress in the investigation of the two [OI] lines, major effort should be made to check for possible blends present only in dwarf star spectra and the on the Ni i line should be investigated again. A theoretical investigation towards a better reproduction of the Ca i auto-ionisation line is also highly desirable, although it cannot solve the discrepancy.
Acknowledgements.
Based on data obtained from the ESO Science Archive Facility. PB acknowledges support from the Programme National de Physique Stellaire (PNPS) and the Programme National de Cosmologie et Galaxies (PNCG) of the Institut National de Sciences de l’Univers of CNRS. EC and HGL acknowledge financial support by the Sonderforschungsbereich SFB881 “The Milky Way System” (subprojects A4 and A5) of the German Research Foundation (DFG).References
- Anders & Grevesse (1989) Anders, E., & Grevesse, N. 1989, Geochim. Cosmochim. Acta., 53, 197
- Arnaud et al. (1998) Arnaud, J., Mein, P., & Rayrole, J. 1998, Crossroads for European Solar and Heliospheric Physics. Recent Achievements and Future Mission Possibilities, 417, 213
- Asplund et al. (2004) Asplund, M., Grevesse, N., Sauval, A. J., Allende Prieto, C., & Kiselman, D. 2004, A&A, 417, 751
- Bagnulo et al. (2003) Bagnulo, S., Jehin, E., Ledoux, C., Cabanac, R., Melo, C., Gilmozzi, R., & The ESO Paranal Science Operations Team 2003, The Messenger, 114, 10
- Bonifacio & Caffau (2003) Bonifacio, P., & Caffau, E. 2003, A&A, 399, 1183
- Burris et al. (2000) Burris, D. L., Pilachowski, C. A., Armandroff, T. E., et al. 2000, ApJ, 544, 302
- Caffau et al. (2008) Caffau, E., Ludwig, H.-G., Steffen, M., Ayres, T. R., Bonifacio, P., Cayrel, R., Freytag, B., & Plez, B. 2008, A&A, 488, 1031
- Caffau et al. (2011a) Caffau, E., Ludwig, H.-G., Steffen, M., Freytag, B., & Bonifacio, P. 2011, Sol. Phys., 268, 255
- Dekker et al. (2000) Dekker, H., D’Odorico, S., Kaufer, A., Delabre, B., & Kotzlowski, H. 2000, Proc. SPIE, 4008, 534
- Delbouille et al. (1973) Delbouille, L., Roland, G., & Neven, L. 1973, Liege: Universite de Liege, Institut d’Astrophysique, 1973
- Feltzing & Gustafsson (1998) Feltzing, S., & Gustafsson, B. 1998, A&AS, 129, 237
- Freytag et al. (2002) Freytag, B., Steffen, M., & Dorch, B. 2002, Astronomische Nachrichten, 323, 213
- Freytag et al. (2012) Freytag, B., Steffen, M., Ludwig, H.-G., et al. 2012, Journal of Computational Physics, 231, 919
- Gratton & Ortolani (1986) Gratton, R. G., & Ortolani, S. 1986, A&A, 169, 201
- Grevesse & Sauval (1998) Grevesse, N., & Sauval, A. J. 1998, Space Science Reviews, 85, 161
- Johansson et al. (2003) Johansson, S., Litzén, U., Lundberg, H., & Zhang, Z. 2003, ApJ, 584, L107
- Kurucz (1993) Kurucz, R. 1993, SYNTHE Spectrum Synthesis Programs and Line Data. Kurucz CD-ROM No. 18. Cambridge, Mass.: Smithsonian Astrophysical Observatory, 1993., 18
- Kurucz (2005) Kurucz, R. L. 2005, Memorie della Società Astronomica Italiana Supplement, 8, 14
- Mallik (1998) Mallik, S. V. 1998, A&A, 338, 623
- Mayor et al. (2003) Mayor, M., Pepe, F., Queloz, D., et al. 2003, The Messenger, 114, 20
- McWilliam (1990) McWilliam, A. 1990, ApJS, 74, 1075
- Meléndez & Asplund (2008) Meléndez, J., & Asplund, M. 2008, A&A, 490, 817
- Meléndez et al. (2008) Meléndez, J., Asplund, M., Alves-Brito, A., et al. 2008, A&A, 484, L21
- Neckel & Labs (1984) Neckel, H., & Labs, D. 1984, Sol. Phys., 90, 205
- Pilachowski et al. (1996) Pilachowski, C. A., Sneden, C., & Kraft, R. P. 1996, AJ, 111, 1689
- Porto de Mello et al. (2008) Porto de Mello, G. F., Lyra, W., & Keller, G. R. 2008, A&A, 488, 653
- Sbordone (2005) Sbordone, L. 2005, Memorie della Società Astronomica Italiana Supplement, 8, 61
- Sbordone et al. (2004) Sbordone, L., Bonifacio, P., Castelli, F., & Kurucz, R. L. 2004, Memorie della Società Astronomica Italiana Supplementi, 5, 93
- Sbordone et al. (2004) Sbordone, L., Bonifacio, P., Castelli, F., & Kurucz, R. L. 2004, Memorie della Società Astronomica Italiana Supplement, 5, 93
- Stasińska et al. (2012) Stasińska, G., Prantzos, N., Meynet, G., et al. 2012, EAS Publications Series, 54, 65
- Steffen (1985) Steffen, M. 1985, A&AS, 59, 403
- Storey & Zeippen (2000) Storey, P. J., & Zeippen, C. J. 2000, MNRAS, 312, 813