Bulk Fermi surface and electronic properties of Cu0.07Bi2Se3
Abstract
The electronic properties of Cu0.07Bi2Se3 have been investigated using Shubnikov-de Haas and optical reflectance measurements. Quantum oscillations reveal a bulk, three-dimensional Fermi surface with anisotropy 2 and a modest increase in free-carrier concentration and in scattering rate with respect to the undoped Bi2Se3, also confirmed by reflectivity data. The effective mass is almost identical to that of Bi2Se3. Optical conductivity reveals a strong enhancement of the bound impurity bands with Cu addition, suggesting that a significant number of Cu atoms enter the interstitial sites between Bi and Se layers or may even substitute for Bi. This conclusion is also supported by X-ray diffraction measurements, where a significant increase of microstrain was found in Cu0.07Bi2Se3, compared to Bi2Se3.
pacs:
74.25.Ha, 74.78.-w, 78.20.-e, 78.30.-jTopological insulators (TI) have attracted considerable attention for the past several years, as the surface states, with Dirac band dispersion and protected by time-reversal symmetry, may be explored for spin-related applicationsHasan10 . Bi2Se3 represents a particular example of the topological insulator, where the Dirac states emerge at the surface of a three-dimensional bulk band structureXia09 . Moreover, the Cu-doped material, CuxBi2Se3, is superconducting for , with maximum KHor10 , opening the possibility for exploring other novel phenomena, like magnetic monopole and Majorana fermionsQi11 ; Sasaki11 .
It is important to understand the effect of Cu addition on the electronic structure, and further, if possible, on the origin of superconductivity in CuxBi2Se3. A combined tunneling and photoemission studyWang11 found at least three different ways in which Cu atoms enter into the crystal structure of Bi2Se3: they can be adsorbed on the Se surface, occupy interstitial sites between the Bi and Se planes, or they can intercalate into the van der Waals gaps between the quintuple layered Se-Bi-Se-Bi-Se. While the adsorbed Cu is expected to affect only the surface properties, both the interstitial and intercalated atoms were found to act as donors, thus adding conduction electrons into the bulk. Moreover, there is also the possibility that Cu substitutes for Bi, in which case it acts as an acceptor, i.e. a hole dopant. Therefore, the bulk carrier concentration is expected to vary nonlinearly with in CuxBi2Se3. This behavior has been confirmed by angle resolved photoemission spectroscopy (ARPES) Wray10 ; Wray11 .
In nominally undoped crystals of Bi2Se3, varies over several orders of magnitude, from cm-3 to cm-3. With Cu addition, superconductivity seems to appear when cm-3. Heat capacity measurementsKriener11 on superconducting CuxBi2Se3, with and cm-3, found a manyfold enhancement of the electron effective mass, with , compared to undoped Bi2Se3, where Butch10 ; Analytis10 . However, a much less significant increase, , was observed from quantum oscillations for similar doping level, and cm-3 Lawson12 . In both Ref. Kriener11 and Ref. Lawson12 . the critical temperature was very similar K, underlying the complex nature of doping in Bi2Se3.
Here we present a study of X-ray diffraction, elemental analysis, quantum oscillations and optical spectroscopy of CuxBi2Se3 with , just below the threshold for superconductivity. We focus on the effect of Cu addition on the band structure and transport properties; these may be relevant to the emergence of superconductivity.
Single crystals of Cu0.07Bi2Se3 were grown from high purity Bi, Se and Cu elements by the Bridgman technique. For comparison, single crystals of undoped Bi2Se3 were also synthesized under the same conditions and used in the present study. Optical reflectance measurements, using a Bruker 113v spectrometer, were performed on two samples of Cu0.07Bi2Se3 and one of Bi2Se3. The crystals had approximate dimensions 640.150 mm3,. The results on the Cu doped samples were nearly identical and one was further used for Shubnikov-de Haas oscillations and the other, together with the Bi2Se3 sample, were investigated by X-ray diffraction (XRD) and energy dispersive X-ray analysis (EDX). Longitudinal and Hall resistance were measured in the SCM-2 facility at the National High Magnetic Field in Tallahassee. The facility consists of a top loading 3He cryostat, with sample in liquid and a base temperature of 0.3 K in conjunction with an 18-20 Tesla superconducting magnet. A rotation probe with an angular resolution better than 1∘ was used for angle dependent measurements. Electrical contact was made by attaching gold wires with silver paint. XRD data was taken using a Panalytical X’Pert MRD diffractometer and for EDX a Philips XL40 FEG-SEM was used.
.
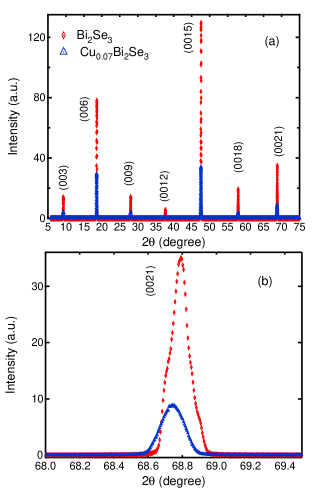
The stoichiometry of samples and the presence of Cu were confirmed by EDX analysis. For a 7% nominal Cu composition, EDX data on CuxBi2Se3 yields , consistent within error with the nominal value. Figure 1(a) shows the X-ray diffraction of single crystals of Cu0.07Bi2Se3 and Bi2Se3. Only sharp reflections from the planes, with no additional signal from other phases are visible. A slight increase with Cu doping was observed in the -axis, from Å to Å. Line profile analysis reveals significant broadening and distortion of the diffraction peaks with Cu doping, indicating the presence of defects and/or microstrains. An example of the peak is shown in Fig. 1(b). The FWHM of Bi2Se3 is , whereas in the Cu0.07Bi2Se3 it is , almost 40% larger. From Williamson-Hall plots we found that in Cu0.07Bi2Se3 the crystallite size decreases from 94 nm to 79 nm and the microstrain increases significantly, from 0.003% to 0.010%. The very small change in -axis lattice constant and the defects and strain found in Cu0.07Bi2Se3 suggest that a significant amount of Cu must enter interstitially or substitute for Bi, rather then in the van der Waals gaps. This conclusion will be supported by our further experimental findings.
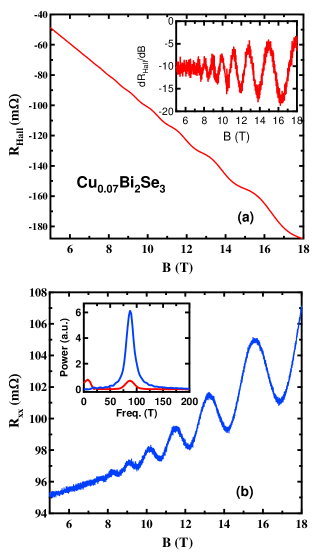
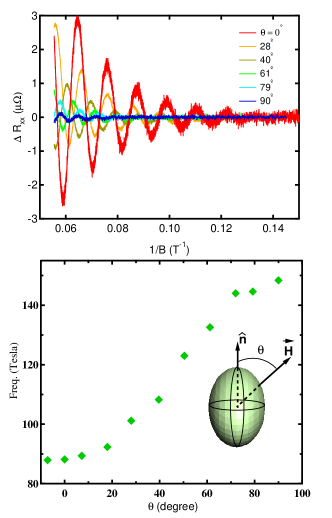
Figure 2 shows the high magnetic field Hall resistance (Fig. 2(a)) and longitudinal resistance (Fig. 2(b)) at K, with the magnetic field applied along the crystallographic -axis. Clear oscillations can be observed in both traces. Although their amplitude is much smaller in the Hall signal, they appear very clearly in the inset of Fig. 2(a), where we plot . Fourier transform (FFT) of and yields Tesla (inset of Fig. 2(b)). We rotated the sample in the magnetic field and observed oscillations for all orientations. Figure 3(a) shows the oscillations at several angles, indicating the 3-D nature of the Fermi surface. The angular dependence of the frequency is plotted in Fig. 3(b). The frequency when is Tesla. Assuming an ellipsoidal Fermi pocket, the corresponding momenta are nm-1 in the -plane and nm-1 along the -axis, respectively. The anisotropy is , slightly larger than previous values of –1.6 obtained for Bi2Se3 Butch10 ; Analytis10 , making unlikely that anisotropy plays an important role in superconductivity. Moreover, anisotropy was found to decrease slightly for 25% Cu dopingLawson12 . These results are rather relevant for the non-monotonic effect of Cu addition on the band structure of Bi2Se3. The carrier concentration is cm-3, almost identical to the value we obtained from Hall coefficient. It is important to mention that larger carrier concentrations, up to about 2–3 1019 cm-3 were reported in recent studies of undoped Bi2Se3Analytis10 ; Lawson12 and that the superconducting samples of CuxBi2Se3 seem to have cm-3. Therefore, it is possible that there is a threshold carrier concentration required for superconductivity.
Another important parameter is the carrier effective mass, given in particular the large value reported in Ref. Kriener11 for . Figure 4(a) displays the oscillatory part (after second order polynomial background subtraction) of versus inverse magnetic field at different temperatures. Clear oscillations can be observed up to at least T=20K and in Fig. 4(b), the amplitude of the FFT with temperature is fitted to the Lifshitz-Kosevich function: , with , where is the magnetic field, is the effective mass, and the rest mass of the electronShoenberg84 . The same analysis was also performed on the Hall resistance data and we obtain an average effective mass . Surprisingly, this value is nearly identical to those previously obtained on the undoped Bi2Se3Butch10 ; Analytis10 . Nevertheless, our result for 7% Cu doping seems to be in line with a recent report, where a very small enhancement () was reported for the superconducting samples with , three times as much Cu as in our samplesLawson12 . Therefore, while a large increase of may occur with Cu doping in some cases, it does not appear to be a general trend.
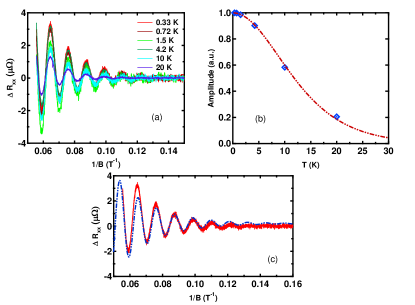
From the field dependence of SdH oscillations we extract the scattering rate. The amplitude of oscillations increases with magnetic field as , where was defined earlier and is the Dingle temperature, related to the lifetime of the electronsShoenberg84 . From the fit to the expression above for -axis, shown in Fig. 4(c), we extract K and hence, the scattering time s (or rate cm-1). Our result for the Dingle temperature is larger than previous reports of = 4–24 KButch10 ; Analytis10 ; Lawson12 , reflecting probably the microstrain and the distortion observed in the X-ray data. We note that in a recent study,Kriener12 superconducting samples with large volume fraction and higher transition temperatues had mean free paths in the range of –40 nm. We calculate for our sample that nm. Therefore, the mean free path in our non-superconducting samples is of the same order as those that are superconducting.
We also studied the effect of Cu substitution in Bi2Se3 using optical reflectance measurements. Fig. 5 compares the room temperature optical reflectance for undoped Bi2Se3 and Cu0.07Bi2Se3. It can be clearly observed that the free-carrier plasma edge occurs at higher frequency in the Cu0.07Bi2Se3 sample. Considering that we found that the effective mass in both samples is very similar, this is consistent with an increase in free-carrier concentration as discussed below. We also notice that the strong phonon mode near 60 cm-1 is almost completely suppressed with Cu addition, whereas the one near 130 cm-1, barely observable in Bi2Se3 at room temperature, appears enhanced in Cu0.07Bi2Se3. The vibrational modes in Bi-based topological insulators have been studied in detail elsewhereRichter77 ; LaForge10 ; Pietro12 ; here, we restrict our discussion to the effect of Cu on the electronic structure.
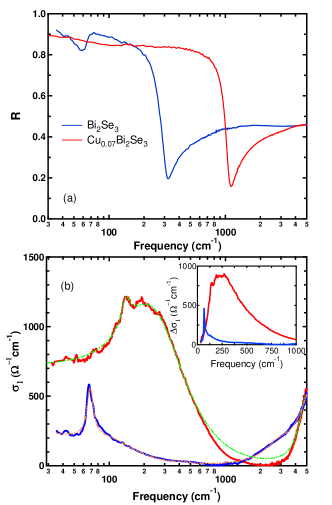
Figure 5(a) shows the real part of the optical conductivity obtained after Kramers-Kronig transformation of Wooten72 . One can easily notice the remarkable increase in the far-infrared spectral weight with Cu addition, but we will show shortly that this is not solely from a free-carrier (Drude) contribution. From fit to a Lorentz-Drude model, we found that the Drude plasma frequency increases from cm-1 in Bi2Se3 to 2100 cm-1 in Cu0.07Bi2Se3. The scattering rate was also found to increase, from cm-1 to 100 cm-1, respectively. Considering the effective mass determined from SdH oscillations, the free carrier concentration obtained from optical conductivity is cm-3 in Bi2Se3 and 71018cm-3 in Cu0.07Bi2Se3. The latter value is in fair agreement with that obtained above from SdH oscillations and would imply that Cu addition gives a fourfold enhancement in carrier concentration. However, this is much less than the possible variations that may result from stoichiometric variations occurring in the crystal growth process.
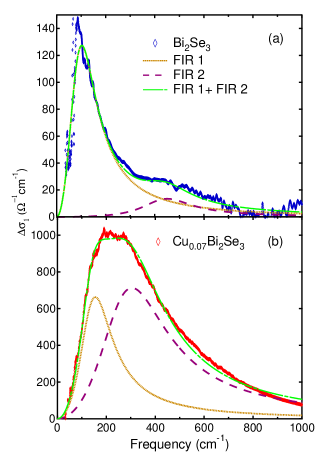
To emphasize that there is another strong effect of Cu doping in addition to the increased free carrier concentration, we plot in Fig. 5 the remaining optical conductivity obtained after subtracting the Drude and the sharp phonon contributions. The data are similar to a very recent study on several Bi-based TIsPietro12 , and we describe it the same way, in terms of two absorption bands: a low frequency FIR1, centered around 150 cm-1, and a higher frequency one, FIR2 ( 400 cm-1). As was pointed out in Ref. Pietro12 , they resemble the phosphorous (P) doped silicon (Si), where P impurities give rise to bound states, with the outer electrons in a hydrogen-like potentialThomas81 . The low frequency band, FIR1 in our case, would then correspond to hydrogen-like transitions and the higher frequency (FIR2) to impurity ionization, i.e. transition from the bound states to the continuum (conduction) band. What is striking in our Cu doped sample (Fig. 5(b)) is that the amplitude of the FIR2 peak is several times larger than that observed in any of the previous Bi-based TIsPietro12 , reflecting a large concentration of bound electrons. From energy considerations, it is expected that the bound states are created by Cu atoms that enter interstitially, within the Bi-Se ionic bond, or even by Cu atoms substituting for Bi in the crystal structure. Localization of electrons from the Cu atoms intercalated into the van der Waals gaps between the quintuple layers would imply strong Coulomb repulsion and hence, possible magnetic order of Cu ions and enhancement of the effective mass due to electron-electron correlation. We have seen however from SdH oscillations that there is no change in and no magnetic correlations were ever reported in CuxBi2Se3. Therefore, we interpret the strong impurity bands seen in Fig. 5(b) as arising from a large amount of Cu occupying interstitial sites between the Bi and Se layers, or even substituting for Bi atoms, just as we concluded from the X-ray analysis.
In conclusion, we performed combined measurements of X-ray diffraction, quantum oscillations, and optical spectroscopy on Cu0.07Bi2Se3. Quantum oscillations reveal a bulk, 3-D Fermi surface, with the following properties: carrier concentration cm-3, about four times larger than that of the undoped Bi2Se3; effective mass unchanged with doping and a larger scattering rate than in Bi2Se3. Given that only a slight increase of was observed in the superconducting samples with 25% CuLawson12 , we suggest that the most important parameter for triggering superconductivity is the carrier concentration. In our samples this is significantly lower than the value of cm-3 measured for superconducting samples. Optical conductivity shows that, besides free carriers, Cu also gives rise to a remarkably strong hydrogen-like impurity bound state. Therefore, a significant amount of Cu must enter the interstitial space between the Bi and Se layers or even substitute for Bi, a fact also confirmed by the X-ray data. For further understanding, it would be useful to do an comparative optical study of the bound states between superconducting and non-superconducting samples of CuxBi2Se3.
Portions of this work were supported by the U.S. Department of Energy through contract No. DE-FG02-02ER45984 at the University of Florida and by the National Science Foundation grant DMR 1005301. The work of V. Craciun was funded by CNCSIS Ideas Project code 337. A portion was performed at the National High Magnetic Field Laboratory, which is supported by National Science Foundation Cooperative Agreement No. DMR-0654118, the State of Florida, and the U.S. Department of Energy. We would like to thank Ju-Hyun Park, Glover Jones, and Timothy Murphy for support with the experiment at the National High Magnetic Field Laboratory.
References
- (1) M. Z. Hasan and C. L. Kane, Rev. Mod. Phys. 82, 3045 (2010).
- (2) Y. Xia, D. Qian, D. Hsieh, L. Wray, A. Pal, H. Lin, A. Bansil, D. Grauer, Y. S. Hor, R. J. Cava and M. Z. Hasan, Nature Phys. 5, 398 (2009).
- (3) Y. S. Hor, A. J. Williams, J. G. Checkelsky, P. Roushan, J. Seo, Q. Xu, H. W. Zandbergen, A. Yazdani, N. P. Ong, and R. J. Cava, Phys. Rev. Lett. 104, 057001 (2010).
- (4) X. L. Qi and S. C. Zhang , Rev. Mod. Phys. 83, 1057 (2011).
- (5) S. Sasaki, M. Kriener, K. Segawa, K. Yada, Y. Tanaka, M. Sato, and Y. Ando, Phys. Rev. Lett. 107, 217001 (2011).
- (6) Yi-Lin Wang, Yong Xu, Ye-Ping Jiang, Jun-Wei Liu, Cui-Zu Chang, Mu Chen, Zhi Li, Can-Li Song, Li-Li Wang, Ke He, Xi Chen, Wen-Hui Duan, Qi-Kun Xue, and Xu-Cun Ma , Phys. Rev. B 84, 075335 (2011).
- (7) L. A. Wray, S.-Y. Xu, Y. Xia, Y. S. Hor, D. Qian, A. V. Fedorov, H. Lin, A. Bansil, R. J. Cava, and M. Z. Hasan, Nature Phys., 6, 855 (2010).
- (8) L. Andrew Wray, Suyang Xu, Yuqi Xia, Dong Qian, Alexei V. Fedorov, Hsin Lin, Arun Bansil, Liang Fu, Yew San Hor, Robert J. Cava, and M. Zahid Hasan , Phys. Rev. B 83, 224516 (2011).
- (9) M. Kriener, K. Segawa, Z. Ren, S. Sasaki, and Y. Ando, Phys. Rev. Lett. 106, 127004 (2011).
- (10) N. P. Butch, K. Kirshenbaum, P. Syers, A. B. Sushkov, G. S. Jenkins, H. D. Drew, and J. Paglione, Phys. Rev. B 81, 241301(R) (2010).
- (11) James G. Analytis, Jiun-Haw Chu, Yulin Chen, Felipe Corredor, Ross D. McDonald, Z. X. Shen, and Ian R. Fisher, Phys. Rev. B 81, 205407 (2010).
- (12) B. J. Lawson, Y. S. Hor, L. Li, arxiv:1207.0267 (2012) (unpublished)
- (13) D. Shoenberg, Magnetic Oscillations in Metals (Cambridge University Press, Cambridge, 1984).
- (14) M. Kriener, Kouji Segawa, Satoshi Sasaki, and Yoichi Ando, Phys. Rev. B 86, 180505(R) (2012).
- (15) A. D. LaForge, A. Frenzel, B. C. Pursley, Tao Lin, Xinfei Liu, Jing Shi, and D. N. Basov, Phys. Rev. B 81, 125120 (2010).
- (16) P. Di Pietro, F. M. Vitucci, D. Nicoletti, L. Baldassarre, P. Calvani, R. Cava, Y. S. Hor, U. Schade, and S. Lupi, Phys. Rev. B 86, 045439 (2012).
- (17) W. Richter and C. R. Becker, Phys. Status Solidi B. 84, 619 (1977).
- (18) F. Wooten, Optical Properties of Solids (Academic Press, Inc., 1972).
- (19) G. A. Thomas, M. Capizzi, F. DeRosa, R. N. Bhatt, and T. M. Rice, Phys. Rev. B 23, 5472 (1981).