Bounds on the density of sources
of ultra-high energy cosmic rays
from the Pierre Auger Observatory
Abstract
We derive lower bounds on the density of sources of ultra-high energy cosmic rays from the lack of significant clustering in the arrival directions of the highest energy events detected at the Pierre Auger Observatory. The density of uniformly distributed sources of equal intrinsic intensity was found to be larger than Mpc-3 at 95% CL, depending on the magnitude of the magnetic deflections. Similar bounds, in the range Mpc-3, were obtained for sources following the local matter distribution.
The Pierre Auger Collaboration
P. Abreu61,
M. Aglietta49,
M. Ahlers91,
E.J. Ahn79,
I.F.M. Albuquerque15,
I. Allekotte1,
J. Allen83,
P. Allison85,
A. Almela11, 7,
J. Alvarez Castillo54,
J. Alvarez-Muñiz71,
R. Alves Batista16,
M. Ambrosio43,
A. Aminaei55,
L. Anchordoqui92,
S. Andringa61,
T. Antiči’c22,
C. Aramo43,
F. Arqueros68,
H. Asorey1,
P. Assis61,
J. Aublin28,
M. Ave71,
M. Avenier29,
G. Avila10,
A.M. Badescu64,
K.B. Barber12,
A.F. Barbosa,
R. Bardenet27,
B. Baughman,
J. Bäuml33,
C. Baus35,
J.J. Beatty85,
K.H. Becker32,
A. Bellétoile31,
J.A. Bellido12,
S. BenZvi91,
C. Berat29,
X. Bertou1,
P.L. Biermann36,
P. Billoir28,
F. Blanco68,
M. Blanco28, 69,
C. Bleve32,
H. Blümer35, 33,
M. Boháčová24,
D. Boncioli44,
C. Bonifazi20,
R. Bonino49,
N. Borodai59,
J. Brack77,
I. Brancus62,
P. Brogueira61,
W.C. Brown78,
P. Buchholz39,
A. Bueno70,
L. Buroker92,
R.E. Burton75,
M. Buscemi43,
K.S. Caballero-Mora71, 86,
B. Caccianiga42,
L. Caramete36,
R. Caruso45,
A. Castellina49,
G. Cataldi47,
L. Cazon61,
R. Cester46,
J. Chauvin29,
S.H. Cheng86,
A. Chiavassa49,
J.A. Chinellato16,
J. Chirinos Diaz82,
J. Chudoba24,
M. Cilmo43,
R.W. Clay12,
G. Cocciolo47,
R. Colalillo43,
L. Collica42,
M.R. Coluccia47,
R. Conceição61,
F. Contreras9,
H. Cook73,
M.J. Cooper12,
J. Coppens55, 57,
S. Coutu86,
C.E. Covault75,
A. Criss86,
J. Cronin87,
A. Curutiu36,
R. Dallier31, 30,
B. Daniel16,
S. Dasso5, 3,
K. Daumiller33,
B.R. Dawson12,
R.M. de Almeida21,
M. De Domenico45,
C. De Donato54,
S.J. de Jong55, 57,
G. De La Vega8,
W.J.M. de Mello Junior16,
J.R.T. de Mello Neto20,
I. De Mitri47,
V. de Souza14,
K.D. de Vries56,
L. del Peral69,
O. Deligny26,
H. Dembinski33,
N. Dhital82,
C. Di Giulio44,
M.L. Díaz Castro13,
P.N. Diep93,
F. Diogo61,
C. Dobrigkeit 16,
W. Docters56,
J.C. D’Olivo54,
P.N. Dong93, 26,
A. Dorofeev77,
J.C. dos Anjos13,
M.T. Dova4,
D. D’Urso43,
J. Ebr24,
R. Engel33,
M. Erdmann37,
C.O. Escobar79, 16,
J. Espadanal61,
A. Etchegoyen7, 11,
P. Facal San Luis87,
H. Falcke55, 58, 57,
K. Fang87,
G. Farrar83,
A.C. Fauth16,
N. Fazzini79,
A.P. Ferguson75,
B. Fick82,
J.M. Figueira7,
A. Filevich7,
A. Filipčič65, 66,
S. Fliescher37,
B. Fox88,
C.E. Fracchiolla77,
E.D. Fraenkel56,
O. Fratu64,
U. Fröhlich39,
B. Fuchs35,
R. Gaior28,
R.F. Gamarra7,
S. Gambetta40,
B. García8,
S.T. Garcia Roca71,
D. Garcia-Gamez27,
D. Garcia-Pinto68,
G. Garilli45,
A. Gascon Bravo70,
H. Gemmeke34,
P.L. Ghia28,
M. Giller60,
J. Gitto8,
H. Glass79,
M.S. Gold90,
G. Golup1,
F. Gomez Albarracin4,
M. Gómez Berisso1,
P.F. Gómez Vitale10,
P. Gonçalves61,
J.G. Gonzalez35,
B. Gookin77,
A. Gorgi49,
P. Gorham88,
P. Gouffon15,
E. Grashorn85,
S. Grebe55, 57,
N. Griffith85,
A.F. Grillo50,
Y. Guardincerri3,
F. Guarino43,
G.P. Guedes17,
P. Hansen4,
D. Harari1,
T.A. Harrison12,
J.L. Harton77,
A. Haungs33,
T. Hebbeker37,
D. Heck33,
A.E. Herve12,
G.C. Hill12,
C. Hojvat79,
N. Hollon87,
V.C. Holmes12,
P. Homola59,
J.R. Hörandel55, 57,
P. Horvath25,
M. Hrabovský25, 24,
D. Huber35,
T. Huege33,
A. Insolia45,
F. Ionita87,
S. Jansen55, 57,
C. Jarne4,
S. Jiraskova55,
M. Josebachuili7,
K. Kadija22,
K.H. Kampert32,
P. Karhan23,
P. Kasper79,
I. Katkov35,
B. Kégl27,
B. Keilhauer33,
A. Keivani81,
J.L. Kelley55,
E. Kemp16,
R.M. Kieckhafer82,
H.O. Klages33,
M. Kleifges34,
J. Kleinfeller9, 33,
J. Knapp73,
D.-H. Koang29,
K. Kotera87,
N. Krohm32,
O. Krömer34,
D. Kruppke-Hansen32,
D. Kuempel37, 39,
J.K. Kulbartz38,
N. Kunka34,
G. La Rosa48,
D. LaHurd75,
L. Latronico49,
R. Lauer90,
M. Lauscher37,
P. Lautridou31,
S. Le Coz29,
M.S.A.B. Leão19,
D. Lebrun29,
P. Lebrun79,
M.A. Leigui de Oliveira19,
A. Letessier-Selvon28,
I. Lhenry-Yvon26,
K. Link35,
R. López51,
A. Lopez Agüera71,
K. Louedec29, 27,
J. Lozano Bahilo70,
L. Lu73,
A. Lucero7,
M. Ludwig35,
H. Lyberis20, 26,
M.C. Maccarone48,
C. Macolino28,
M. Malacari12,
S. Maldera49,
J. Maller31,
D. Mandat24,
P. Mantsch79,
A.G. Mariazzi4,
J. Marin9, 49,
V. Marin31,
I.C. Maris28,
H.R. Marquez Falcon53,
G. Marsella47,
D. Martello47,
L. Martin31, 30,
H. Martinez52,
O. Martínez Bravo51,
D. Martraire26,
J.J. Masías Meza3,
H.J. Mathes33,
J. Matthews81,
J.A.J. Matthews90,
G. Matthiae44,
D. Maurel33,
D. Maurizio13, 46,
E. Mayotte76,
P.O. Mazur79,
G. Medina-Tanco54,
M. Melissas35,
D. Melo7,
E. Menichetti46,
A. Menshikov34,
P. Mertsch72,
S. Messina56,
C. Meurer37,
R. Meyhandan88,
S. Mi’canovi’c22,
M.I. Micheletti6,
I.A. Minaya68,
L. Miramonti42,
B. Mitrica62,
L. Molina-Bueno70,
S. Mollerach1,
M. Monasor87,
D. Monnier Ragaigne27,
F. Montanet29,
B. Morales54,
C. Morello49,
J.C. Moreno4,
M. Mostafá77,
C.A. Moura19,
M.A. Muller16,
G. Müller37,
M. Münchmeyer28,
R. Mussa46,
G. Navarra,
J.L. Navarro70,
S. Navas70,
P. Necesal24,
L. Nellen54,
A. Nelles55, 57,
J. Neuser32,
P.T. Nhung93,
M. Niechciol39,
L. Niemietz32,
N. Nierstenhoefer32,
T. Niggemann37,
D. Nitz82,
D. Nosek23,
L. Nožka24,
J. Oehlschläger33,
A. Olinto87,
M. Oliveira61,
M. Ortiz68,
N. Pacheco69,
D. Pakk Selmi-Dei16,
M. Palatka24,
J. Pallotta2,
N. Palmieri35,
G. Parente71,
A. Parra71,
S. Pastor67,
T. Paul92, 84,
M. Pech24,
J. Pȩkala59,
R. Pelayo51, 71,
I.M. Pepe18,
L. Perrone47,
R. Pesce40,
E. Petermann89,
S. Petrera41,
A. Petrolini40,
Y. Petrov77,
C. Pfendner91,
R. Piegaia3,
T. Pierog33,
P. Pieroni3,
M. Pimenta61,
V. Pirronello45,
M. Platino7,
M. Plum37,
V.H. Ponce1,
M. Pontz39,
A. Porcelli33,
P. Privitera87,
M. Prouza24,
E.J. Quel2,
S. Querchfeld32,
J. Rautenberg32,
O. Ravel31,
D. Ravignani7,
B. Revenu31,
J. Ridky24,
S. Riggi48, 71,
M. Risse39,
P. Ristori2,
H. Rivera42,
V. Rizi41,
J. Roberts83,
W. Rodrigues de Carvalho71,
I. Rodriguez Cabo71,
G. Rodriguez Fernandez44, 71,
J. Rodriguez Martino9,
J. Rodriguez Rojo9,
M.D. Rodríguez-Frías69,
G. Ros69,
J. Rosado68,
T. Rossler25,
M. Roth33,
B. Rouillé-d’Orfeuil87,
E. Roulet1,
A.C. Rovero5,
C. Rühle34,
S.J. Saffi12,
A. Saftoiu62,
F. Salamida26,
H. Salazar51,
F. Salesa Greus77,
G. Salina44,
F. Sánchez7,
C.E. Santo61,
E. Santos61,
E.M. Santos20,
F. Sarazin76,
B. Sarkar32,
S. Sarkar72,
R. Sato9,
N. Scharf37,
V. Scherini42,
H. Schieler33,
P. Schiffer38,
A. Schmidt34,
O. Scholten56,
H. Schoorlemmer55, 57,
J. Schovancova24,
P. Schovánek24,
F. Schröder33,
J. Schulz55,
D. Schuster76,
S.J. Sciutto4,
M. Scuderi45,
A. Segreto48,
M. Settimo39,
A. Shadkam81,
R.C. Shellard13,
I. Sidelnik1,
G. Sigl38,
H.H. Silva Lopez54,
O. Sima63,
A. ’Smiałkowski60,
R. Šmída33,
G.R. Snow89,
P. Sommers86,
J. Sorokin12,
H. Spinka74, 79,
R. Squartini9,
Y.N. Srivastava84,
S. Stanic66,
J. Stapleton85,
J. Stasielak59,
M. Stephan37,
M. Straub37,
A. Stutz29,
F. Suarez7,
T. Suomijärvi26,
A.D. Supanitsky5,
T. Šuša22,
M.S. Sutherland81,
J. Swain84,
Z. Szadkowski60,
M. Szuba33,
A. Tapia7,
M. Tartare29,
O. Taşcău32,
R. Tcaciuc39,
N.T. Thao93,
D. Thomas77,
J. Tiffenberg3,
C. Timmermans57, 55,
W. Tkaczyk,
C.J. Todero Peixoto14,
G. Toma62,
L. Tomankova24,
B. Tomé61,
A. Tonachini46,
G. Torralba Elipe71,
D. Torres Machado31,
P. Travnicek24,
D.B. Tridapalli15,
E. Trovato45,
M. Tueros71,
R. Ulrich33,
M. Unger33,
M. Urban27,
J.F. Valdés Galicia54,
I. Valiño71,
L. Valore43,
G. van Aar55,
A.M. van den Berg56,
S. van Velzen55,
A. van Vliet38,
E. Varela51,
B. Vargas Cárdenas54,
G. Varner88,
J.R. Vázquez68,
R.A. Vázquez71,
D. Veberič66, 65,
V. Verzi44,
J. Vicha24,
M. Videla8,
L. Villaseñor53,
H. Wahlberg4,
P. Wahrlich12,
O. Wainberg7, 11,
D. Walz37,
A.A. Watson73,
M. Weber34,
K. Weidenhaupt37,
A. Weindl33,
F. Werner33,
S. Westerhoff91,
B.J. Whelan86,
A. Widom84,
G. Wieczorek60,
L. Wiencke76,
B. Wilczyńska,
H. Wilczyński59,
M. Will33,
C. Williams87,
T. Winchen37,
M. Wommer33,
B. Wundheiler7,
T. Yamamoto,
T. Yapici82,
P. Younk80, 39,
G. Yuan81,
A. Yushkov71,
B. Zamorano Garcia70,
E. Zas71,
D. Zavrtanik66, 65,
M. Zavrtanik65, 66,
I. Zaw,
A. Zepeda,
J. Zhou87,
Y. Zhu34,
M. Zimbres Silva32, 16,
M. Ziolkowski39
1 Centro Atómico Bariloche and Instituto Balseiro (CNEA-UNCuyo-CONICET), San
Carlos de Bariloche,
Argentina
2 Centro de Investigaciones en Láseres y Aplicaciones, CITEDEF and CONICET,
Argentina
3 Departamento de Física, FCEyN, Universidad de Buenos Aires y CONICET,
Argentina
4 IFLP, Universidad Nacional de La Plata and CONICET, La Plata,
Argentina
5 Instituto de Astronomía y Física del Espacio (CONICET-UBA), Buenos Aires,
Argentina
6 Instituto de Física de Rosario (IFIR) - CONICET/U.N.R. and Facultad de Ciencias
Bioquímicas y Farmacéuticas U.N.R., Rosario,
Argentina
7 Instituto de Tecnologías en Detección y Astropartículas (CNEA, CONICET, UNSAM),
Buenos Aires,
Argentina
8 National Technological University, Faculty Mendoza (CONICET/CNEA), Mendoza,
Argentina
9 Observatorio Pierre Auger, Malargüe,
Argentina
10 Observatorio Pierre Auger and Comisión Nacional de Energía Atómica, Malargüe,
Argentina
11 Universidad Tecnológica Nacional - Facultad Regional Buenos Aires, Buenos Aires,
Argentina
12 University of Adelaide, Adelaide, S.A.,
Australia
13 Centro Brasileiro de Pesquisas Fisicas, Rio de Janeiro, RJ,
Brazil
14 Universidade de São Paulo, Instituto de Física, São Carlos, SP,
Brazil
15 Universidade de São Paulo, Instituto de Física, São Paulo, SP,
Brazil
16 Universidade Estadual de Campinas, IFGW, Campinas, SP,
Brazil
17 Universidade Estadual de Feira de Santana,
Brazil
18 Universidade Federal da Bahia, Salvador, BA,
Brazil
19 Universidade Federal do ABC, Santo André, SP,
Brazil
20 Universidade Federal do Rio de Janeiro, Instituto de Física, Rio de Janeiro, RJ,
Brazil
21 Universidade Federal Fluminense, EEIMVR, Volta Redonda, RJ,
Brazil
22 Rudjer Boškovi’c Institute, 10000 Zagreb,
Croatia
23 Charles University, Faculty of Mathematics and Physics, Institute of Particle and
Nuclear Physics, Prague,
Czech Republic
24 Institute of Physics of the Academy of Sciences of the Czech Republic, Prague,
Czech Republic
25 Palacky University, RCPTM, Olomouc,
Czech Republic
26 Institut de Physique Nucléaire d’Orsay (IPNO), Université Paris 11, CNRS-IN2P3,
Orsay,
France
27 Laboratoire de l’Accélérateur Linéaire (LAL), Université Paris 11, CNRS-IN2P3,
France
28 Laboratoire de Physique Nucléaire et de Hautes Energies (LPNHE), Universités
Paris 6 et Paris 7, CNRS-IN2P3, Paris,
France
29 Laboratoire de Physique Subatomique et de Cosmologie (LPSC), Université Joseph
Fourier Grenoble, CNRS-IN2P3, Grenoble INP,
France
30 Station de Radioastronomie de Nançay, Observatoire de Paris, CNRS/INSU,
France
31 SUBATECH, École des Mines de Nantes, CNRS-IN2P3, Université de Nantes,
France
32 Bergische Universität Wuppertal, Wuppertal,
Germany
33 Karlsruhe Institute of Technology - Campus North - Institut für Kernphysik, Karlsruhe,
Germany
34 Karlsruhe Institute of Technology - Campus North - Institut für
Prozessdatenverarbeitung und Elektronik, Karlsruhe,
Germany
35 Karlsruhe Institute of Technology - Campus South - Institut für Experimentelle
Kernphysik (IEKP), Karlsruhe,
Germany
36 Max-Planck-Institut für Radioastronomie, Bonn,
Germany
37 RWTH Aachen University, III. Physikalisches Institut A, Aachen,
Germany
38 Universität Hamburg, Hamburg,
Germany
39 Universität Siegen, Siegen,
Germany
40 Dipartimento di Fisica dell’Università and INFN, Genova,
Italy
41 Università dell’Aquila and INFN, L’Aquila,
Italy
42 Università di Milano and Sezione INFN, Milan,
Italy
43 Università di Napoli ”Federico II” and Sezione INFN, Napoli,
Italy
44 Università di Roma II ”Tor Vergata” and Sezione INFN, Roma,
Italy
45 Università di Catania and Sezione INFN, Catania,
Italy
46 Università di Torino and Sezione INFN, Torino,
Italy
47 Dipartimento di Matematica e Fisica ”E. De Giorgi” dell’Università del Salento and
Sezione INFN, Lecce,
Italy
48 Istituto di Astrofisica Spaziale e Fisica Cosmica di Palermo (INAF), Palermo,
Italy
49 Istituto di Fisica dello Spazio Interplanetario (INAF), Università di Torino and
Sezione INFN, Torino,
Italy
50 INFN, Laboratori Nazionali del Gran Sasso, Assergi (L’Aquila),
Italy
51 Benemérita Universidad Autónoma de Puebla, Puebla,
Mexico
52 Centro de Investigación y de Estudios Avanzados del IPN (CINVESTAV), México,
Mexico
53 Universidad Michoacana de San Nicolas de Hidalgo, Morelia, Michoacan,
Mexico
54 Universidad Nacional Autonoma de Mexico, Mexico, D.F.,
Mexico
55 IMAPP, Radboud University Nijmegen,
Netherlands
56 Kernfysisch Versneller Instituut, University of Groningen, Groningen,
Netherlands
57 Nikhef, Science Park, Amsterdam,
Netherlands
58 ASTRON, Dwingeloo,
Netherlands
59 Institute of Nuclear Physics PAN, Krakow,
Poland
60 University of Łódź, Łódź,
Poland
61 LIP and Instituto Superior Técnico, Technical University of Lisbon,
Portugal
62 ’Horia Hulubei’ National Institute for Physics and Nuclear Engineering, Bucharest-
Magurele,
Romania
63 University of Bucharest, Physics Department,
Romania
64 University Politehnica of Bucharest,
Romania
65 J. Stefan Institute, Ljubljana,
Slovenia
66 Laboratory for Astroparticle Physics, University of Nova Gorica,
Slovenia
67 Institut de Física Corpuscular, CSIC-Universitat de València, Valencia,
Spain
68 Universidad Complutense de Madrid, Madrid,
Spain
69 Universidad de Alcalá, Alcalá de Henares (Madrid),
Spain
70 Universidad de Granada and C.A.F.P.E., Granada,
Spain
71 Universidad de Santiago de Compostela,
Spain
72 Rudolf Peierls Centre for Theoretical Physics, University of Oxford, Oxford,
United Kingdom
73 School of Physics and Astronomy, University of Leeds,
United Kingdom
74 Argonne National Laboratory, Argonne, IL,
USA
75 Case Western Reserve University, Cleveland, OH,
USA
76 Colorado School of Mines, Golden, CO,
USA
77 Colorado State University, Fort Collins, CO,
USA
78 Colorado State University, Pueblo, CO,
USA
79 Fermilab, Batavia, IL,
USA
80 Los Alamos National Laboratory, Los Alamos, NM,
USA
81 Louisiana State University, Baton Rouge, LA,
USA
82 Michigan Technological University, Houghton, MI,
USA
83 New York University, New York, NY,
USA
84 Northeastern University, Boston, MA,
USA
85 Ohio State University, Columbus, OH,
USA
86 Pennsylvania State University, University Park, PA,
USA
87 University of Chicago, Enrico Fermi Institute, Chicago, IL,
USA
88 University of Hawaii, Honolulu, HI,
USA
89 University of Nebraska, Lincoln, NE,
USA
90 University of New Mexico, Albuquerque, NM,
USA
91 University of Wisconsin, Madison, WI,
USA
92 University of Wisconsin, Milwaukee, WI,
USA
93 Institute for Nuclear Science and Technology (INST), Hanoi,
Vietnam
(‡) Deceased
(a) Now at Konan University
(b) Also at the Universidad Autonoma de Chiapas on leave of absence from Cinvestav
(c) Now at University of Maryland
(d) Now at NYU Abu Dhabi
1 Introduction
Even many decades after the discovery of Ultra-High Energy Cosmic Rays (UHECRs), their sources remain elusive. The study of UHECR arrival directions is likely to provide significant insight into the still open question of their origin. The trajectories of charged cosmic rays, protons and heavier nuclei, may be significantly bent by intervening galactic and extragalactic magnetic fields, thus losing correlation with their sources. However, UHECR arrival directions are the most likely to trace their sources, as the magnetic deflections are inversely proportional to the cosmic ray energy.
Also, the UHECR flux from distant sources is expected to be strongly attenuated by the cosmic ray interactions with the cosmic microwave background, including photo-pion production for ultra-high energy protons (the so-called GZK effect) and photo-disintegration for heavier nuclei [1]. Hence, cosmic rays of energy above EeV (1 EeV eV) should mostly come from nearby sources, closer than about Mpc (see Sec. 4). The flux suppression measured at the highest energies [2, 3] is consistent with an extragalactic origin of UHECRs and with an energy attenuation due to the interaction of cosmic rays with photon backgrounds.
In this context, the observation of clustering in the arrival directions of UHECRs may shed light on their origin. For small magnetic deflections of the UHECR trajectories, the amount of clustering should reflect the density of local sources. In fact, the smaller the number of sources, the larger will be the UHECR flux coming from each of them, increasing the clustering signal which can be measured through the number of observed cosmic ray pairs separated by an angular distance smaller than the spread due to magnetic deflections. A statistical analysis of the clustering may help in identifying the astrophysical sources of UHECRs, since different populations of astrophysical objects have different characteristic densities , ranging from Mpc-3 for normal galaxies [4] down to Mpc-3 for Active Galactic Nuclei (AGN) with X-ray luminosity erg s-1 [5] and Mpc-3 for rich clusters of galaxies with mass larger than [6].
Both regular and turbulent magnetic fields play important roles in determining the strength of UHECR clustering. The regular component of the magnetic field, , induces a deflection in the arrival direction of an UHECR of charge and energy reaching Earth from a distance along a trajectory :
A turbulent magnetic field with amplitude and coherence length will introduce an additional spread in the arrival direction :
These deflections are normalized to typical values of magnetic field amplitudes and distances in the Galaxy. The magnitude of the deflection induced by extragalactic magnetic fields has large uncertainties, with estimates ranging from [7] to [8] for 100 EeV protons.
Since a detailed knowledge of the galactic and extragalactic magnetic fields is still missing, we will not attempt to model their effects in this paper. Rather, our bounds on the density of sources will be given as a function of the angular scale and will only apply at angular scales larger than the spread due to magnetic deflections.
The UHECR composition at the highest energy is also relevant for the interpretation of the results presented in this paper. The Pierre Auger Observatory has measured a change of the average shower depth, , compatible with a transition from a light composition at 1 EeV to a heavier composition at 35 EeV, the highest energy for which results using this technique have been reported [9, 10]. Complementary composition observables derived from the surface detector data including the asymmetry of the signals in the surface detector stations and the depth profile of muon production points give similar results at the highest energies, extending the results up to 45 EeV and 65 EeV respectively [11]. HiRes [12] and Telescope Array [13] have measured with larger statistical uncertainties and they allow a wider range of compositions, including a pure proton one. The interpretation of measurements of shower depths of maximum in terms of composition relies on extrapolations of hadronic interactions to energies beyond the regime where they have been tested experimentally. The UHECR composition at energies above 60 EeV is still not established. If heavy nuclei dominate at the highest energies, their magnetic deflections may be larger than (the maximum angular scale considered in our analysis), in which case our bounds will not apply.
Estimates of the density of sources in the range Mpc-3 have been obtained using data from previous experiments under various assumptions on the sources and their distribution [14, 15, 16, 17, 18, 19]. More recent studies based on the arrival directions of 27 UHECRs ( EeV) detected by the Pierre Auger Observatory before August 2007 have led to an estimate of Mpc-3 [20, 21]. A recent analysis of the autocorrelation function of UHECRs by the Telescope Array experiment shows no significant departure from isotropy [22].
In this paper, we present an autocorrelation analysis of the arrival directions of the highest energy events detected by the Pierre Auger Observatory until 31 December 2011. Bounds on the density of UHECR sources, assumed to be of equal intrinsic intensity, were derived for two plausible spatial distribution hypotheses, a uniform distribution and one following the local matter density as traced by galaxies in the 2MASS Redshift Survey (2MRS) catalog [23]. A preliminary analysis of an earlier dataset can be found in [24].
2 The Pierre Auger Observatory and the data set
The Pierre Auger Observatory is located in the Province of Mendoza, Argentina, at the Pampa Amarilla site (35.1∘– 35.5∘ S, 69.0∘– 69.6∘ W and a mean altitude of 1400 m a.s.l.) [25]. The Surface Detector (SD) consists of 1660 water-Cherenkov stations arranged over an area of 3000 km2 in a triangular grid of 1.5 km spacing [26]. The array is overlooked by 27 Fluorescence Detector (FD) telescopes located on hills at four sites on its periphery [27]. The FD provides a calorimetric measurement of the primary cosmic ray energy by reconstructing the shower development in the atmosphere. Selection criteria for SD events include requiring the SD station with the largest signal to be surrounded by at least five active stations at the time of the event, and the reconstructed shower core to be inside a triangle of active stations. The corresponding SD trigger efficiency is 100% for EeV and zenith angle . The cosmic ray arrival direction is obtained from the times of arrival of the shower front particles measured by the SD stations, with an angular resolution better than 0.9∘ for 10 EeV [28]. The SD signal at 1000 m from the shower core, determined from a fit of the signals of the SD stations in the event, is used as an estimator of the cosmic ray primary energy and the FD is used to calibrate the SD estimator. The energy resolution for EeV is , mainly coming from shower to shower fluctuations, and the systematic uncertainty on the absolute energy scale is [29]. In this paper we will consider events with energy thresholds of 60, 70 and 80 EeV and with zenith angles smaller than which were recorded by the Surface Detector between 1 January 2004 and 31 December 2011. There are 84, 43 and 22 events with energy above 60, 70 and 80 EeV respectively.
3 The two-point correlation function and the analysis method
A standard tool for the study of clustering in astronomical arrival directions is the two-point angular correlation function, , which gives the number of pairs separated by an angle smaller than :
| (1) |
where is the step function, and is the angular distance between events and of cosmic rays above an energy threshold .
The number of pairs above an energy threshold has uncertainties due to both the energy and angular resolution of the experiment. Events with true energy close to may or may not be selected among the events with highest energy depending on their measured energy. The uncertainty on the measured angular distance may also affect the determination of the number of pairs at a given angular scale. The uncertainty on the energy has the largest effect on the number of pairs for the number of events and experimental uncertainties in the present data set. In order to estimate the effect of experimental uncertainties on we generated 1000 pseudo data sets by randomizing the energy and direction of each measured event according to the corresponding uncertainty. For each of these pseudo data sets, we calculated for the highest energy events (with and 22, the number of events measured above each of the energy thresholds considered). From the distribution of these the uncertainty in the number of pairs in the data can be derived. As an example, we show in Figure 1 the case corresponding to EeV. The mean number of pairs in the pseudo datasets is plotted along with error bars attached to each point. These error bars correspond to a 68% CL derived from the pseudo data sets with a 16% probability to be above (or below) the bar. The shaded band in Figure 1 represents the 68% CL range of the expected number of pairs for an isotropic distribution of arrival directions of cosmic rays, derived from Monte Carlo simulations which properly included the detector exposure.
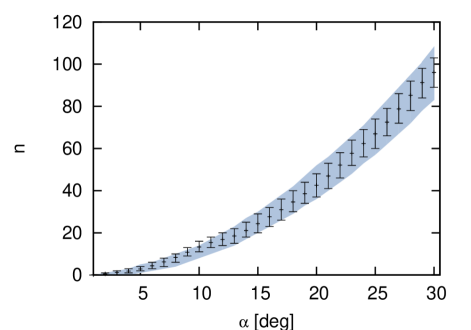
The observed distribution of in Figure 1 is consistent with the expectation for an isotropic distribution of cosmic rays, and the lack of a significant clustering signal in the data can be used to establish a lower bound on the density of sources (the same happens also in the case of the 60 and 80 EeV energy thresholds). We use as a clustering estimator the mean number of pairs in the pseudo data sets described above, , and compare it with the results from Monte Carlo simulations of cosmic rays originating from different distributions of sources with events above the energy threshold, taking into account the experimental uncertainties and the exposure of the Observatory. Details of the models for the distribution of sources are given in Section 4. From these simulations, we obtained the distribution of the expected mean number of pairs, , for a given angular scale, , and a given density of sources, . In the simulated data sets the energy and the arrival direction of the events are randomized according to the experimental uncertainties, and then the mean number of pairs is calculated in the same way as in the real data set. Then, the value of which satisfies
| (2) |
provides the CL lower bound on the density of sources. Eq. 2 implies that when comparing the mean number of pairs within a given angle obtained in a random simulation with source density to the mean number of pairs of the pseudo data sets, for 95% of the times the first one will be larger than the second one. Note that the clustering estimator used is the mean of the number of pairs in the pseudo data sets which is compatible with the experimental uncertainties. This leads to smaller fluctuations in the bound for different realizations of the energy measurement than if just the nominal number of pairs in the events above the threshold is used, as we have checked through numerical simulations.
Bounds will be given for angular scales between and and for different energy thresholds. Deflections of about are likely for extragalactic protons of EeV, and could be larger for strong extragalactic magnetic fields [8] or for heavier nuclei. The clustering pattern expected from a particular source scenario may be smoothed out by the deflections introduced by magnetic fields. Thus, the bounds obtained at a given angular scale are only valid if the spread in the arrival directions due to magnetic deflections is smaller than .
4 Distribution of sources and simulations
Two plausible scenarios were considered for the spatial distribution of the sources. These were taken to be either uniformly distributed or to follow the local distribution of matter in the universe. In both cases, we assumed, for simplicity, equal intrinsic intensity and the same UHECR energy spectrum at the sources. The equal intrinsic intensity hypothesis leads to conservative lower bounds on the density of sources, as a dispersion of the intensity of the sources leads typically to a larger number of pairs [14]. The presence of magnetic fields along the cosmic ray trajectories, besides leading to deflections in the arrival directions can also produce a magnification or demagnification of the flux received from each particular source. This effect has not been taken into account due to the lack of knowledge of the actual galactic and extragalactic magnetic fields. The magnetic lensing effect is expected to lead to a further dispersion of the apparent intensity of the sources and consequently to a larger number of pairs on average. The reported lower bounds, obtained ignoring this effect, are thus conservative (the interval may cover the true value of with a probability larger than 95%).
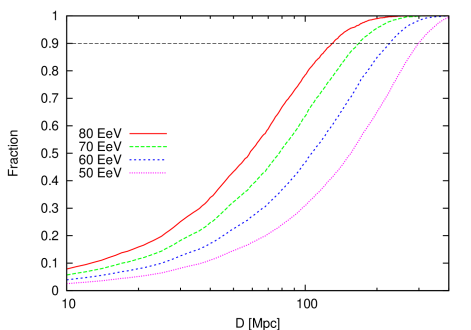
Simulations were then performed with the following procedure. For a given density , a number of sources were homogeneously distributed in a volume . This volume needs to be large enough to originate most of the observed UHECR flux at Earth. An estimate of its size was obtained from Monte Carlo simulations using the CRPropa code [30]. For a given energy threshold a large number of protons from uniformly distributed sources, with an initial energy spectrum , were followed up to the Earth, taking into account the relevant energy loss processes. Pion photoproduction and pair production from the proton interaction with the cosmic microwave background (CMB) were considered. Also, redshift energy losses were included, assuming a -Cold Dark Matter universe with Hubble constant km/s/Mpc, matter energy density and dark energy density . The fraction of the flux originated from sources at distances smaller than is plotted in Figure 2 for different energy thresholds for the case of a spectral index and a cutoff at eV. Its shape was found to change only slightly for values of between 2 and 2.7 and cutoff energies larger than eV.
From the simulated sources we propagated protons with initial energy above and a power law spectrum with spectral index 2.2 and recorded all the events arriving to the Earth with , stopping the simulation after having recorded events with energy . Events were simulated with energies down to so that the energies could be randomized according to the experimental uncertainty as described in the previous section. We simulated sources within radii of 180 Mpc, 230 Mpc and 300 Mpc for EeV, 70 EeV and 60 EeV respectively, so as to ensure that most of the potential sources were included (see Figure 2). The sources from which the events were propagated were selected with a probability proportional to , where is the exposure of the Observatory towards the direction of the source and is the distance to the source. In order to account for the energy and angular resolution of the detector, the arrival direction and the energy of the simulated events were randomized according to the corresponding uncertainties. A sample of 2000 sets of simulated events was used to derive the distribution of the expected mean number of pairs, (see Section 3).
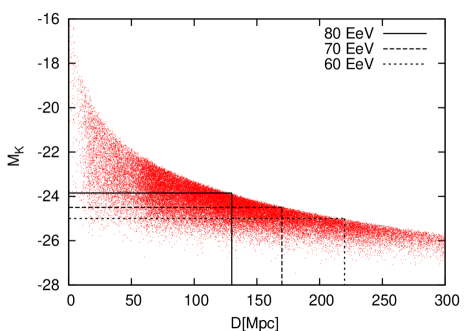
A similar procedure was adopted for the study of sources distributed according to the 2MRS catalog, which maps the distribution of matter through near infra-red selected galaxies. This catalog provides the most densely sampled all-sky survey, covering 91 of the sky (excluding a region around the Galactic plane at latitudes for longitude , and for ) [23]. The distance estimated from redshift may be significantly biased by the peculiar velocity for objects with small redshift (). For these objects, we used the distance measured independently of the redshift when available in the NASA/IPAC Extragalactic Database (NED). Otherwise, distances were estimated from the redshift. The limit in apparent magnitude of the catalog is . To extract volume limited subsamples which provide useful tracers of the matter distribution, an absolute magnitude cut has to be adopted for any given . For example, a volume limited subsample for Mpc (from which of the flux above 80 EeV is expected to originate) is obtained by requiring the absolute magnitude to be less than -23.85, as shown in Figure 3. For Mpc and 220 Mpc (where of the flux above 70 EeV and 60 EeV is expected to originate), and provide the volume limited subsamples respectively. The corresponding densities of objects are Mpc-3, Mpc-3 and Mpc-3 respectively. Notice that bounds can be reliably placed only up to densities lower than , since fluctuations will be underestimated in the simulations when sampling from a density of sources . We found that bounds for EeV and 60 EeV were too close to the density of objects in the corresponding volume limited catalog subsample and thus suffered from the sample variance problem. For the case of sources distributed like galaxies in the 2MRS catalog, we will hence only quote the results for EeV, where bounds were found to be robust. In order to simulate events down to EeV, it is necessary to consider sources up to a distance of Mpc. Since the volume limited subsample corresponding to 180 Mpc would lead to a too low density of objects we use the cut in magnitude corresponding to 130 Mpc () but include all the objects in the catalog up to 180 Mpc. We compensate the relative lack of galaxies at distances larger than 130 Mpc by including a weighting factor for the sources with Mpc. This weighting factor is inversely proportional to the selection function of the catalog 111This is the probability of detecting a galaxy in the survey as a function of the distance, , with the distribution of objects as a function of the distance in the catalog.. To determine , Monte Carlo simulations were performed following a procedure analogous to that of the isotropic distribution of sources, but with sources drawn from the subsample of the catalog. The only difference is that the sources are selected from the catalog subsample with a probability proportional to , with for 130 Mpc and for 130 Mpc.
Notice that the propagation of particles was performed under the assumption that UHECRs are protons. As a matter of fact, the propagation for iron nuclei and its secondaries, mainly determined by nuclear photodisintegration through interaction with the CMB and infrared background, leads to a very similar attenuation of the flux as a function of the energy. Intermediate mass primary nuclei experience larger energy losses [32], and can thus reach the Earth only if produced quite nearby. As a consequence, the expected clustering is higher than that of the proton or iron cases, and the 95% CL bounds for intermediate mass nuclei UHECRs are hence expected to be tighter than those obtained in this paper assuming a pure proton composition.
5 Results
In this section we derive bounds on the density of sources in the nearby universe, following the procedures detailed in the previous sections and focusing first in the case of uniformly distributed sources. We present the detailed analysis for a threshold of 70 EeV and then show the results for the 60 EeV and 80 EeV thresholds. In the two-point correlation analysis, a higher threshold energy reduces the maximum distance to Earth traveled by UHECRs, leading to a stronger discrimination of the clustering signal. On the other hand, the number of selected events may be drastically reduced, introducing large statistical uncertainties in the derived bounds. Based on numerical simulations we found that the 70 EeV threshold represents the preferred balance for the present statistics.
In Fig. 4 we present the results for EeV, corresponding to 43 selected events. To illustrate the method, the mean number of pairs at an angular scale , , is shown as a function of the density of sources (left panel). For any given density , the distribution of the expected mean number of pairs, , is obtained from simulations (see Section 4). The shaded band in the left panel of Fig. 4 represents the 90% CL of , with of the time the mean number of pairs being above the band and of the time below it. The value of the mean number of pairs obtained for the data is indicated by the solid horizontal line. A 95% CL lower bound on the density of sources at is then obtained from Eq. 2, corresponding to the value of the density for which the lower end of the band and the horizontal line intersect. Bounds at other angular scales are derived with an analogous procedure. We emphasize again that bounds at a given angular scale are only valid if the spread in the cosmic ray arrival directions due to magnetic deflections is smaller than . Thus, we present in the right panel of Fig. 4 results for angular scales between and , which cover a wide range of potential deflections due to magnetic fields and for different UHECR composition.
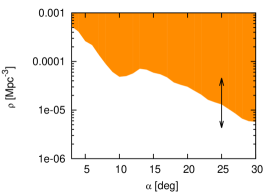
The most stringent bound is obtained for , where the density of sources is found to be larger than Mpc-3 with CL. For larger angular scales, the bound is less restrictive, reaching Mpc-3 for . The vertical arrows indicate how much the bounds change when the absolute energy scale of the experiment is shifted by according to its systematic uncertainty. To estimate this effect, we assumed that the true energy threshold for the 43 selected events was or 85 EeV, rather than the nominal 70 EeV, and repeated the procedure to set the lower bounds. We found that a upward (downward) shift in energy moves the bounds upward (downward) by about a factor of 3, as indicated by the vertical arrows.
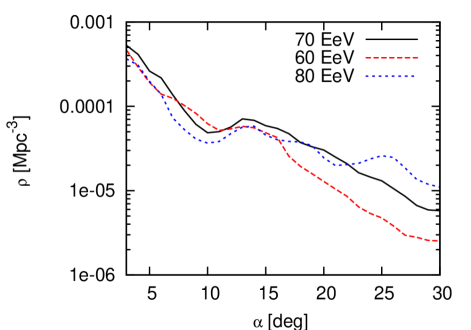
The CL lower bounds on the density of an isotropic distribution of sources for EeV ( events) and 80 EeV ( events) are given in Figure 5, together with the bounds at EeV. It can be seen that the bounds are quite stable with respect to the energy threshold choice.
If the intrinsic intensity of the sources were not uniform, a larger clustering of events is typically expected and thus tighter bounds on the density of sources would result. We have checked that for a distribution of intensities with dispersion equal to the mean the bound is shifted up by .
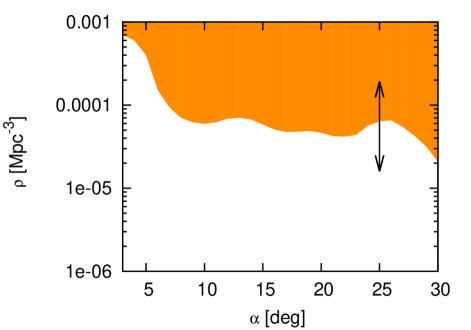
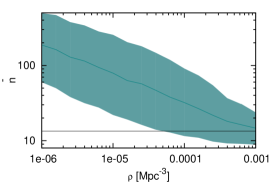
Stronger bounds on the density of sources are expected to result when the sources are not uniformly distributed in space, due to the additional clustering of the sources themselves. We explored the possibility that UHECR sources follow the distribution of matter in the local universe by using the galaxies in the 2MRS catalog as tracers of the matter distribution. Since the Galactic plane is masked in the 2MRS catalog, cosmic rays coming from that region of the sky are not included in this study, which results in events above an energy threshold of 80 EeV. This procedure ensures that simulated and real events can arrive from the same solid angle of the sky. Due to deflections in the regular magnetic field the sources of events in the unmasked region may lie in the mask. We assume that the clustering properties of the sources in both regions are similar. To derive bounds on the density of sources, we followed the same procedure described for the case of uniformly distributed sources, but with sources drawn from the volume limited subsample of the catalog (see Section 4). The corresponding CL lower bound as a function of the angular scale is shown in Figure 6, ranging from Mpc-3 at to Mpc-3 at . A shift of the absolute energy scale shifts the bounds as indicated by the vertical arrows.
In a previous study [33], the arrival directions of events above 55 EeV detected by the Pierre Auger Observatory were found to be compatible with a model based on 2MRS galaxies for smoothing angles of a few degrees and correlating fractions of about 40%. These parameters are however not strongly constrained with the present statistics. The clustering analysis considered here represents a complementary study that probes the density of the sources.
6 Conclusions
We have used the two-point angular correlation function to study the clustering properties of the arrival directions of UHECRs detected by the Pierre Auger Observatory. No significant excess of pairs up to an angular scale of was found, which provides a lower bound on the density of UHECR sources.
From the analysis of events with energy above 70 EeV we found that, if the spread due to magnetic deflections is smaller than , the density of equal intrinsic intensity sources uniformly distributed in space is larger than Mpc-3 with CL. For larger angular scales, the bound is less restrictive, reaching Mpc-3 at . These bounds have a factor of 3 uncertainty arising from the 22% systematic uncertainty in the energy scale. The analysis of events with energy larger than 60 and 80 EeV yielded comparable limits. We also studied a distribution of UHECR sources following the local matter in the universe, which was traced by the 2MRS catalog of galaxies. Bounds on the density of sources were similar, ranging from Mpc-3 at up to Mpc-3 at . Since the spread in the UHECR arrival directions induced by magnetic fields may wash out the clustering signal, a physical interpretation of these bounds is meaningful only when the spread due to magnetic deflections is smaller than the angular scale.
Even with this limitation, our bounds provide novel insight into the origin of UHECRs. If magnetic deflections are limited to a few degrees, as expected for a light composition of cosmic rays at the highest energies and weak extragalactic magnetic fields [7], our data suggest a rather large value for the source density, Mpc-3. This value is for instance compatible with the density of galaxies brighter than [34], but disfavors bright radio galaxies and AGNs with erg as the main source of the observed flux of cosmic rays above 70 EeV. On the other hand, lower values of the density are allowed for large magnetic deflections, as expected for a predominantly heavy composition or stronger extragalactic magnetic fields. In this case, the observed clustering is still compatible with the density of some types of AGNs, like Seyfert galaxies or low luminosity, Fanaroff-Riley I, radio galaxies.
This paper has made use of the NASA/IPAC Extragalactic Database (NED) which is operated by the Jet Propulsion Laboratory, California Institute of Technology, under contract with the National Aeronautics and Space Administration.
The successful installation, commissioning, and operation of the Pierre Auger Observatory would not have been possible without the strong commitment and effort from the technical and administrative staff in Malargüe.
We are very grateful to the following agencies and organizations for financial support: Comisión Nacional de Energía Atómica, Fundación Antorchas, Gobierno De La Provincia de Mendoza, Municipalidad de Malargüe, NDM Holdings and Valle Las Leñas, in gratitude for their continuing cooperation over land access, Argentina; the Australian Research Council; Conselho Nacional de Desenvolvimento Científico e Tecnológico (CNPq), Financiadora de Estudos e Projetos (FINEP), Fundação de Amparo à Pesquisa do Estado de Rio de Janeiro (FAPERJ), Fundação de Amparo à Pesquisa do Estado de São Paulo (FAPESP), Ministério de Ciência e Tecnologia (MCT), Brazil; AVCR AV0Z10100502 and AV0Z10100522, GAAV KJB100100904, MSMT-CR LA08016, LG11044, MEB111003, MSM0021620859, LA08015, TACR TA01010517 and GA UK 119810, Czech Republic; Centre de Calcul IN2P3/CNRS, Centre National de la Recherche Scientifique (CNRS), Conseil Régional Ile-de-France, Département Physique Nucléaire et Corpusculaire (PNC-IN2P3/CNRS), Département Sciences de l’Univers (SDU-INSU/CNRS), France; Bundesministerium für Bildung und Forschung (BMBF), Deutsche Forschungsgemeinschaft (DFG), Finanzministerium Baden-Württemberg, Helmholtz-Gemeinschaft Deutscher Forschungszentren (HGF), Ministerium für Wissenschaft und Forschung, Nordrhein-Westfalen, Ministerium für Wissenschaft, Forschung und Kunst, Baden-Württemberg, Germany; Istituto Nazionale di Fisica Nucleare (INFN), Ministero dell’Istruzione, dell’Università e della Ricerca (MIUR), Italy; Consejo Nacional de Ciencia y Tecnología (CONACYT), Mexico; Ministerie van Onderwijs, Cultuur en Wetenschap, Nederlandse Organisatie voor Wetenschappelijk Onderzoek (NWO), Stichting voor Fundamenteel Onderzoek der Materie (FOM), Netherlands; Ministry of Science and Higher Education, Grant Nos. N N202 200239 and N N202 207238, Poland; Portuguese national funds and FEDER funds within COMPETE - Programa Operacional Factores de Competitividade through Fundação para a Ciência e a Tecnologia, Portugal; Romanian Authority for Scientific Research ANCS, CNDI-UEFISCDI partnership projects nr.20/2012 and nr.194/2012, project nr.1/ASPERA2/2012 ERA-NET and PN-II-RU-PD-2011-3-0145-17, Romania; Ministry for Higher Education, Science, and Technology, Slovenian Research Agency, Slovenia; Comunidad de Madrid, FEDER funds, Ministerio de Ciencia e Innovación and Consolider-Ingenio 2010 (CPAN), Xunta de Galicia, Spain; Science and Technology Facilities Council, United Kingdom; Department of Energy, Contract Nos. DE-AC02-07CH11359, DE-FR02-04ER41300, DE-FG02-99ER41107, National Science Foundation, Grant No. 0450696, The Grainger Foundation USA; NAFOSTED, Vietnam; Marie Curie-IRSES/EPLANET, European Particle Physics Latin American Network, European Union 7th Framework Program, Grant No. PIRSES-2009-GA-246806; and UNESCO.
References
- [1] K. Greisen, Phys. Rev. Lett. 16 (1966) 748; G. T. Zatsepin and V. A. Kuz’min, JETP Lett. 4 (1966) 78.
- [2] R. U. Abbasi et al. (HiRes Collaboration), Phys. Rev. Lett. 100 (2008) 101101.
- [3] J. Abraham et al. (The Pierre Auger Collaboration), Phys. Rev. Lett. 100 (2008) 211101; J. Abraham et al. (The Pierre Auger Collaboration), Phys. Lett. B 685 (2010) 239.
- [4] C. S. Kochanek et al., Astrophys. J. 560 (2001) 566.
- [5] A. T. Steffen et al., Astrophys. J. Lett. 596 (2003) L3; S. Sazonov et al., Astron. and Astrophys. J. 462 (2007) 57; J. Tueller et al., Astrophys. J. 681 (2008) 113.
- [6] R. G. Carlberg et al., Astrophys. J. Lett. 479 (1997) L19.
- [7] K. Dolag et al. JCAP 0501 (2005) 009.
- [8] E. Armengaud, G. Sigl and F. Miniati, Phys. Rev. D 72 (2005) 043009.
- [9] J. Abraham et al. (The Pierre Auger Collaboration), Phys. Rev. Lett. 104 (2010) 091101.
- [10] P. Facal San Luis for the Pierre Auger Collaboration, Proc. 32nd ICRC (2011) [arXiv:1107.4804].
- [11] D. Garcia-Pinto for the Pierre Auger Collaboration, Proc. 32nd ICRC (2011) [arXiv:1107.4804].
- [12] R. U. Abbasi et al. (HiRes Collaboration), Phys. Rev. Lett. 104 (2010) 161101.
- [13] C. Jui et al. (TA Collaboration) Proc. APS DPF Meeting [arXiv:1110.0133].
- [14] S. L. Dubovsky, P. G. Tinyakov and I. I. Tkachev, Phys. Rev. Lett. 85 (2000) 1154.
- [15] Z. Fodor and S. D. Katz, Phys. Rev. D 63 (2000) 23002.
- [16] H. Yoshiguchi et al., Astrophys. J. 586 (2003) 1211.
- [17] P. Blasi and S. De Marco, Astrop. Phys. 20 (2004) 559.
- [18] G. Sigl, F. Miniati and T. A. Enßlin, Phys. Rev. D 70 (2004) 043007.
- [19] M. Kachelriess and D. Semikoz, Astrop. Phys. 23 (2005) 486.
- [20] A. Cuoco et al., Astrophys. J. 702 (2009) 825.
- [21] H. Takami and K. Sato, Astrop. Phys. 30 (2009) 306.
- [22] T. Abu-Zayyad et al. (TA Collaboration), Astrophys. J. 757 (2012) 26.
- [23] J. P. Huchra et al., Astrophys. J. Suppl. 199 (2012) 26.
- [24] M. de Domenico for the Pierre Auger Collaboration, Proc. 32nd ICRC (2011) [arXiv:1107.4805].
- [25] J. Abraham et al. (The Pierre Auger Collaboration), NIM A 523 (2004) 50.
- [26] I. Allekotte et al. (The Pierre Auger Collaboration), NIM A 586 (2008) 409.
- [27] J. Abraham et al. (The Pierre Auger Collaboration), NIM A 620 (2010) 227.
- [28] C. Bonifazi, for The Pierre Auger Collaboration, Nucl. Phys. B (Proc. Suppl.) 190 (2009) 20.
- [29] R. Pesce, for The Pierre Auger Collaboration, Proc. 32nd ICRC (2011) [arXiv:1107.4809].
- [30] K.-H. Kampert et al., [arXiv:1206.3132].
- [31] G. Cowan, Review of Particle Physics, Phys. Rev. D 86, 010001 (2012) 390.
- [32] D. Harari, S. Mollerach and E. Roulet, JCAP 11(2006)012.
- [33] P. Abreu et al. (Pierre Auger Collaboration), Astropart. Phys. 34 (2010) 314.
- [34] B. T. Soifer et al., Astrophys. J. Lett. 303 (1986) L41.