11email: gdubner@iafe.uba.ar 22institutetext: XMM-Newton Science Operations Centre, ESAC, Villafranca del Castillo, Spain 33institutetext: ISDEFE, Madrid, Spain 44institutetext: Telespazio Vega U.K. S.L. 55institutetext: FADU, University of Buenos Aires, Buenos Aires, Argentina
The most complete and detailed X-ray view of the SNR Puppis A
Abstract
Aims. With the purpose of producing the first detailed full view of Puppis A in X-rays, we carried out new XMM-Newton observations covering the missing regions in the southern half of the supernova remnant (SNR) and combined them with existing XMM-Newton and Chandra data.
Methods. Two pointings toward the south and southwest of Puppis A were observed with XMM-Newton. We combined these data with archival XMM-Newton and Chandra data and produced images in the 0.3-0.7, 0.7-1.0 and 1.0-8.0 energy bands.
Results. We present the first sensitive complete X-ray image of Puppis A. We investigated its morphology in detail, carried out a multiwavelength analysis and estimated the flux density and luminosity of the whole SNR. The complex structure observed across the remnant confirms that Puppis A evolves in an inhomogeneous, probably knotty interstellar medium. The southwestern corner includes filaments that perfectly correlate with radio features suggested to be associated with shock/cloud interaction. In the northern half of Puppis A the comparison with Spitzer infrared images shows an excellent correspondence between X-rays and 24 and 70 m emission features, while to the south there are some matched and other unmatched features. X-ray flux densities of , and erg cm-2 s-1 were derived for the 0.3-0.7, 0.7-1.0 and 1.0-8.0 keV bands, respectively. At the assumed distance of 2.2 kpc, the total X-ray luminosity between 0.3 and 8.0 keV is 1.2 erg s-1. We also collected and updated the broad-band data of Puppis A between radio and GeV -ray range, producing its spectral energy distribution. To provide constraints to the high-energy emission models, we re-analyzed radio data, estimating the energy content in accelerated particles to be erg and the magnetic field strength G.
Key Words.:
ISM: individual objects: Puppis~A-ISM: supernova remnants-X-ray: ISM1 Introduction
Puppis A is a nearby Galactic supernova remnant (SNR), about 50′ in diameter, with age estimates ranging from 3700 yr (Winkler & Kirshner 1985) to 4450 yr (Becker et al. 2012). It expands in the periphery of a large HI shell and near a chain of molecular clouds that seem to surround most of the SNR (Dubner & Arnal 1988). Based on HI and CO studies, a distance of 2.2 kpc has been proposed for Puppis A (Reynoso et al. 2003), altough Woermann et al. (2000) suggested a closer distance of about 1.3 kpc based on 1667 MHz hydroxyl (OH) line detections.
Puppis A is one of the brightest SNRs in X-rays. It has been observed using the Einstein (Petre et al. 1982), ROSAT (Aschenbach 1993), Chandra (Hwang et al. 2005), Suzaku (Hwang et al. 2008), and XMM-Newton (Hui & Becker 2006b; Katsuda et al. 2010, 2012) satellites. Based on the first images obtained with Einstein, Petre et al. (1982) concluded that on the large scale the X-ray surface brightness increases from west to east, suggesting a density gradient of a factor greater than 4 across the remnant. Subsequently, more sensitive observations showed a lower gradient in the emission distribution and confirmed that the SNR was highly structured, composed of a network of short, curved arcs.
Two bright knots were recognized early (Petre et al. 1982), one to the east, the “bright eastern knot” (BEK) and the other to the north. Spectral X-ray studies provided evidence that the SNR shock has interacted with ambient clouds in a relatively late phase of evolution (Hwang et al. 2005; Katsuda et al. 2010, 2012) and complementary studies (Paron et al. 2008; Arendt et al. 2010) indicated that the molecular cloud has already been destroyed by the shock in the BEK and that the X-ray and radio emission observed as bright features are, in fact, traces of past shock/interstellar medium (ISM) interactions. Although most of the X-ray emission is dominated by the shocked ISM, there are also isolated X-ray features rich in O, Ne, and Mg that can be identified as SN ejecta (Hwang et al. 2008; Katsuda et al. 2008, 2010).
In optical wavelengths, the brightest filaments agree reasonably well on a large scale with the location of radio and X-ray emission, but in detail the appearance of the optical emission is notably different from the morphology displayed in X-rays, radio, and infrared. A ridge of bright, nitrogen-rich filaments (indicating that interstellar material is being shocked) is visible along the northwest shock front. Historically, this was recognized early by Baade & Minkowski (1954) and Goudis & Meaburn (1978). While these filaments move with velocities lower than 300 km s-1 , other set of O-rich filaments with chaotic morphology are detected with radial velocities higher than 1500 km s-1 . These last filaments are interpreted as knots of SN ejecta that have remained relatively uncontaminated by interstellar material in spite of the thousands of years since the explosion (Winkler & Kirshner 1985).
In the far-infrared domain, the first images of Puppis A were obtained with the IRAS satellite. The SNR appeared bright and well resolved at 25 m and 60 m (Arendt et al. 1990). New IR observations were carried out toward Puppis A using the Spitzer Space Telescope MIPS photometer at 24, 70 and 160 m (Arendt et al. 2010). These new, high-quality data, revealed an extremely good IR/X-ray correlation on all spatial scales, confirming previous suggestions that the SNR’s IR radiation is dominated by the thermal emission of swept-up interstellar dust collisionally heated by the hot shocked gas. In particular, toward the BEK and the northern bright knot, the IR emission shows that the SNR shock has engulfed small denser clouds.
In radio, Puppis A was observed using different facilities (Milne et al. 1983; Dubner et al. 1991; Castelletti et al. 2006). One remarkable characteristic of Puppis A in this spectral range is the lack of neat edges. The borders look quite structured, with many short, arched filaments delimiting the remnant, particularly along the north-northeastern side and to the southwest. These filaments appear as narrow fringes whose spectrum alternates between flat and steep. This pattern has been interpreted in Castelletti et al. (2006) as a manifestation of Rayleigh-Taylor instabilities that distort the interface between ejecta and ambient gas, stretching and compressing the magnetic field and thus modifying the observed synchrotron emission.
Close to the geometric center of Puppis A lies the central compact object (CCO) RX J0822-4300 that emits thermal X-rays with a harder spectrum than the surrounding medium. Similar to other CCOs, it lacks counterparts at any other wavelength as well as a pulsar wind nebula (PWN). Gotthelf & Halpern (2009) reported the discovery of pulsations with a periodicity of 112 ms and very peculiar emission properties. Several studies have been conducted to determine the proper motion of RX J0822-4300 (Hui & Becker 2006a; Winkler & Petre 2007; de Luca et al. 2011; Becker et al. 2012). Based on data spanning a time baseline of more than ten years, Becker et al. (2012) concluded that the CCO has a proper motion of about 71 mas yr-1, which for a distance of 2 kpc implies a recoil velocity of about 670 km s-1 and an age of 4450 yr for the SNR.
The most recent discovery related to Puppis A is the confirmed detection of Gev ray emission with the Fermi satellite (Hewitt et al. 2012). It is among the faintest SNRs yet detected at GeV energies. The high-energy source is spatially extended. Its morphology was determined based on the Fermi LAT data which are restricted to events with energies above 800 MeV (to improve the angular resolution) and in the off-pulse window of the nearby (in the plane of the sky) Vela pulsar. The GeV ray emission extends over the northern half of the X-ray/radio remnant, with the maximum roughly coincident with the location of the BEK. The ray emission is well described by a power law with an index 2.1 in the observed energy range. After fitting the spectral energy distribution (SED) from radio to rays using inverse Compton, bremsstrahlung, and hadronic-dominated models, Hewitt et al. (2012) concluded that any emission mechanism is possible with different magnetic field strengths and different energetics of the relativistic particles.
Despite the rich nature of this remnant, whose emission across the whole electromagnetic spectrum includes traces of the past star as well as of the interaction of the SN blast wave with the surrounding gas, current X-ray images of Puppis A surprisingly lack a portion of the extended source. The image constructed by Petre et al. (1982) from the combination of 11 Einstein HRI overlapping exposures was presented as an image of the entire extent of Puppis A. However, as noted by the authors, the coverage has two exceptions, the southeast and the southwest corners, which were not so far observed. Moreover, the two southernmost regions observed happen to have the lowest exposure time of the entire source. Several years later, Puppis A was observed using ROSAT (Aschenbach 1993). This image also failed to cover the southern region of Puppis A, and almost 20% of the surface of the SNR has not been observed in dedicated observations (note that the ROSAT All Sky Survey includes an image of Puppis A in its entirety, but with a poor angular resolution and sensitivity). The XMM-Newton Slew Survey (Read et al. 2006) also covered part of the southern regions of Puppis A with irregular sensitivity, but good enough to show that it was worth to make pointed observations of these regions. This incompleteness not only impedes characterization of X-ray emission and prevent accurate estimates of the X-ray flux, but it makes the interpretation of observations at other frequencies very difficult as well. This motivated us to carry out deep X-ray observations towards the south and southwest portions of the remnant with the XMM-Newton Observatory. We present here the first complete, detailed X-ray image of the Puppis A SNR, including a sensitive study of the poorly known southern region. A subsequent work will deal with the spectral study based on the new observations.
2 Observations and Data reduction
To complete the X-ray view of Puppis A, two new observations of the remnant were performed with XMM-Newton. These pointings toward the south and southwest complement the existing coverage of the remnant obtained by the ROSAT, XMM-Newton, Chandra, and Suzaku observatories. Figure 1 shows the footprints of the previous XMM-Newton and Chandra observations and, in addition, the two new fields presented in this paper. The south and southwest fields were observed with the XMM-Newton EPIC pn and MOS cameras configured in full frame mode with thin filter. More details of these and the archival observations used in this paper are listed in Table 1.
XMM-Newton data were reduced using the XMM-Newton Science Analysis Software (SAS) version 12.0.1 with the most recent calibration files. High background flaring periods were filtered out using the SAS task espfilt, and images were subsequently accumulated using single and double events.
Archival Chandra observations of Puppis A include data from both the ACIS and HRC instruments. However, observations from the latter are not included here because the instrument’s intrinsic spectral resolution is too limited for the purposes of this paper. ACIS data were processed using CIAO version 4.4 and CALDB version 4.5.1, and images were accumulated following the standard CIAO data analysis threads111http://cxc.harvard.edu/ciao/.
Images were created in four energy bands: 0.3 - 0.7 keV (covering OVII and OVIII emission), 0.7 - 1.0 keV (including Ne and FeL emission), 1.0 - 8.0 keV (including Mg, Si and S emission), and the wide band 0.3 - 8.0 keV.
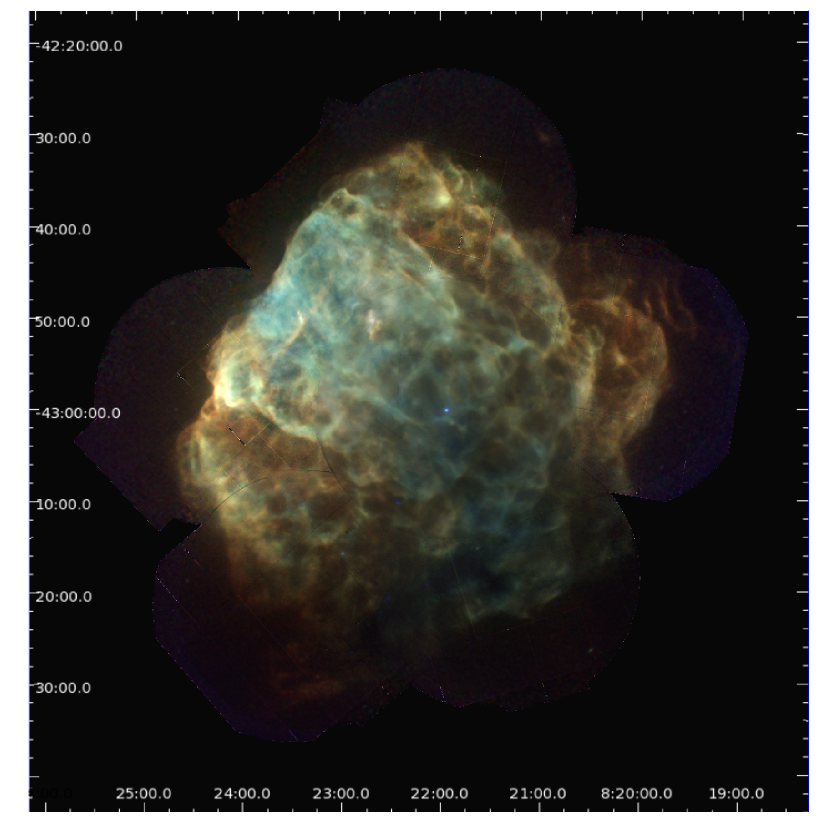
The resulting 59 cleaned images (51 of XMM-Newton EPIC and 8 of Chandra ACIS ) were each corrected for vignetting, weighted according to their respective energy-dependent effective areas, and subsequently merged with a 2-arcsec spatial binning. After smoothing with a 10-arcsec Gaussian kernel they were combined into the three-color image of the complete remnant, as shown in Fig. 2.
The previously best combination of Puppis A images was done by Katsuda et al. (2010) using six archival XMM-Newton observations and five archival Chandra observations.
| XMM-Newton observations | ||||||
| Field | RA, Dec | Date | Net exposure time (sec) | observation ID | ||
| MOS1 | MOS2 | PN | ||||
| New observations | ||||||
| Puppis A southwest | 08h21m20.00s -43d18’21.0” | 2012-05-05 | 35600 | 37403 | 26100 | 0690970101 |
| Puppis A south | 08h23m22.00s -43d21’00.0” | 2012-06-03 | 39900 | 39480 | 39360 | 0690970201 |
| Archival observations | ||||||
| PSR J0821-4300 | 08h21m57.28s -43d00’17.5” | 2010-05-02 | 1860 | 1020 | 6420 | 0650220201 |
| PSR J0821-4300 | 08h21m57.28s -43d00’17.5” | 2010-10-15 | 14600 | 13874 | 23040 | 0650220901 |
| PSR J0821-4300 | 08h21m57.28s -43d00’17.5” | 2010-10-15 | 22020 | 21286 | 16920 | 0650221001 |
| PSR J0821-4300 | 08h21m57.28s -43d00’17.5” | 2010-10-19 | 24640 | 25060 | 25210 | 0650221101 |
| PSR J0821-4300 | 08h21m57.28s -43d00’17.5” | 2010-10-25 | 20400 | 22820 | 21770 | 0650221201 |
| PSR J0821-4300 | 08h21m57.28s -43d00’17.5” | 2010-11-12 | 20380 | 22780 | 19570 | 0650221301 |
| PSR J0821-4300 | 08h21m57.28s -43d00’17.5” | 2010-12-20 | 24800 | 26660 | 13010 | 0650221401 |
| PSR J0821-4300 | 08h21m57.28s -43d00’17.5” | 2011-04-12 | 24600 | 28620 | 23970 | 0650221501 |
| RX J0822.0-4300 | 08h21m57.40s -43d00’16.7” | 2009-12-17 | 40550 | 36720 | 58300 | 0606280101 |
| RX J0822.0-4300 | 08h21m57.40s -43d00’16.7” | 2010-04-05 | 30060 | 26880 | 32460 | 0606280201 |
| Puppis A west | 08h20m24.00s -42d55’13.0” | 2005-10-09 | 8100 | 8100 | 5520 | 0303530101 |
| Puppis A north knot | 08h21m57.00s -42d36’58.0” | 2003-04-17 | 7500 | 7800 | 6960 | 0150150101 |
| Puppis A east knot | 08h24m11.00s -42d58’40.0” | 2003-05-21 | 1440 | 1960 | 10900 | 0150150201 |
| Puppis A east knot | 08h24m11.00s -42d58’40.0” | 2003-06-25 | 5960 | 5640 | 4860 | 0150150301 |
| Puppis-A | 08h21m56.70s -43d00’19.0” | 2001-11-08 | 10220 | 12400 | 20940 | 0113020301 |
| Chandra Observations | ||||||
| Field | RA, Dec | Date | Net exposure time (sec) | Observation ID | ||
| ACIS | ||||||
| Archival Observations | ||||||
| Puppis A NE filament | 08h23m11.54s -42d52’09.12” | 2010-11-13 | 18000 | 13183 | ||
| Puppis A NE filament | 08h23m11.54s -42d52’09.12” | 2010-11-10 | 22000 | 12548 | ||
| Puppis A NE shock front | 08h23m08.16s -42d41’41.40” | 2006-02-11 | 28650 | 6371 | ||
| Puppis A NE shock front | 08h23m08.16s -42d41’41.40” | 2005-09-04 | 34480 | 5564 | ||
| PUPPIS N knot | 08h22m00.00s -42d36’43.00” | 2002-03-09 | 20150 | 1949 | ||
| PUPPIS bright E Knot | 08h24m08.00s -42d57’00.00” | 2001-11-04 | 10770 | 1951 | ||
| Puppis A shock front | 08h23m25.20s -42d44’21.30” | 2001-10-01 | 15100 | 1950 | ||
| RX J0822-4300 | 08h21m57.50s -43d00’15.70” | 2000-01-01 | 11940 | 750 | ||
3 Results
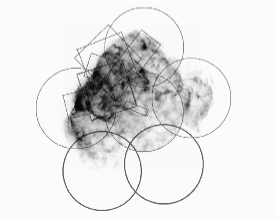
Figure 2 displays a three-color image of Puppis A. This is the most complete and detailed X-ray image of this extended SNR ever produced, including the southern regions that were not imaged in detail before. The appearance of Puppis A in X-rays is quite unique. Although it contains the central compact object RX J0822-4300 in its interior (the blue point), the X-ray emission is not dominated by a central pulsar wind nebula but is instead completely thermal in origin. The filamentary structure has a honeycomb appearance suggesting that the remnant is evolving in a rich and complex environment that strongly affects its morphology. From the comparison with high-quality X-ray images of other galactic SNRs, we find that this “cellular” structure is similar to those observed in the young SNRs Cas A, Crab, Kepler, and in G292.0+1.8, suggesting that we are seeing the imprint of the explosion on the ISM, even after about four thousand years. The new image of Puppis A uncovered the existence of X-ray emission in the southwest corner with the same morphological pattern of curved filaments as seen in the rest of the SNR.
From this X-ray image of Puppis A we can confirm that the bluish (harder X-ray emission) central band that crosses the remnant from northeast to southwest, previously noticed by different authors (Aschenbach 1993; Hwang et al. 2005; Katsuda et al. 2010), extends into the newly observed southwestern region. This peculiar harder band was first attributed to absorbing material related to the Vela SNR located between us and Puppis A, which would absorb most of the soft X-ray photons (Aschenbach 1993; Hui & Becker 2006b). More recently, Katsuda et al. (2010) proposed that it is more probably caused by variations in the temperature and the ionization timescale than by variations in the intervening column density. To explore in more detail the question, we present in Fig. 3 a comparison of the three-color X-ray image of Puppis A in Galactic coordinates (using a color display that emphasizes the harder spectrum blue band) with the HI column distribution as obtained from integrating the neutral hydrogen emission between 0 and 16.1 km s-1 , the systemic velocity of the SNR. The HI data were taken from the study conducted by Reynoso et al. (2003) in the direction to the central CCO, for which the authors combined interferometric HI observations performed using the Australian compact array ATCA, and single-dish observations carried out with Parkes 64-m telescope. There is a notable higher-density column perpendicular to the Galactic plane direction, practically coincident in the plane of the sky with the blue strip, suggesting that dense ISM might be responsible for absorbing soft X-ray photons. In addition, the wide-latitude CO survey of the third galactic quadrant carried out by May et al. (1988) and the CO study by Dame et al. (2001) confirm at large scale the abundant molecular gas below the Galactic plane (interpreted as a warp in the molecular disk), with small clouds along the line of sight to Puppis A that appear to be roughly coincident with the HI observed band. A detailed study of the atomic and molecular gas distribution across the whole SNR would be highly desirable to verify if differential absorption is responsible for the observed spectral variations.
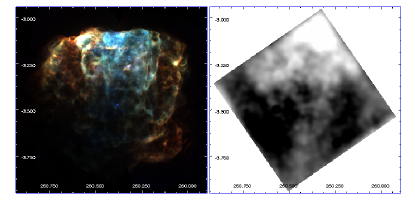
In Fig. 4 we present the individual images in the soft, medium, and hard X-ray bands, where the grayscale was preserved to show the flux density changes across the X-ray spectrum. The SNR is clearly brightest in the band 0.7-1.0 KeV.
In addition to all the rich structure noticed by other authors in the previous less sensitive X-ray images of the SNR, the high dynamic range attained in this new image allows us to unveil the presence of faint arcs and X-ray emitting extensions along most of the periphery, features that have been overlooked before. Particularly all along the northwestern border it can be noticed that the “scalloped” view of the limb exactly corresponds with the “wave-like” structures revealed in radio with VLA observations at 1425 MHz (Castelletti et al. 2006). Moreover a series of faint, curved filaments with a concave shape can be seen ahead of the main shock to the west side of Puppis A, near 08h19m30s, -42∘50′(ahead of the “ear”). These features appear to be present only in the soft and medium energies. In contrast to these structured and/or blurred borders, some portions of the outer rim are sharp, in some cases nearly linear while in other regions they have a concave geometry. Examples of these neat edges are observed along the northeast border around 08h23m30s, -42∘44′, ahead of the position of the BEK near 08h24m30s, -43∘00′, and in the newly mapped region, around 08h21m00s, -43∘20′, where the boundary has a curious shape consisting of two arcs with a concave geometry. As we show in the next section, these peculiar arcs coincide in location and shape with radio features. The southeast corner is probably the faintest part of the remnant. Some emission is detected in the 0.3 -0.7 keV band, while the medium-energy band is fainter and the hard X-ray emission is almost non-existent.
The high quality of the new hard X-ray image discloses several point sources in addition to the well-known central compact object RX J0822-4300. The three brightest sources visible in the southern half of Puppis A are located at (08h22m27.0s, -43∘10′27.0′′), (08h22m59.8s, -43∘16′01.45′′) and (08h22m32.8s, -43∘21′01.9′′). Of these, the first one has been listed in the Second XMM-Newton Serendipitous Source Catalog as 2XMM J082226.9-431026 and in the Australia Telescope-PMN catalogue of Southern Radio Sources as ATPMN J082226.8-431026. Based on its radio spectrum, Dubner et al. (1991) confirmed its extragalactic nature. It is worthwhile to note that this is the only coincidence found between radio and X-ray point sources in the field of Puppis A, though Dubner et al. (1991) reported the discovery of four compact sources across the surface of the SNR.
3.1 X-ray and radio emission
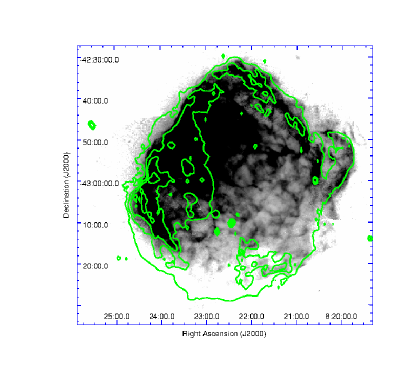
In Fig. 5 the X-ray emission in the medium energy (0.7-1.0 keV), the most intense band, is displayed (in gray) with a few radio contours of the emission at 1425 MHz overlapped. Castelletti et al. (2006) analyzed the comparison of radio with the X-ray emission in detail to the extent that was known then. Here we extend the previous analysis, including a careful study of the peripherical behavior in the northern half and of the weaker southern half. With this purpose in mind, we saturated the grayscale to display the X-ray emission in Fig. 5.
All along the northeastern limb, it is remarkable how the sharp edge of the bright X-ray emission runs farther inside than the radio emission. This characteristic was noticed by Castelletti et al. (2006) in the radio image of Puppis A, where a weak radio halo is apparent outside the bright radio rim. This diffuse radio emission might represent precursor synchrotron radiation from relativistic electrons that have diffused upstream from the shock. The observed scale-length of the diffuse emission (approximately 2 arcmin 1.3 pc at a distance of 2.2 kpc) agrees well with the typical upstream scale-length for the diffusive shock acceleration of cosmic rays by supernova remnants (Achterberg et al. 1994). On the other hand, along the north and west boundaries radio and X-ray emissions coincide in extension and in shape. This difference can be explained by a change in the orientation of the magnetic field lines from almost perpendicular to the shock front on the northeastern side (where the scale-length of the halo attains its maximum) to almost parallel along the wave-like features on the northwestern side (where the scale-length is zero).
The appearance is different around the BEK where the X-ray emission comes from evaporated clouds and, as discussed before by Hwang et al. (2005), the observed indentation (both in X-rays and in radio) strongly suggests that the shock front has recently interacted with a dense obstacle and is wrapping it around.
From the analysis of the southern half of the SNR, two aspects can be noticed: toward the south and southeast, the synchrotron radio emission extends considerably farther than the X-ray emission, while to the southwest the new image underscores the X-ray emission that exactly correlates with a bright radio feature. This radio maximum (near 08h21m, -43∘20′) has a flat radio spectral index (Castelletti et al. 2006), suggesting that this is another site where the SN shock might be encountering dense interstellar material. An inspection of the CO data from the CfA CO survey (Dame et al. 2001) reveals that in addition to the well-studied eastern cloud, there is another component at the same kinematical distance that appears to be almost in contact with the southwestern features of enhanced radio emission (at least as seen with the coarse angular resolution of the molecular data), suggesting that this may be another possible site of shock/cloud interaction.
3.2 X-ray and IR emission
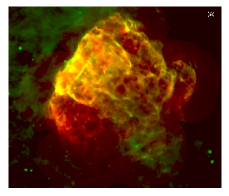
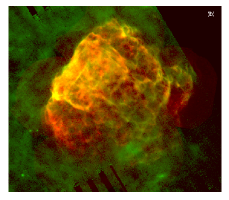
Figure 6a shows a full view of the correspondence between the X-ray emission in the 0.7-1.0 keV band with the infrared emission as detected with Spitzer at 24 m. This new comparison confirms the excellent agreement between X-rays and IR emission noticed by Arendt et al. (2010) in the northern half of the remnant. To the southwest the new X-ray data allowed us to uncover a complex network of filaments that in general agree with the location of the 24 m emission, although some X-ray features lack an infrared counterpart and viceversa. While along the northwestern flank an impressive match is observed between the small X-ray bright arcs and dust emissions (seen in yellow in the online color version of the figure), to the southeast the newly detected X-ray emission is not accompanied by analogous infrared emission. The comparison with the IR emission at 70 m (Fig. 6b) shows characteristics similar to the former case.
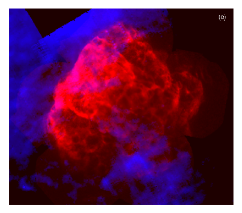
The correlation with 160 m emission (Fig. 6c) is very useful as a proxy to trace the spatial distribution of the foreground and co-spatial interstellar gas. It corresponds to the larger size dust grains that are not destroyed by the passage of the shock front. The emission along the eastern flank seems to be associated with an external cloud that is being shocked by Puppis A and partially covers its eastern border in the line of sight. This cloud, rich in large dust grains, was not detected in the CO searches (Paron et al. 2008) probably because the molecules have been dissociated by the radiative precursor of the SNR. The dusty content of this dense material remained, however, and is clearly seen in the far-IR image.
The IR-emitting region observed overlapping the south-southwest region corresponds exactly in shape and location with a minimum in the soft X-ray emission (see Fig. 2), demonstrating that it is a foreground cloud that absorbs the soft X-ray emission. This IR feature near 8h22m.2, -43∘21′was previously reported by Arendt et al. (2010), who identified it with a dark cloud located along the line of sight, closer than 1 kpc (corresponding to the radial velocity of 6 km s-1 of associated molecular emission). Optical plates of the region reveal patchy obscuration to the south, confirming the presence of dense foreground gas.
4 Physical properties
Based on the new X-ray image, we determined the observed X-ray flux density over the complete extent of Puppis A in soft, medium, and hard bands to within 5%. To determine the unabsorbed X-ray flux in these bands, we determined correction factors to adjust the observed flux for the amount of interstellar photoelectric absorption to the remnant. The correction is based on the spectral fits of Hwang et al. (2008) to seven separate regions across Puppis A. For each spectral fit, correction factors were derived by determining the relative change in model flux in each of the three bands when removing the interstellar absorption component from the model in question. Of the set of factors thus obtained, the mean value was used as estimate of the global flux correction factor for the respective energy band. From the range of factors we derived the systematic error associated with the correction. The correction factors are (soft), (medium) and (hard). The resulting unabsorbed band flux-densities are presented in Table 2 as a part of the flux-density estimates across the whole electromagnetic spectrum (SED). From these estimates, the total X-ray flux measured between 0.3 and 8.0 keV is erg cm-2 s-1, consistent within errors with previous estimates (Dwek 1987, which were based on the Einstein HRI rate included in Petre et al. (1982) and referenced spectral parameters).
At the assumed distance of 2.2 kpc the total luminosity in X-rays is erg s-1. The X-ray luminosity can be compared with the radio luminosity at 1425 MHz, erg s-1 (Castelletti et al. 2006), and in the FIR L erg s-1 (Arendt et al. 2010). The luminosity ratio is a useful parameter because it is independent of the distance. We find that / = 800 and / = 0.24 (or / = 4.2). This last ratio is similar to the value 5.2 estimated by Dwek et al. (1987).
4.1 Spectral energy distribution
For the sake of completeness, we present here a compilation of the broad-band spectral energy distribution with data homogenized to the same unities from radio to -rays, including for the first time data in the X-ray range as well as those reported in infrared by Arendt et al. (2010).
Figure 7 and Table 2 show the SED for Puppis A, where it is evident that the IR emission is the dominant radiative energy loss of the SNR. A similar behavior is observed in the young SNR Cas A, where the infrared thermal emission from hot plasma emerges as the main component in the global SED, lying much above the extrapolated radio synchrotron spectrum (Araya & Cui 2010).
| Radioa | ||
|---|---|---|
| Frequency | Photon energy | Energy density |
| (MHz) | (eV) | (erg cm-2 s-1) |
| 19 | 7.92 10-8 | (15.20 3.04) 10-14 |
| 86 | 3.58 10-7 | (59.34 8.60) 10-14 |
| 327 | 1.36 10-6 | (86.00 6.54) 10-14 |
| 408 | 1.70 10-6 | (95.88 8.16) 10-14 |
| 635 | 2.64 10-6 | (11.43 1.84) 10-13 |
| 843 | 3.51 10-6 | (12.14 0.84) 10-13 |
| 960 | 4.00 10-6 | (12.48 1.15) 10-13 |
| 1410 | 5.87 10-6 | (18.19 2.82) 10-13 |
| 1425 | 5.94 10-6 | (16.25 1.14) 10-13 |
| 1440 | 6.00 10-6 | (23.90 2.45) 10-13 |
| 1515 | 6.31 10-6 | (17.88 1.52) 10-13 |
| 2650 | 1.10 10-5 | (24.38 3.71) 10-13 |
| 2700 | 1.12 10-5 | (21.06 3.24) 10-13 |
| 4750 | 1.98 10-5 | (28.03 2.38) 10-13 |
| 5000 | 2.08 10-5 | (33.50 3.50) 10-13 |
| 5000 | 2.08 10-5 | (30.50 3.50) 10-13 |
| 8400 | 3.50 10-5 | (31.92 3.36) 10-13 |
| Infraredb𝑏bb𝑏bfrom Arendt et al. (2010) | ||
| Wavelength | Photon energy | Energy density |
| (m) | (eV) | (erg cm-2 s-1) |
| 100 | 1.25 10-2 | (3.80 2.97) 10-8 |
| 70 | 1.79 10-2 | (4.40 0.22) 10-8 |
| 60 | 2.08 10-2 | (5.98 1.75) 10-8 |
| 25 | 4.99 10-2 | (2.94 1.44) 10-8 |
| 24 | 5.20 10-2 | (2.88 0.14) 10-8 |
| X-raysc𝑐cc𝑐cthis work | ||
| Energy | Photon energy | Energy density |
| (keV) | (eV) | (erg cm-2 s-1) |
| 0.3-0.7 | 0.50 103 | |
| 0.7-1.0 | 0.85 103 | |
| 1.0-8.0 | 3.50 103 | |
| -raysd𝑑dd𝑑dfrom Hewitt et al. (2012) | ||
| Photon energy | Energy density | |
| (eV) | (erg cm-2 s-1) | |
| 312 106 | (10.0 5.1) 10-12 | |
| 757 106 | (15.0 4.1) 10-12 | |
| 1841 106 | (11.0 2.4) 10-12 | |
| 4472 106 | (14.0 2.1) 10-12 | |
| 1086.6 107 | (11.0 2.4) 10-12 | |
| 2640.3 107 | (7.3 2.5) 10-12 | |
| 6415.3 107 | (7.8 2.6) 10-12 | |

4.2 Energetics and magnetic field strength
In their analysis of the Fermi LAT GeV observations of Puppis A, Hewitt et al. (2012) concluded that by adopting different magnetic field strengths, all emission mechanisms are able to fit the data and both leptonic and hadronic-dominated models can reproduce the non-thermal SED that they presented, leaving the question about the origin of the GeV emission still open. The authors estimated that a total content of cosmic-ray accelerated electrons and protons of at least 1 to 5 erg is required to produce the observed ray emission. Although the search for the mechanism responsible for the high-energy emission is beyond the scope of this paper, we can set observational constraints that may help to fit the models in the future. To accomplish this, we re-analyzed the VLA radio continuum data presented by Castelletti et al. (2006) to estimate the minimum energy content of the accelerated particles and the corresponding B field.
From the synchrotron emissivity it is not possible to derive the magnetic field value unambiguously. The usual way of estimating the magnetic field strength in a radio source is to minimize its total energy content. The total synchrotron energy observed is stored in the magnetic field as well as in the kinetic energy of the relativistic particles (electrons and baryons). If we adopt the hypothesis of equipartition between particles and magnetic energy, the minimum energy content and the corresponding magnetic field can be obtained from the relations presented by Moffet (1975): and , where is the volume of the source, is a factor that depends on the assumed lower and upper cutoff radio frequencies and the radio spectral index of the SNR, and is the total luminosity of the source in radio wavelengths. As mentioned above, electrons may not be the only energetic particles within the source; an appreciable amount of energy may also be stored in energetic baryons. The relative amount can be described as , where has been estimated by various authors to vary between 1 and 100 (Moffet 1975). If we assume a=50, for the typical lower and upper cutoff frequencies of 107 and 1011 MHz, we derive for Puppis A a minimum energy content of about 4.8 1049 erg. The magnetic field for which the total energy content is minimum is 26 G. These values agree well with the results derived by Hewitt et al. (2012) from gamma-ray model fiting, particularly with the estimates from the hadron-dominated model. It is also comparable with the energy content derived for Cas A (Araya & Cui 2010).
5 Summary
Based on our new XMM-Newton observations and the combination with archival data acquired with the same telescope and with Chandra, we have produced the highest quality, most comprehensive X-ray image ever made of the SNR Puppis A in the energy bands 0.3-0.7 keV, 0.7-1.0 keV and 1.0-8.0 keV. The high dynamic range attained in this new image revealed weak emission not only in the newly explored southern region, but also all along the periphery of the SNR. The new image shows for the first time X-ray emission in the south/southwest parts of Puppis A. In these areas the emission is in the form of short arched filaments, similar in appearance to the rest of the source. The southwestern border has a peculiar morphology consisting of two arcs with concave geometry, coincident with radio features with properties suggestive of shock/cloud interaction. The new image also uncovered several hard-spectrum point sources, one of which was previously identified in the radio band as extragalactic. The new observations also confirmed that a broad band with a harder X-ray spectrum, which crosses the SNR from northeast to southwest and was shown in previous studies of this remnant, extends into the southwest corner. An inspection of the HI distribution in the central part of Puppis A shows a band with a higher column density in positional coincidence with the observed hard X-ray feature, suggesting that it might be the consequence of localized absorption of soft photons by intervening gas.
The new image was compared with a VLA radio image at 1425 MHz. Of particular interest is the fact that to the east the radio limb is about 2 arcmin ( 1.3 pc at the distance of 2.2 kpc) outside the sharp X-ray border. We interpreted this radio halo as the precursor synchrotron radiation from relativistic electrons that have diffused upstream from the shock. The scale-length is comparable with the theoretically estimated length for the diffusive shock acceleration of cosmic rays by supernova remnants. To the north and northwest, radio and X-ray borders show a notable coincidence both in shape and location. To the south the agreement is poorer, except to the southwest, as mentioned above.
From the comparison with Spitzer infrared images at 24, 70 and 160 m we were able to confirm the previously reported excellent IR/X correspondence in the northern half of the remnant. The correlation is poorer toward the south, where there are X-ray features without an IR counterpart, and viceversa. The comparison with the FIR image at 160 m showed a broad strip of IR emission all along the eastern flank of Puppis A, abutting the X-ray emission. We believe that this emission comes from the bordering molecular cloud, where the large-scale dust grains have not been destroyed by the SN shock.
Moreover, based on the new image, we carefully estimated the flux density as observed in the three energy bands in 12.6, 6.2, and 2.8 erg cm-2 s-1 for soft, medium, and hard X-ray band, respectively. At the assumed distance of 2.2 kpc, the total X-ray luminosity between 0.3 and 8.0 keV is 1.2 erg s-1, which is 800 times higher than the radio luminosity and only a quarter of the infrared luminosity, confirming the significance of the IR emission in the energetics of Puppis A.
Additionally, to set constraints that may help understanding the mechanisms responsible for the GeV emission, we presented an updated and complete broad-band SED of Puppis A, including the X-ray fluxes from this work. We also re-analyzed radio data to estimate the minimum energy content stored in relativistic particles, as well as the magnetic field strength. From these calculations we derived erg and G.
A forthcoming paper will deal with the spectral study of Puppis A, making use of the new observations reported here.
Acknowledgements.
We are very grateful to R. D. Saxton and A. M. Read for their valuable contribution during the first stages of this work. We acknowledge J. Hewitt for providing the Fermi GeV data and to R. Arendt for the Spitzer IR images and for helpful comments. E.G. acknowledges support from the Faculty of the European Space Astronomy Centre (ESAC). GD acknowledges the hospitality during her stay at ESAC. This research was partially funded by Argentina Grants awarded by ANPCYT: PICT 0902/07, 0795/08 and 0571/11; CONICET: 2166/08, 0736/12 and University of Buenos Aires (UBACYT 20020100100011). This work is based on observations done with the XMM-Newton , an ESA science mission with instruments and contributions directly funded by ESA Member States and the US (NASA). G.D, E.G. and G.C. are Members of the Carrera del Investigador Científico of CONICET, Argentina.References
- Achterberg et al. (1994) Achterberg, A., Blandford, R. D., & Reynolds, S. P. 1994, A&A, 281, 220
- Araya & Cui (2010) Araya, M. & Cui, W. 2010, ApJ, 720, 20
- Arendt et al. (2010) Arendt, R. G., Dwek, E., Blair, W. P., et al. 2010, ApJ, 725, 585
- Arendt et al. (1990) Arendt, R. G., Dwek, E., Petre, R., et al. 1990, ApJ, 350, 266
- Aschenbach (1993) Aschenbach, B. 1993, Advances in Space Research, 13, 45
- Baade & Minkowski (1954) Baade, W. & Minkowski, R. 1954, ApJ, 119, 206
- Becker et al. (2012) Becker, W., Prinz, T., Winkler, P. F., & Petre, R. 2012, ApJ, 755, 141
- Castelletti et al. (2006) Castelletti, G., Dubner, G., Golap, K., & Goss, W. M. 2006, A&A, 459, 535
- Dame et al. (2001) Dame, T. M., Hartmann, D., & Thaddeus, P. 2001, ApJ, 547, 792
- de Luca et al. (2011) de Luca, A., Mignani, R. P., Sartori, A., et al. 2011, A&A, 525, A106
- Dubner & Arnal (1988) Dubner, G. M. & Arnal, E. M. 1988, A&AS, 75, 363
- Dubner et al. (1991) Dubner, G. M., Braun, R., Winkler, P. F., & Goss, W. M. 1991, AJ, 101, 1466
- Dwek (1987) Dwek, E. 1987, ApJ, 322, 812
- Dwek et al. (1987) Dwek, E., Petre, R., Szymkowiak, A., & Rice, W. L. 1987, ApJ, 320, L27
- Gotthelf & Halpern (2009) Gotthelf, E. V. & Halpern, J. P. 2009, ApJ, 695, L35
- Goudis & Meaburn (1978) Goudis, G. & Meaburn, J. 1978, A&A, 62, 283
- Hewitt et al. (2012) Hewitt, J. W., Grondin, M.-H., Lemoine-Goumard, M., et al. 2012, ApJ, 759, 89
- Hui & Becker (2006a) Hui, C. Y. & Becker, W. 2006a, A&A, 457, L33
- Hui & Becker (2006b) Hui, C. Y. & Becker, W. 2006b, A&A, 454, 543
- Hwang et al. (2005) Hwang, U., Flanagan, K. A., & Petre, R. 2005, ApJ, 635, 355
- Hwang et al. (2008) Hwang, U., Petre, R., & Flanagan, K. A. 2008, ApJ, 676, 378
- Katsuda et al. (2010) Katsuda, S., Hwang, U., Petre, R., et al. 2010, ApJ, 714, 1725
- Katsuda et al. (2008) Katsuda, S., Mori, K., Tsunemi, H., et al. 2008, ApJ, 678, 297
- Katsuda et al. (2012) Katsuda, S., Tsunemi, H., Mori, K., et al. 2012, ApJ, 756, 49
- May et al. (1988) May, J., Murphy, D. C., & Thaddeus, P. 1988, A&AS, 73, 51
- Milne et al. (1983) Milne, D. K., Goss, W. M., & Danziger, I. J. 1983, MNRAS, 204, 237
- Moffet (1975) Moffet, A. T. 1975, Strong Nonthermal Radio Emission from Galaxies: Galaxies and the Universe (ed. Sandage, A.,Sandage, M. and Kristian, J., Chicago:Univ.Chicago Press), 211
- Paron et al. (2008) Paron, S., Dubner, G., Reynoso, E., & Rubio, M. 2008, A&A, 480, 439
- Petre et al. (1982) Petre, R., Kriss, G. A., Winkler, P. F., & Canizares, C. R. 1982, ApJ, 258, 22
- Read et al. (2006) Read, A., Saxton, R., Esquej, P., Freyberg, M., & Altieri, B. 2006, PASJ, 58, L47
- Reynoso et al. (2003) Reynoso, E. M., Green, A. J., Johnston, S., et al. 2003, MNRAS, 345, 671
- Winkler & Kirshner (1985) Winkler, P. F. & Kirshner, R. P. 1985, ApJ, 299, 981
- Winkler & Petre (2007) Winkler, P. F. & Petre, R. 2007, ApJ, 670, 635
- Woermann et al. (2000) Woermann, B., Gaylard, M. J., & Otrupcek, R. 2000, MNRAS, 317, 421