Wide Integral-Field Infrared Spectroscopy of the Bright [Fe II] Shell in the Young Supernova Remnant G11.20.3
Abstract
We present the results of wide integral-field near-infrared (1.0–1.8 m) spectroscopic observations of the southeastern shell of the young core-collapse supernova remnant (SNR) G11.20.3. We first construct [Fe II] 1.644 m line images of three bright clumps from the obtained spectral image cubes and compare them with those of other transitions such as [Fe II] 1.257, [Fe II] 1.534 and He I 1.083 m line images. This allows us to estimate the electron density ( 4,700–9,400 cm-3) and extinction ( 16–20 mag) of the shell, including detailed two-dimensional distribution of the properties in the brightest clump, as well as the discovery of a faint high-velocity ( –440 km s-1) component in the clump. Our SNR shock model calculations estimate the preshock number density of 250–500 cm-3 and shock speed of 80–250 km s-1 in the [Fe II]-emitting region of the SNR. The comparison between the observed and modelled radial profiles of the line intensities and their ratios reveals that the shell is composed of multiple thin filaments which have been likely formed in episodic mass loss processes of a progenitor star. The discovery of the faint high-velocity component supports the interpretation that the southeastern shell of G11.20.3 is mainly composed of circumstellar material with contamination by supernova ejecta and also that its ejected material was expelled primarily in the southeast-northwest direction.
Subject headings:
ISM: individual objects (G11.20.3 (catalog )) — ISM: supernova remnants — infrared: ISM — shock waves1. Introduction
Near-infrared [Fe II] observation of young core-collapse SNRs in the Galactic plane is an invaluable tool for understanding many interesting phenomena associated with core-collapse supernova explosions. Iron is the end product of the stellar nucleosynthetic processes with relatively small (7.90 eV) ionization potential, which renders near-infrared [Fe II] observations particularly useful for studying the distribution and kinematics of ejecta from deep layers of a progenitor star and those of circumstellar material from its later evolutionary phases prior to the explosion, along with interstellar shocks, while suffering less extinction effect than the visual or X-rays.
An enlightening illustration is the heavily extinquished ( 13 mag) young core-collapse SNR G11.20.3, the likely remains of the historical supernova explosion in SN 386 at 5 kpc distance (Stephenson & Green, 2002; Becker et al., 1985; Green et al., 1988), of which recent [Fe II] observations have revealed several pertinent features. According to the results of Koo et al. (2007) and Moon et al. (2009), G11.20.3 is filled with bright near-infrared [Fe II] emission originating from both the shocked ejecta and circumstellar material scattered around the entire remnant. In its inner part, knotty [Fe II] emission with significant ( 1,000 km s-1) Doppler shifts is prominent without any other bright elements, indicating that the majority of the iron knots therein originate deep inside its progenitor. Near its northwestern boundary lie knotty filaments of [Fe II] emission, reminiscent of bubbly iron ejecta. The most conspicuous near-infrared [Fe II] feature in G11.20.3, however, is its southwestern shell which is in fact the brightest near-infrared [Fe II] emission ever detected among all Galactic SNRs. The shell is thick and prominent in radio, X-ray and mid-infrared emission too (Green et al., 1988; Kaspi et al., 2001; Pinheiro et al., 2011). Although all these are suggestive that the southwestern shell is a rare example of shocked supernova ejecta interacting with shocked circumstellar material, the origin and nature of this unique feature are uncertain.
One efficient way to investigate the [Fe II] emission of the southwestern shell of G11.20.3 is to obtain broadband two-dimensional integral-field spectra of the entire emission which can provide both spectral and spatial information simultaneously. In this paper, we report the results of such observations using our own instrument the Florida Image Slicer for Infrared Cosmology and Astrophysics (FISICA). We describe our instrument setup and observations in § 2, followed by results of the observations (§ 3) and discussions focused on shock modelling of multiple near-infrared [Fe II] line emission (§ 4). We summarize our results in § 5.
2. Instrument Setup and Observations
The instrument setup used for the observations we report in this paper is a combination of Florida Multi-object Imaging Near-infrared Grism Observational Spectrometer (FLAMINGOS) and FISICA. The former is a facility instrument at the Kitt Peak National Observatory Mayall 4 m telescope. One unique feature of this instrument is a small multi-object spectrograph (MOS) dewar, separated from its main dewar, dedicated for cycling multi-object slit masks (Elston., 1998). We replaced the MOS dewar with FISICA which is an image slicer-based integral-field unit composed of three monolithic mirror arrays (Eikenberry et al., 2006). FISICA was developed by some of the authors of this paper as an accessory module for FLAMINGOS, and the combination of FLAMINGOS and FISICA provides an unprecedentedly large integral-field of view of 16″ 33″ in the near-infrared regime. This setup is uniquely ideal for studying kinematics and chemistry of extended objects in the Galactic plane, such as the [Fe II] emission of the southwestern shell of G11.20.3 as we report here.
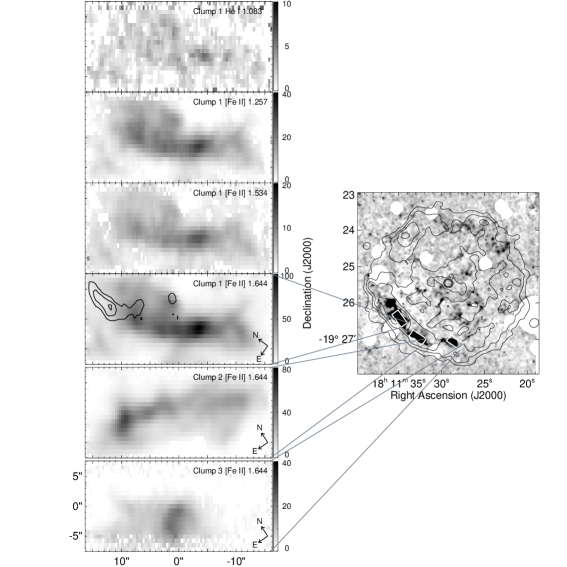
The observations took place on 2006 June 17 and 18 using the -band grism of FLAMINGOS, which covers the 1.0–1.8 m range populated with many [Fe II] emission lines with 1,300 spectral resolving power. We observed three bright [Fe II] clumps (which we call Clump 1, 2, and 3) within the southeastern shell of G11.20.3 originally detected in the [Fe II] 1.644 m narrow-band imaging observations (Koo et al., 2007, see Figure 1). We followed each exposure of 300 seconds toward the clumps with the same exposure toward nearby sky without any apparent [Fe II] emission in order to subtract out sky background emission (including OH lines). The total on-source integration times were 1,500, 2,100, and 900 seconds for Clump 1, 2, and 3, respectively, and the same integration times were used for sky observations. After flat fielding, we obtained wavelength solutions using HeNeAr arc spectra, and used the standard star of SAO 187086 (G6V) for telluric calibration (Coelho et al., 2005). The astrometric solutions of the obtained data cubes are consistent with the known positions of stars located inside the integral fields of the clumps.
3. Results
Figure 1 presents pure [Fe II] (1.644 m) line images of Clumps 1, 2, and 3, together with those of He I (1.083 m) and [Fe II] (1.257 and 1.534 m) of Clump 1. To construct the line images, we measure the intensities of the line transitions at every spaxel by fitting their profiles with a gaussian function. The [Fe II] (1.644 m) line images of the three clumps show extended ( 25″) elongated structures along the southwestern shell of G11.20.3. For the brightest Clump 1, in addition to the 1.644 m transition, we also detect significant emission of [Fe II] from the transitions at 1.257 and 1.534 m. The images of the latter transitions closely resemble that of the former, with correlation coefficients of 0.94 (1.256 vs. 1.644 m images) and 0.95 (1.534 vs. 1.644 m images). We also detect He I (1.083 m) line emission from Clump 1. Although faint, its peak position is coincident with those of the [Fe II] lines, and it appears to extend in the same direction as the extension of the [Fe II] images.
Figures 2a and 2b show -band spectra of Clumps 1, 2, and 3 integrated over the entire region of each clump. As in Figure 2, they are exclusively dominated by [Fe II] transitions, and in total we identify 12 [Fe II] transitions. The only line which is detected other than the [Fe II] lines is He I (1.083 m) from Clump 1. Table 1 contains the details of the detected line transitions including their relative intensities. The detected lines do not show any apparent Doppler shifts, which is consistent with the results of Moon et al. (2009) around this area of the SNR, indicating that their motions are mostly tangential. However, in the profile of the [Fe II] (1.644 m) transition from Clump 1 (Figure 2c), we identify an additional velocity component which we call the southeastern blueshifted high-velocity feature (or SE-BHVF). The extension of SE-BHVF is 10″ and its peak position is located at 15″ from the main peak position of Clump 1 in the northeastern direction (Figure 1). Using a two-velocity component gaussian fit of the profile, we estimate the radial velocity of SE-BHVF to be –440 100 km s-1, highly blueshifted from the systematic velocity (45 km s-1) of G11.20.3 (Green et al., 1988). The integrated intensity of SE-BHVF is 2 % of the main component.
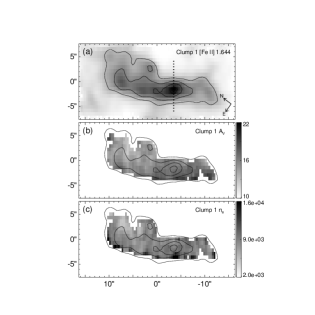
Because the two [Fe II] transitions at 1.257 and 1.644 m detected in Clump 1 share the same upper level, their intrinsic intensity ratio is determined by their atomic parameters. We compare the observed ratio with the intrinsic ratio of 1.36 expected from the atomic parameters of [Fe II] (Deb & Hibbert, 2011) and compute the extinction toward the source using the extinction curve of grains in the Milky Way with = 3.1 (Draine, 2003). Figure 3b shows a visual extinction () map of Clump 1 which presents two-dimensional distribution of the extinction in the clump. Its mean extinction is = 16 1 mag, but varies somewhat significantly within the clump between 12 and 20 mag and increases in the southwestern directions where Clumps 2 and 3 are located. For the extinctions toward Clumps 2 and 3, we only calculate their average extinctions of = 18 1 (Clump 2) and 20 1 (Clump 3) mag due to relatively weak intensities of their [Fe II] 1.257 m transitions. The internal extinction distribution within Clump 1 and the increased extinctions toward Clumps 2 and 3 show a tendency that the overall extinction toward G11.20.3 in this area increases along the southern direction, indicating potential existence of a foreground or circumstellar gas cloud there. The extinction toward Clump 1 is consistent with a SN at 5 kpc being visible to the naked eye in AD 386. The average extinction ( = 16 mag) of Clump 1 is higher than the extinction ( = 13 mag) previously estimated at the intensity peak position (Koo et al., 2007), although their observed transition ratios of [Fe II] 1.257 to 1.644 m are similar within errors (0.303 0.019 for the former and 0.314 0.010 for the latter), simply due to the different atomic parameters and resulting intrinsic intensities used to estimate the extinctions (Deb & Hibbert, 2011; Quinet et al., 1996).
We also use the distribution of the transition ratio of [Fe II] 1.533 to 1.644 m to obtain two-dimensional distribution of the electron density in Clump 1 (Figure 3c). We solve the rate equations of 16 levels of Fe+ using the transition probabilities and collision strengths in the literature (Deb & Hibbert, 2011; Ramsbottom et al., 2007) at the temperature of 5,000 K. As in Figure 3c, the distribution of the electron density in Clump 1 is totally different from that of the [Fe II] 1.644 line intensities with their peaks located at different positions. The average electron density of Clump 1 is 9,400 2,100 cm-3, while those of the other two clumps are 8,900 2,800 and 4,700 1,000 cm-3 for Clumps 2 and 3, respectively.
4. Discussion
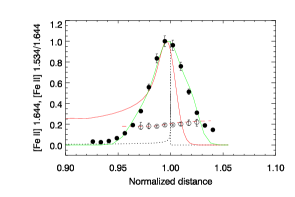
The near-infrared -band spectra of the observed clumps are dominated by [Fe II] lines – only weak emission of He I is detected other than [Fe II] lines in Figure 2. One notable feature is the lack of correlation between the distribution of the [Fe II] line intensities and that of the electron number density (Figure 3), which indicates that the [Fe II] 1.534 to 1.644 m ratio distribution is largely independent of the line intensity distribution. In order to investigate this more thoroughly, we compare the radial distribution of the two quantities, i.e., [Fe II] 1.644 m line intensity and the [Fe II] 1.534 to 1.644 m line ratio, along the peak position of Clump 1 (Figure 3) by applying boxcar average of 5″. Figure 4 shows that the radial distributions of the two quantities are clearly dissimilar: the [Fe II] 1.644 m line intensity peaks at the middle of the clump and decays both inward and outward with 4″ FWHM, while the [Fe II] 1.534 to 1.644 m ratio distribution is almost flat with a tendency of slight increase toward the outer edge of the clump.
We model the radial profiles of the [Fe II] 1.534 and 1.644 m line intensities and their ratio for a SNR shock penetrating into dense ambient medium using a shock code (Figure 4). The code that we use was developed by Raymond (1979) and improved by Cox & Raymond (1985). We have updated the atomic parameters of [Fe II] forbidden lines, using recent values from Deb & Hibbert (2011) and Ramsbottom et al. (2007) for the radiative transition rates and the collisional strengths, respectively. We calculate the level populations of the lowest 16 levels in four terms (, , , and ) of Fe+ and the intensities of the lines resulting from the transitions among them. The line emissivities of a fluid element are calculated following its trajectory from the shock front until it cools down to 1,000 K, and are used to compute the line intensities and their ratios. We assume that incoming H atoms are fully ionized by radiative precursor. The code, however, does not calculate the emission from radiative precusor itself. This is acceptable for [Fe II] lines because Fe atoms in the pre-shock gas may be mostly locked up to grains, which are liberated when the grains are destroyed in the post-shock flow. The [Fe II] 1.534 and 1.644 m line brightnesses and their ratio are functions of shock speed (), preshock density (), and preshock magnetic field strength () perpendicular to the shock front in general. We will present some general characteristics of the [Fe II] emission from radiative shocks using the shock code in the forthcoming paper (Koo et al. in preparation). Overall the preshock density is well constrained by the [Fe II] 1.534 to 1.644 m ratio.
The average [Fe II] 1.534 to 1.644 m ratio of Clump 1 is (Table 1), indicating the average postshock electron density of cm-3 (see § 3). This value should be much higher than the uncompressed preshock density for a radiative shock. For shock speeds of 80–250 km s-1 and G, the observed ratio implies –500 cm-3. For G, it becomes –300 cm-3 for the same shock speed range. We adopt 10 G, which is the median value of the maximum magnetic field strength for diffuse clouds (Crutcher et al., 2010). We take the shock speed to explain the observed line emission: if the velocity is considerably lower, e.g., 50 km s-1, we may expect to see H2 emission from molecular shocks instead of bright [Fe II] emission from atomic radiative shocks. If the velocity is siginificantly larger, e.g., 250 km s-1, the expected brightness normal to the shock front becomes brighter than the observed one, i.e., 1–2 ergs cm-2 s-1 sr-1, which is the intensity of the bright structure of Clump 1 obtained by Koo et al. (2007) after being smoothed to the beamsize () of the current observation and dereddended using mag. Note that the observed brightness is the integrated intensity along the line of sight and also beam-diluted. The brightness along the line of sight is much larger than the brightness normal to the shock front in general, so that it is not straightforward to give more stringent constraints without more complicated and detailed shock model calculations.
We perform a shock model calculation of the observed radial profiles assuming solar abundance (Asplund et al., 2009). In Figure 4, the red-solid and red-dashed lines represent the normalized [Fe II] 1.644 m intensity and the [Fe II] 1.534 to 1.644 m line ratio, respectively, for a spherically symmetric shock of 130 km s-1 propagating into an ambient medium of cm-3. The peak intensity of [Fe II] 1.644 m line profile is 8 ergs cm-2 s-1 sr-1. Note that these are profiles integrated along the line of sight and beam-diluted. For comparison, we also show the normalized [Fe II] 1.644 m intensity profile (black-dotted line) which is free of the beam dilution effect, where we can identify a sharp intensity contrast caused by a thin shock front. As in Figure 4, our shock model fits the [Fe II] 1.534 to 1.644 m ratio very well, whereas it does the [Fe II] 1.644 m intensity profile somewhat poorly. The observed intensity (filled circles) is much fainter than the modelled one (red-solid line) at and the width of the observed shell is much greater than what is modelled. These discrepancies imply that the structure is not spherically symmetric, with local enhancement of high-density medium in the region, and also that there may be multiple filaments inside the beam. We can fit the observed intensity profile and the peak brightness readily using multiple filaments of finite sizes. For example, the green-solid line in Figure 4 shows the modelled intensity profile when there are three filaments of 1.7 pc size separated by 0.03–0.04 pc from each other, and it is in a good agreement with the observed values. The current model is probably not a unique model for the radial profile, but multiple filaments seem to be unavoidable. A possible scenario for the origin of such multiple filaments is an episodic mass loss from the progenitor of G11.20.3 to the southeast-northwest direction. The similar distribution of He I in Clump 1 (Figure 1) also agrees with the circumstellar origin of the main [Fe II] emission of the clump, excluding SE-BHVF (see below). The dereddended line ratio of He I 1.083 to [Fe II] 1.644 m is 0.50, which is comparable to 0.59 previously observed in RCW 103 (Oliva et al., 1990).
The three [Fe II] clumps that we observe here are surrounded by hot X-ray gas (Figure 1). The density of the X-ray emitting gas is 13 cm-3, if we simply divide its ionization time scale = 6.7 1011 s cm-3 by the SNR age of 1,600 years (Roberts et al., 2003). The temperature of the X-ray emitting gas is 0.58 keV, so that its pressure becomes = 1.8 108 cm-3 K, where is the Boltzmann constant. For comparison, the average electron densities of clumps are 4,700–9,400 cm-3. Using the characteristics temperature of 5,000 K, we get the ionized gas pressure = 0.47–0.94 108 cm-3 K, which is about 1/4 to 1/2 of the pressure from the X-rays, indicating that the ionization fraction of [Fe II] emitting gas is low (e.g., Oliva et al., 1989). The total gas pressure, neglecting He, is , where , is the mean ionization fraction. This gives –0.34, consistent with our previous results from the shock model calculations
The southeastern shell of G11.20.3 has been detected by Spitzer mid-infrared IRAC 3–8 m and MIPS 24 m images (Lee, 2005; Reach et al., 2006; Pinheiro et al., 2011). Comparing the distributions of the mid-infrared images with those of the near-infrared [Fe II] and H2 line images (Koo et al., 2007), the brightest Clump 1 is less pronounced in the mid-infrared images, and a small molecular cloud located at 1′ southwest from Clump 1 (H2-pk1 in Koo et al. 2007) is prominent in the Spitzer IRAC images. This is consistent with the classification of G11.20.3 (H2-pk1) with molecular shocks by the ratios of the IRAC intensities (Reach et al., 2006), and the Spitzer mid-infrared spectrum, obtained at the position of this molecular cloud, shows a wealth of H2 pure rotational and ionic lines as well as bright dust continuum (Andersen et al., 2011). Unfortunately, the position of the molecular cloud is outside the [Fe II] clumps and not covered by our observations. For the Spitzer MIPS 24 m emission of Clump 1, although we expect a significant contribution from [Fe II] 24.52 and 25.99 m lines, it is not straightforward to determine the relative contributions from these ionic lines and dust continuum, due to various uncertainties in comparing the model spectrum to the observed brightness. Future imaging spectroscopic observations are needed for detailed study of the mid-infrared emission.
An interesting finding of our observations is the detection of SE-BHVF which is Doppler shifted by 440 100 km s-1 around the northeastern corner of Clump 1 (Figures 1 and 2c). Assuming that SE-BHVF is located at the boundary of 2′ radius of the SNR shell with its projected distance of 1.7′ from the center, its de-projected expanding velocity is 900 km s-1 with respect to the +45 km s-1 systematic velocity of G11.20.3 (Green et al., 1988). This expanding velocity is comparable to the velocities of the highly blueshifted ( 1000 km s-1) ejecta knots previously detected around the center of G11.20.3 (Moon et al., 2009), which is suggestive that SE-BHVF has the same origin as the central knots. If G11.20.3 is indeed the remnant of the supernova explosion in AD 386 (Clark & Stephenson, 1977), the observed ejecta velocities indicate that they have been considerably decelerated. The existence of SE-BHVF in Clump 1 of the southeastern shell is consistent with the previous interpretations that the SN ejecta in G11.20.3 was expelled mainly in the southeast-northwest direction, given the existence of the northwestern filaments which are most likely of the ejecta origin (Koo et al., 2007; Moon et al., 2009).
5. Conclusion
We perform near-infrared (1.0–1.8 m) integral-field spectroscopic observations of the southeastern shell of the young core-collapse SNR G11.20.3 using our own instrument setup that provides an unprecedented integral-field size in the wavebands. The shell is known to have brightest near-infrared [Fe II] emission of all Galactic SNRs, and is presumed to be a unique mixture of progenitor’s circumstellar material and supernova ejecta. Our data cube populated with multiple [Fe II] transitions makes it possible to study the detailed two-dimensional distributions of the line intensities, velocities, electron densities, and extinction. Based on this information, we compare the observed results with those predicted by SNR shock models and obtain shock parameters in this region of the SNR. The observed properties of the brightest clump can be explained by multiple shocked thin filaments of circumstellar material. This, together with the discovery of the faint high-velocity component, suggests that the southeastern shell of G11.20.3 is indeed a mixture of circumstellar material and ejecta, with the former being the dominant component. Future studies with improved sensitivity and resolutions (both spatial and spectral) are needed to understand how the two components are interacting.
This work is supported by a Grant-in-Aid for Japan Society of Promotion of Science (JSPS) fellows (No. 2301322). H.-G.L. was partly supported from Early Research Award to D.-S.M. by the Ministry of Economic Development and Innovation (MEDI) of the Ontario Provincial Government in Canada. D.-S.M. acknowledges support from the Natural Science and Engineering Research Council (NSERC) of Canada. This paper was studied with the support of the Ministry of Education Science and Technology (MEST) and the Korean Federation of Science and Technology Societies (KOFST). B.-C.K. was supported by the National Research Foundation of Korea (NRF) Grant (NRF-2010-616-C00020). FISICA was supported by the Florida Space Research Initiative.
Facility: Mayall (FLAMINGOS)
References
- Andersen et al. (2011) Andersen, M., Rho, J., Reach, W. T., Hewitt, J. W., & Bernard, J. P. 2011, ApJ, 742, 7
- Asplund et al. (2009) Asplund, M., Grevesse, N., Sauval, A. J., & Scott, P. 2009, ARA&A, 47, 481
- Becker et al. (1985) Becker, R. H., Markert, T., & Donahue, M. 1985, ApJ, 296, 461
- Clark & Stephenson (1977) Clark & Stephenson, 1977, The Historical Supernovae (New York: Pergamon)
- Coelho et al. (2005) Coelho, P., Barbuy, B., Meléndez, J., Schiavon, R. P., & Castilho, B. V. 2005, A&A, 443, 735
- Cox & Raymond (1985) Cox, D. P., & Raymond, J. C. 1985, ApJ, 298, 651
- Crutcher et al. (2010) Crutcher, R. M., Wandelt, B., Heiles, C., & Falgarone, E., 2010, ApJ, 725, 466
- Deb & Hibbert (2011) Deb, N., C. & Hibbert, A. 2011, A&A, 536, 74
- Draine (2003) Draine, B. T. 2003, ARA&A, 41, 241
- Eikenberry et al. (2006) Eikenberry et al. 2006, Proc. SPIE, 6269, 626917
- Elston. (1998) Elston, R. 1998, Proc. SPIE, 3354, 404
- Green et al. (1988) Green, D. A., Gull, S. F. , Tan, S. M., & Simon, A. J. B. 1988, MNRAS, 231, 735
- Kaspi et al. (2001) Kaspi, V. M., Roberts, M. E., Vasisht, G., Gotthelf, E. V., Pivovaroff, M., & Kawai, N. 2001, ApJ, 560, 371
- Koo et al. (2007) Koo, B.-C., Moon, D.-S., Lee, H.-G., Lee, J.-J., & Matthews, K. 2007, ApJ, 657, 308
- Lee (2005) Lee, H.-G. 2005, J. Korean Astron. Soc., 38, 385
- Moon et al. (2009) Moon, D.-S., Koo, B.-C., Lee, H.-G., Matthews, K., Lee, J.-J., Pyo, T.-S., Seok, J. Y., & Hayashi, M. 2009, ApJ, 703, 81
- Oliva et al. (1989) Oliva, E., Moorwood, A. F. M., & Danziger, I. J. 1989, A&A, 214, 307
- Oliva et al. (1990) Oliva, E., Moorwood, A. F. M., & Danziger, I. J. 1990, A&A, 240, 453
- Pinheiro et al. (2011) Pinheiro Goncalves, D., Noriega-Crespo, A., Paladini, R., Martin, P. G., & Carey, S. J. 2011, AJ, 142, 47
- Quinet et al. (1996) Quinet, P., Le Dourneuf, M., & Zeippen, C. J. 1996, A&AS, 120, 361
- Ramsbottom et al. (2007) Ramsbottom, C. A., Hudson, C. E., Norrington, P. H., & Scott, M. P. 2007, A&A, 475, 765
- Raymond (1979) Raymond, J. C. 1979, ApJS, 39, 1
- Reach et al. (2006) Reach, W. T., Rho, J., Tappe, A., Pannuti, T. G., Brogan, C. L., Churchwell, E. B., Meade, M. R., Babler, B., Indebetouw, R., & Whitney, B. A. 2006, AJ, 131, 1479
- Roberts et al. (2003) Roberts, M. S. E., Tam, C. R., Kaspi, V. M., Lyutikov, M., Vasisht, G., Pivovaroff, M., Gotthelf, E. V., & Kawai, N. 2003, ApJ, 588, 992
- Stephenson & Green (2002) Stephenson, F. R. & Green, D. A. 2002, Historical Supernova and Their Remnanats (Oxford: Clarendon)

| Line | Clump 1 | Clump 2 | Clump 3 | ||||
|---|---|---|---|---|---|---|---|
| Transition | (m) | Observed | Dereddened | Observed | Dereddened | Observed | Dereddened |
| He I | 1.083 | 3.5 0.8 | 50.0 11.2 | ||||
| [Fe II] | 1.257 | 30.3 1.9 | 136 8.6 | 25.9 2.1 | 136 11.2 | 22.5 1.9 | 136 11.4 |
| [Fe II] | 1.295 | 3.4 0.8 | 12.7 3.1 | 3.5 1.2 | 14.7 5.2 | ||
| [Fe II] | 1.321 | 15.2 1.4 | 49.4 4.4 | 11.2 2.0 | 41.0 7.2 | 9.8 2.0 | 40.0 8.4 |
| [Fe II] | 1.328 | 5.7 1.4 | 17.8 4.3 | ||||
| [Fe II] | 1.534 | 13.7 0.9 | 19.2 1.2 | 12.8 2.4 | 18.5 3.4 | 8.5 0.9 | 12.7 1.4 |
| [Fe II] | 1.600 | 6.1 0.9 | 7.0 1.0 | 9.0 1.7 | 10.4 2.0 | 8.5 1.9 | 9.9 2.2 |
| [Fe II] | 1.644 | 100 5.1 | 100 5.1 | 100 9.7 | 100 9.7 | 100 5.5 | 100 5.5 |
| [Fe II] | 1.664 | 4.4 1.1 | 4.1 1.0 | 4.7 1.3 | 4.4 1.2 | ||
| [Fe II] | 1.677 | 8.9 0.6 | 8.2 0.6 | 11.6 1.8 | 10.5 1.6 | 9.3 0.9 | 8.3 0.8 |
| [Fe II] | 1.712 | 3.4 0.4 | 2.8 0.4 | ||||
| [Fe II] | 1.745 | 3.8 0.6 | 2.9 0.5 | ||||
| [Fe II] | 1.798 | 6.0 1.2 | 4.1 0.8 | 9.7 2.9 | 6.4 1.9 | ||
Note. — Normalized to make the peak intensity of [Fe II] 1.644 m line of each clump 100.