Energy levels of Th+ between 7.3 and 8.3 eV
Abstract
Using resonant two-step laser excitation of trapped 232Th+ ions, we observe 43 previously unknown energy levels within the energy range from to eV. The high density of states promises a strongly enhanced electronic bridge excitation of the 229mTh nuclear state that is expected in this energy range. From the observation of resonantly enhanced three-photon ionization of Th+, the second ionization potential of thorium can be inferred to lie within the range between 11.9 and 12.3 eV. Pulsed laser radiation in a wide wavelength range from to nm is found to provide efficient photodissociation of molecular ions that are formed in reactions of Th+ with impurities in the buffer gas, leading to a significantly increased storage time for Th+ in the ion trap.
pacs:
32.30.Jc 32.80.Rm 42.62.Fi, 37.10.TyI Introduction
While the energy scales of radiative transitions in the atomic electron shell and within the nucleus are usually separated by several orders of magnitude, the nuclear transition of 229Th at about 8 eV Beck:2007 ; Beck:2009 offers a rare opportunity to study the regime of near-degeneracy between both types of excitations. In this case, the coupling between the electronic and nuclear moments through hyperfine interaction may lead to a strong enhancement of radiative nuclear excitation and decay rates in so called electronic bridge processes Krutov:1968 ; Morita:1973 ; Crasemann:1973 ; Matinyan:1998 ; Tkalya:2003 . Taking into account the known properties of the low-energy nuclear transition in 229Th – a magnetic dipole transition at eV – one may consider different atomic configurations for an experimental study of these effects. In neutral Th, the ionization potential of 6.3 eV Goncharov:2006 lies below the nuclear excitation energy, so that photoionization or internal conversion compete with electronic bridge excitation or decay, respectively. This is not the case for positive thorium ions of all charge states, because of their higher ionization potentials. With a complex electronic level structure resulting from three valence electrons and with an ionization potential of about 12 eV, Th+ seems to offer the highest probability of finding suitable electronic transitions close to the nuclear resonance. Alternative options may be considered in Th3+ or Th89+. Th3+ possesses a single valence electron and the level density around 8 eV is low, but, it permits laser cooling and sensitive high-resolution spectroscopy Campbell . In hydrogen-like Th89+ the strong hyperfine coupling of the spins of the nucleus and the electron is expected to lead to a big enhancement of the nuclear radiative transition rate Karpeshin .
A comprehensive analysis of the 13 lowest three-electron configurations of Th+, consisting of 5f, 6d, 7s and 7p electrons has identified 461 of the 497 levels predicted for these configurations Zalubas:1974 . Experimental energy values are published for 271 levels of even parity up to excitation energy and for 236 levels of odd parity up to excitation energy Wyart:web . Taking higher electron configurations into account, one may expect a high number of yet unidentified levels above 7 eV and in the vicinity of the 229Th nuclear transition energy. Based on relativistic Hartree-Fock calculations it has been shown that the energy level density in Th and Th+ increases approximately exponentially with the excitation energy Dzuba:2010 . No systematic experimental search for levels of Th+ that are suitable for electronic bridge excitation has been reported so far.
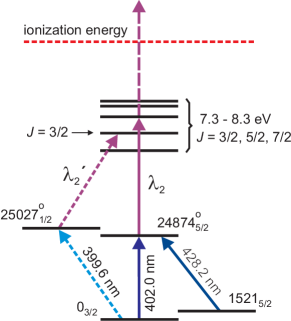
Here we present the results of an experiment with two-step laser excitation of trapped 232Th+ ions, covering the excitation energies between 7.3 and 8.3 eV, i.e. the -search range for the nuclear excitation according to Refs. Beck:2007 ; Beck:2009 . Previously, laser excitation of Th+ has been reported on a few transitions at lower excitation energy Kaelber:1989 ; Herrera:2012 . In our experiment, the first excitation step is done on the resonance line at 402 nm wavelength which couples the (6d27s)J=3/2 ground state with the (6d7s7p)J=5/2 state at 24874 cm-1. In order to obtain information on the angular momentum of the excited states, the line at 399.6 nm to the (5f6d2)J=1/2 state at 25027 cm-1 is used alternatively. In the following we label states by their energy in cm-1 and their total angular momentum (see Fig. 1). The second excitation step requires a tunable laser that covers the wavelength range between 237 and 294 nm. For this, we employ the third harmonic radiation of a pulsed titanium sapphire (Ti:Sa) laser. In future experiments, the same laser systems can be used to search for the two-photon electronic bridge excitation of 229Th+ PorsevPeik:2010 .
II Experimental
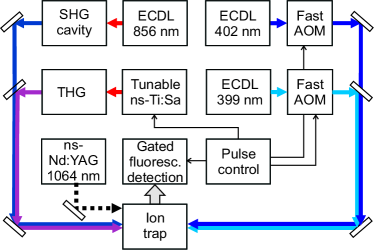
We use a segmented linear Paul trap, described in Herrera:2012 , to trap a cloud of around buffer-gas cooled 232Th+ ions. A schematic of the experimental setup is shown in Fig. 2. The trap is loaded by ablating a metallic thorium target using a Nd:YAG laser emitting pulses with an energy of . The light for the first excitation step is provided by an extended-cavity diode laser (ECDL) with a maximum output power of at , shaped into pulses of typically length by a fast acousto-optical modulator (AOM). The decay of the intermediate state populates several metastable levels. We actively deplete the lowest of these levels () with a frequency doubled ECDL continuously emitting light at . By using argon at pressure as the buffer gas, the remaining levels are collisionally quenched with sufficient efficiency Herrera:2012 .
The light for the second excitation step is produced by a pulsed nanosecond Ti:Sa laser (Photonics Industries model TU-L) that is synchronized with the pulses from the ECDL. A system for single-pass third-harmonic generation (THG) provides a tuning range from to . After mode cleaning and shaping the beam to a diameter of , an average power of is typically available at the trap. At a repetition rate of and a nominal pulse length of FWHM, this corresponds to peak power. The emission spectrum typically consists of about 10 to 20 longitudinal modes separated by the free spectral range of the laser resonator. The beams from the Ti:Sa and ECDL lasers are superposed and aligned along the axis of the ion trap.
The fluorescence of the excited Th+ ions is detected using photomultipliers (PMT) with different spectral response. One photomultiplier (PMT1) serves to monitor the population in the intermediate state and is equipped with a bandpass filter that transmits only wavelengths near 405 nm, within a 10 nm wide range. A second photomultiplier (PMT2) detects fluorescence resulting from the decay of higher energy levels excited by the second excitation step. It is sensitive to wavelengths between 300 and , with a notch filter that blocks the fluorescence from the decay of the intermediate state. A third PMT provides sensitivity in the vacuum-ultraviolet range from 110 to 200 nm. Fast gated integrators are used to evaluate the PMT signals only during a limited detection window that begins after the end of the excitation pulses and has a duration of about . The signals are integrated over several hundred pulses and read out by the control computer.
III Newly observed states
In order to observe excited states in resonant two-photon excitation, we tune the Ti:Sa laser frequency by adjusting the intracavity diffraction grating with a stepper motor and a piezoelectric transducer for fine tuning. At the same time, the ECDL is scanned over the Doppler-broadened line of the transition. In Figs. 3 and 4 we give example spectra where the Ti:Sa laser is held such that the frequencies of several longitudinal modes can excite transitions from the intermediate level to a highly excited state. We observe fluorescence signals from the high-lying states dominantly with the PMT that is sensitive in the visible and near-UV region, because the dense electronic level structure favors a decay through several intermediate states. Due to the short lifetimes of the states involved, the emission of fluorescence occurs mostly within a decay time of about 100 ns after the excitation pulses.
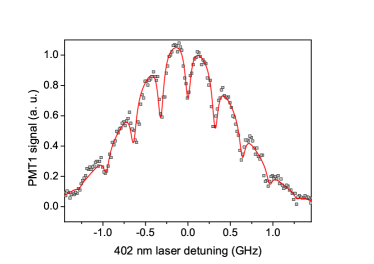
Figure 3 presents the fluorescence signal detected with PMT1 around 402 nm as a function of the detuning of the ECDL driving the first excitation step. The Doppler-broadened spectrum shows multiple dips which demonstrate the depletion of the intermediate level population for the velocity classes that are resonantly excited to a high-lying state by longitudinal modes of the Ti:Sa laser. The Ti:Sa laser provides sufficient power to saturate almost all observed transitions and the resonant velocity classes show a significant depletion of the intermediate state population. First and second excitation steps have different excitation wavelengths and with different resulting Doppler sensitivities , where is the wave vector and is the velocity of interacting ions. When scanning the ECDL, the depletion dips occur at a frequency spacing given by .
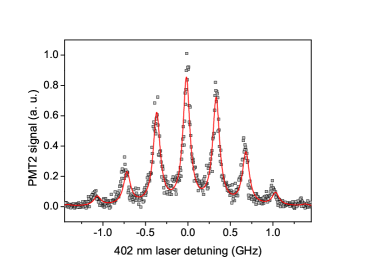
The main indicator for the two-photon excitation, however, is the fluorescence emission of the velocity groups transferred to the upper excited state by the Ti:Sa laser. Figure 4 shows the fluorescence signal as a function of the ECDL detuning, detected with PMT2 where 402-nm light is blocked. For better resolution, the spectrum shown here is taken under conditions where the second excitation step is not saturated. Fluorescence detection in the vacuum-ultraviolet (VUV) was tested with some of the transitions and VUV emission was observed for excitation of the level at 60380.1 cm-1. The predominant emission of photons in the visible and near-UV regions results from decay channels through several intermediate states.
During the search for two-photon transitions, we have also observed about 150 single-photon transitions that are directly excited by the Ti:Sa laser. All these lines are among those listed in Ref Zalubas:1974 . They originate either directly from the ground state (21 transitions) or from low-lying metastable levels (mainly from those with energies below 5000 cm-1) that are populated by spontaneous decay from the level or through buffer-gas collisions. They do not exhibit the characteristic spectra shown in figures 3 and 4 and are therefore easily distinguished.
| Level | Level | ||||
| (cm-1) | (kW/cm2) | (cm-1) | (kW/cm2) | ||
| 58875.5 | 200 | 64150.3 | 3/2 | 2.8 | |
| 59387.1 | 150 | 64560.4 | 3/2 | 7.0 | |
| 59477.4 | 3/2 | 0.62 | 64813.7 | 0.32 | |
| 59803.0 | 0.28 | 64860.4∗ | >450 | ||
| 60380.1 | 3/2 | 2.2 | 64920.1 | 21 | |
| 60618.6 | 3/2 | 11 | 65037.7 | 3/2 | 6.5 |
| 60721.3 | 2.0 | 65144.4 | 1.1 | ||
| 61032.4 | 3/2 | 0.34 | 65191.1∗ | >330 | |
| 61388.0 | 0.1 | 65730.4 | 3/2 | 0.55 | |
| 61428.6 | 0.54 | 65738.1 | 44 | ||
| 61726.3 | 3/2 | 4.0 | 65799.6 | 3/2 | 2.9 |
| 61963.6 | 3/2 | 0.36 | 65910.0 | 9.8 | |
| 62307.2 | 5.6 | 65946.9 | 1.3 | ||
| 62373.8 | 3/2 | 63 | 66052.0 | 20 | |
| 62477.0 | 8.9 | 66141.2∗ | >110 | ||
| 62560.1 | 2.7 | 66333.7 | 3/2 | 16 | |
| 62562.2 | 3/2 | 5.6 | 66558.0 | 0.3 | |
| 62753.1 | 7.7 | 66609.0 | 4.2 | ||
| 63257.5 | 0.66 | 66702.9 | 3/2 | 64 | |
| 63298.4 | 27 | 66831.1 | 3/2 | 0.28 | |
| 63557.7 | 19 | 66855.6 | 15 | ||
| 64122.0 | 10 | 67066.2∗ | >22 |
While scanning the Ti:Sa laser over the range from 237 to , two-photon excitations to 44 energy levels in the investigated energy range of 7.30 to were observed (see table 1). Only one of these levels was previously known, and its tabulated total energy value of Zalubas:1974 is in agreement with our measurement. We estimate an uncertainty of for the total energy, predominantly limited by the uncertainty of identifying the center of the Ti:Sa laser spectrum based on the reading of a Fizeau wavemeter.
For each of the observed levels, we investigated the dependence of the fluorescence signal on the intensity of the Ti:Sa pulse. For almost all transitions the fluorescence saturates when high pulse intensities are applied, so that we can extract a saturation parameter by fitting with the expression . In contrast to a two-level case, does not describe the overall population of the upper level, because this depends on the rates of different decay channels back to the ground state. All of the measured values of are within three orders of magnitude and within the range expected for electric dipole transitions, taking into account the Doppler broadening, the laser spectral distribution and frequency modulation resulting from micromotion of the ions in the trap Herrera:2012 . For four transtions we can only give a lower limit for because saturation was not observed with the available laser intensity.
Assuming the observed transitions to have electric dipole character and taking into account the angular momentum and odd parity of the intermediate state, selection rules require the levels in table 1 to have even parity and angular momenta of , or . Four possible exceptions are the levels marked with an asterisk where saturation was not measured and where we can not exclude magnetic dipole or electric quadrupole character of the second excitation step.
For each level, we have tested the alternative excitation path through the intermediate level (see Fig. 1) by using the ECDL with a wavelength of . In this way, levels that are excited via both intermediate states with and are identified as having an angular momentum and have been marked accordingly in table I. For all these transitions there is no uncertainty in the electric dipole assignment based on the observed saturation intensities.
The density of observed levels agrees with earlier ab-initio calculations Porsev1+:2010 , which predicted 9 levels with in the energy range from to , where we observed 8 such levels. However, since the calculations give energies only to within an uncertainty of about 10% and because the experiment does not provide complete information on the electronic configuration, a direct comparison between observed and calculated levels is not possible.
IV Level spacing statistics
At the excitation energies investigated here, a strong mixing of different three-electron configurations of Th+ is expected. In this case the well known approximative coupling schemes for the single-electron angular momenta are not applicable, and parity and total angular momentum are the only quantum numbers that characterize the energy levels. An empirical indication on the validity of this statement can be obtained from the distribution of adjacent level spacings, because in complex atomic and nuclear spectra a repulsion of energy levels characterized by the same parity and same value of is observed Rosenzweig:1960 . This level repulsion gives rise to a Wigner distribution of level spacings. In contrast, an ensemble of uncorrelated levels with different values of or another ”hidden” angular momentum quantum number would show a Poisson distribution of spacings.
In order to perform the analysis, we calculate the histogram of spacings between adjacent levels, normalized to the average observed level spacing and fit it with the Brody distribution Brody:1981
| (1) | |||
and is the Gamma function.
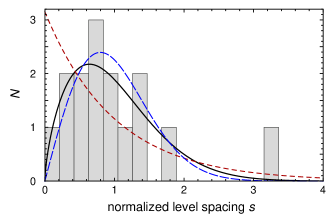
For the parameter , the Brody distribution takes on the form of the Poisson distribution expected for uniformly random distributed, non-interacting levels. For it becomes identical to the Wigner distribution expected when the level repulsion is strong. Analyzing the set of newly observed states, we find significant repulsion indicated by (see Fig. 5). The extracted value of depends somewhat on the binning of the histogram, but the variation is limited with a standard deviation of . To test the statistical significance of this result, we have performed a Monte-Carlo simulation for a Poissonian level distribution. Even for the low available number of 15 spacings, a Brody parameter was found to appear randomly with less than 5% probability. The trend towards a Wigner distribution of level spacings at high excitation energies in Th+ is also supported by the previously available data Wyart:web . We perform the same analysis on subsets of 16 adjacent even-parity levels with over the range from to and find the Brody parameter growing from near the ground state to at the highest energies. This indicates the increase of configuration mixing with growing excitation energy in the level scheme of Th+. Furthermore, it may lead to the appearance of quantum chaotic behaviour, as has been theoretically described for the case of cerium, the lanthanide neighbor element to thorium in the f-block of the periodic table Flambaum:1999 .
V Multi-photon ionization in trapped Th+ ions
When the ions are irradiated with resonant pulses from the 402 nm ECDL and the Ti:Sa laser with intensities above (see Table I) and radiation wavelengths shorter than 270 nm, we observe a fast exponential decay of the Th+ fluorescence signals. The time constant of this decay is much shorter than the typical storage time ( s) observed in our trap in the absence of two-step excitation (see Section VI). We investigated the origin of the decay by ramping down the amplitude of the trap rf voltage and detecting the release of ions with a channeltron detector, so that information on the charge-to-mass ratio is obtained Zimmermann:2012 . Correlated with the decay of the Th+ signals, we observed the appearance of a fraction of Th2+. At the usual stationary operation conditions of our trap, both charge states are trapped stably. We attribute the formation of Th2+ to a resonantly enhanced multi-photon ionization (see Fig. 1), occuring via the absorption of further photons from the Ti:Sa radiation.
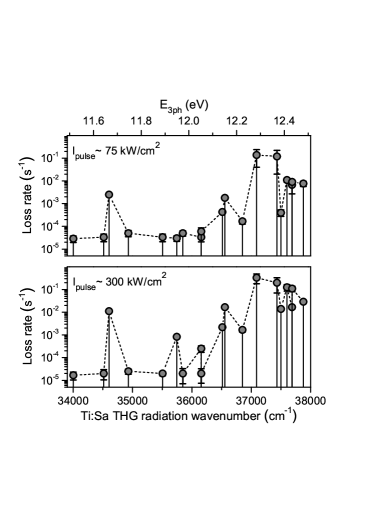
Figure 6 shows measured loss rates of the trapped Th+ ions as a function of the wavenumber of the third harmonic of the Ti:Sa laser radiation, which is tuned to the observed levels (see Table I) for the second excitation step, while the 402 nm ECDL scans over the Doppler profile as described in Section 3. The experiment is carried out for the levels between 58875.5 and 62753.1 cm-1 which corresponds to third harmonic radiation wavelengths from 264 to 294 nm. Results are given for two different pulse intensities of the Ti:Sa laser.
For Ti:Sa laser wavenumbers above 36500 cm-1 we observe formation of Th2+ ions with a rate above s-1 for all studied levels. This wavenumber range corresponds to excitation energies above 12.14 eV, calculated as the sum of the energies of one photon from the 402 nm ECDL and two UV photons from the Ti:Sa laser. In the following, this quantity is denoted as .
In the region eV no formation of Th2+ ions is observed for the lower intensity for most of the measurements. An exception is the transition to the state at 59477.4 cm-1 (corresponding to eV). This can be explained with a four-photon process where Th+ is excited from the level 59477.4 cm-1 to a bound state close to the ionization threshold and is then ionized to Th2+ through absorption of an additional photon. For the state 60618.6 cm-1 ( eV) ionization appears only for high pulse intensity. The excitation of the state 61032.4 cm-1 ( eV) does not lead to ionization but Th2+ ions appear when the UV radiation of the Ti:Sa laser is detuned out of resonance by cm-1. For these two transitions an ionization through a four-photon process may also be assumed.
Interpreting the rapid loss of Th+ for wavenumbers above 36500 cm-1 as the onset of three-photon ionization, one can deduce an ionization potential of Th+ slightly above 12.0 eV. The possible mixture of three- and four-photon ionization, however, does not allow us to observe a clear threshold in the ionization rate. Because of this complexity we infer from the data presented in Fig. 6 that the ionization potential lies in the range between 11.9 and 12.3 eV. A more precise experimental determination would be feasible by employing an independently tunable laser for the third excitation step close to the ionization threshold.
Ab initio calculations of the second ionization potential of thorium obtained values in the range between 11.08 and 12.87 eV Harding ; Liu ; Cao . To the best of our knowledge no experimental measurement of this quantity has been published before. Two values sometimes cited as ”experimental” are actually the results of extrapolations based on spectral data from other elements: eV Finkelnburg and eV Sugar , and are in agreement with our observations.
VI Formation and photodissociation of molecular ions with T
Previous studies have shown that Th+ ions in the gas phase are highly reactive with compounds of oxygen (O2, H2O, NO, CO2, etc.) and hydrocarbons Johnsen:1974 ; Joaquim:1996 ; Cornehl:1997 . In the presence of oxygen, the ThO+ molecule is formed, characterized by a double bond of 9.1 eV dissociation energy Goncharov:2006 . The remaining single valence electron gives rise to further reactions leading to ThOH+, ThO and ThO2H+ Cornehl:1997 ; Zhou:2010 . In the presence of CH4, Th+ will react to ThCH, possessing a dissociation energy of 4.8 eV Joaquim:1996 . In our experiment, ultra-high vacuum conditions with a base pressure in the Pa range are ensured, with water and hydrocarbons as the dominant residual gases, and highly purified buffer gas (Ar with less than impurity content) is used. Nevertheless, the fluorescence signals from Th+ are only observable for a few hundred seconds Herrera:2012 due to the formation of molecular compounds. Similar observations have been made in other experiments with trapped Th+ and Th3+ ions Kaelber:1992 ; Churchill:2011 .
When the trapped ions are exposed to Ti:Sa laser radiation with an intensity above the observation time for Th+ fluorescence is greatly extended to values of more than . The effect was observable for practically all laser wavelengths between 237 and 289 nm, i.e. nearly for the full wavelength range studied here during the search for two-step excitation of Th+. It is in fact possible to let the fluorescence decay to near zero with the Ti:Sa laser switched off over a time of 30 minutes and then recover nearly the full original signal by turning the laser on. This can be attributed to photodissociation of trapped molecular Th-compounds. At lower laser intensity a wavelength dependence of the photodissociation rate appears, but this was not the subject of further study. From the binding energies given above, it can be seen that photodissociation of ThCH and , can only be obtained as a two- or three-photon process, respectively, in this wavelength range. Because the molecular ions remain trapped, however, even a photodissociation rate as low as s-1 is sufficient to maintain a significant fraction of Th+ ions in the trap.
To gain information on the molecular species that are formed, we applied an additional alternating voltage of tunable frequency to two electrodes of the central segment of the trap. This ejects ions with specific mass-to-charge ratios from the trap when the applied frequency is equal to the ions’ secular motional frequency. Molecular ions are allowed to form by turning off the Ti:Sa laser. Certain excitation frequencies prevent the recovery of the fluorescence signal when the Ti:Sa is switched on again. These correspond to masses between 246 and 259 amu, including , , and , all of which are likely products of reactions with impurities in the buffer gas. Applying the secular frequency corresponding to a mass of 265 amu does not suppress the fluorescence recovery, indicating the absence of .
Given that the formation of several reaction products is expected Johnsen:1974 ; Joaquim:1996 ; Cornehl:1997 , it is remarkable that photodissociation with a single laser leads to the establishment of an essentially stable Th+ fraction. It seems that no stable molecular ion is produced here that can not be dissociated with the laser. This observation is of great practical importance for the planned experiments with the radioactive 229Th+ ions where the amount of substance available for loading the trap will be limited.
VII Prospects for electronic bridge excitation
Finally, we discuss an order of magnitude estimate of an electronic bridge excitation rate that can be expected with the experimental setup presented here. It is assumed that radiation of spectral width drives an electronic transition of width , that is significantly larger than the linewidth of the isolated nuclear transition . denotes the frequency difference between electronic and nuclear resonance. Under the assumption that , the electronic bridge excitation rate is enhanced in comparison to a direct excitation of the nucleus by a factor , where is the magnetic dipole coupling energy between electron and nucleus (in frequency units) tkalya1 ; Tkalya:2003 . The orders of magnitude for these parameters are given by Hz, Hz, Hz tkalya1 and Hz, according to the level density observed here. This leads to an enhancement in the range . In a calculation of the frequency-dependence of the enhancement factor for resonant excitation of the nuclear transition based on ab-initio atomic structure calculations, Porsev at al. PorsevPeik:2010 find a minimum value of in a region far from strong electronic resonances and higher values elsewhere.
To calculate the excitation probability we take the following parameters of our system: pulse duration ns, Hz (the effective linewidth of the nuclear resonance), Hz (determined by the inhomogenous linewidth of the ion cloud), and W/cm2. This yields an excitation probability per laser pulse. In an experiment with a laser repetition rate of Hz and with more than ions, this should make the detection of the nuclear excitation feasible.
While scanning the Ti:Sa laser over the search range for the nuclear excitation the electronic resonances need to be taken into account. Single-photon excitation with the Ti:Sa laser from the ground state or a low-lying metastable level reduces the population of the intermediate state and consequently the obtainable electronic bridge excitation rate. Another critical point is the resonantly enhanced three-photon ionization discussed in Sect. V because it leads to a loss of trapped 229Th+. This should be avoided in the interest of using a radionuclide source of low activity. Because the multi-photon ionization has a nonlinear intensity dependence, it can be suppressed by reducing the Ti:Sa pulse power for wavelengths that are close to resonance with an electronic excited state. If the nuclear transition lies in the affected range of excitation energies, the small value of ensures that a high electronic bridge excitation rate can be obtained nevertheless.
The position of the isomer energy relative to the electronic level structure will also determine the lifetime and radiative decay of the isomeric state. Three possible scenarios can be envisaged for the detection of the nuclear excitation. In the case of the isomer undergoing direct radiative decay, delayed VUV photons can be detected between the laser pulses. More likely, the strongly enhanced electronic bridge processes will dominate the decay of the isomer and will lead to the emission of characteristic photon cascades from the electron shell. The signal will be recorded with time resolved fluorescence detection in different spectral channels. Test experiments with 232Th+ under identical laser parameters can be used to distinguish the electronic bridge nuclear decay from any purely electronic fluorescence process. Finally, if the lifetime of the isomer is sufficiently long to allow population of 229mTh+ to build up over several laser pulses, the most sensitive detection method will be high resolution spectroscopy of the 402 nm transition that will detect these ions based on their modified nuclear spin and hyperfine structure Peik:2003 .
Acknowledgements.
We thank Chr. Tamm, A. Yamaguchi and K. Zimmermann for helpful discussions and contributions to the experimental setup and T. Leder for providing expert technical support. OAHS acknowledges support from DAAD (Grant No. A/08/94804), ITCR (Grant No. 83-2008-D), and MICIT (Grant No. CONICIT 079-2010).References
- (1) B. R. Beck, J. A. Becker, P. Beiersdorfer, G. V. Brown, K. J. Moody, J. B. Wilhelmy, F. S. Porter, C. A. Kilbourne, R. L. Kelley, Phys. Rev. Lett. 98, 142501 (2007).
- (2) B. R. Beck, J. A. Becker, P. Beiersdorfer, G. V. Brown, K. J. Moody, C. Y. Wu, J. B. Wilhelmy, F. S. Porter, C. A. Kilbourne, R. L. Kelley, Lawrence Livermore National Laboratory, Internal Report LLNL-PROC-415170 (2009).
- (3) V. A. Krutov, V. N. Fomenko, Ann. Physik 7, 21, 291 (1968).
- (4) M. Morita, Prog. Theor. Phys. 49, 1574 (1973).
- (5) B. Crasemann, Nucl. Instrum. Meth. 112, 33 (1973).
- (6) S. Matinyan, Physics Reports 298, 199 (1998).
- (7) E. V. Tkalya, Physics-Uspekhi 46, 315 (2003).
- (8) V. Goncharov, M. C. Heaven, J. Chem. Phys. 124, 064312 (2006).
- (9) C. J. Campbell, A. G. Radnaev, A. Kuzmich, Phys. Rev. Lett. 106, 223001 (2011).
- (10) F. F. Karpeshin, S. Wycech, I. M. Band, M. B. Trzhaskovskaya, M. Pfützner, J. Zylicz, Phys. Rev. C 57, 3085 (1998).
-
(11)
R. Zalubas, C. H. Corliss, J. Res. Natl. Bur. Stand. Sect. A 78A, 163 (1974), [http://nistdigitalarchives.contentdm.oclc.org/cdm/ref/
collection/p13011coll6/id/63425]. - (12) J. Blaise, J.-F. Wyart, Selected constants, energy levels and atomic spectra of actinides, [http://www.lac.u-psud.fr/Database/Contents.html].
- (13) V. A. Dzuba, V. V. Flambaum, Phys. Rev. Lett. 104, 213002 (2010).
- (14) W. Kälber, J. Rink, K. Bekk, W. Faubel, S. G oring, G. Meisel, H. Rebel, and R. C. Thompson, Z. Phys. A 334, 103 (1989).
- (15) O. A. Herrera-Sancho, M. V. Okhapkin, K. Zimmermann, Chr. Tamm, E. Peik, A. V. Taichenachev, V. I. Yudin, P. Głowacki, Phys. Rev. A 85, 033402 (2012).
- (16) S. G. Porsev, V. V. Flambaum, E. Peik, Chr. Tamm, Phys. Rev. Lett. 105, 182501 (2010).
- (17) S. G. Porsev, V. V. Flambaum, Phys. Rev. A 81, 042516 (2010).
- (18) N. Rosenzweig, C. E. Porter, Phys. Rev. 120, 1698 (1960).
- (19) T. A. Brody, J. Flores, J. B. French, P. A. Mello, A. Pandey, S. S. M. Wong, Rev. Mod. Phys. 53, 385 (1981).
- (20) V.V. Flambaum, A.A. Gribakina, G.F. Gribakin, I.V. Ponomarev, Physica D 131, 205 (1999).
- (21) K. Zimmermann, M. V. Okhapkin, O. A. Herrera-Sancho, E. Peik, Appl. Phys. B 107, 883 (2012).
- (22) J. H. Harding, P. J. D. Lindan, N. C. Pyper, J. Phys.: Condens. Matter 6, 6485 (1994).
- (23) W. J. Liu, W. Küchle, M. Dolg, Phys. Rev. A 58, 1103 (1998).
- (24) X. Y. Cao, M. Dolg, Mol. Phys. 101, 961 (2003).
- (25) W. Finkelnburg, W. Humbach, Naturwissenschaften 42, 35 (1955).
- (26) J. Sugar, cited in: D. L. Hildenbrand, L. V. Gurvich, V. S. Yungman, The chemical thermodynamics of actinide elements and compounds, Part 13: The gaseous actinide ions, IAEA, Vienna, 1985.
- (27) R. Johnsen, F. R. Castell, and M. A. Biondi, J. Chem. Phys. 61, 5404 (1974).
- (28) H. H. Cornehl, R. Wesendrup, M. Diefenbach, H. Schwarz, Chem. Eur. J. 3, 1083 (1997).
- (29) J. Marçalo, J. P. Leal, A. P. de Matos, Int. J. Mass Spectrom. 157, 265 (1996).
- (30) J. Zhou, H. B. Schlegel, J. Phys. Chem. A 114, 8613 (2010).
- (31) W. Kälber, G. Meisel, J. Rink, R. C. Thompson, J. Mod. Opt. 39, 335 (1992).
- (32) L. R. Churchill, M. V. DePalatis, M. S. Chapman, Phys. Rev. A 83, 012710 (2011).
- (33) E. V. Tkalya, V. O. Varlamov, V. V. Lomonosov, S. A. Nikulin, Phys. Scr. 53, 296 (1996).
- (34) E. Peik, Chr. Tamm, Europhys. Lett. 61, 181 (2003).