Long-range angular correlations by strong color fields in hadronic collisions
I present an overview of the ridge phenomenon in proton-proton and proton-lead collisions. This novel collimation between rapidity separated hadron pairs is a consequence of non-linear gluon dynamics within the small wave-function of the colliding hadrons.
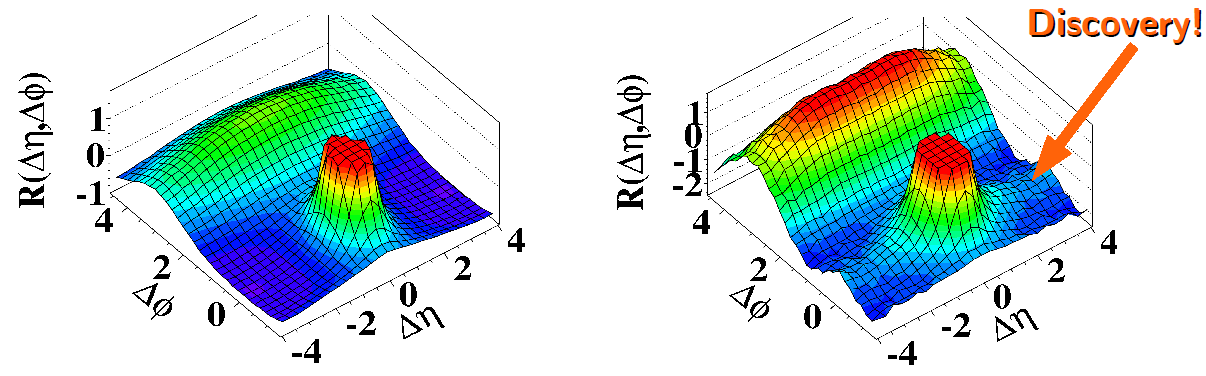
Multi-particle correlations in high-energy hadronic collisions can serve as sensitive tests of QCD dynanmics. In the fall of 2010 the CMS collaboration made a striking discovery . In high-multiplicity proton-proton collisions a correlation was uncovered between charged-particle pairs having a large pseudo-rapidity separation () and a narrow angular separation () in azimuth. Figure 1 displays the original CMS result. As the structure of the two-particle correlation resembles a mountain range the new discovery was dubbed “The Ridge” when it was first observed in heavy-ion collisions. It should be stressed that the heavy-ion ridge has a unique physical interpretation from the ridge in p+p and p+Pb collisions. While the former is attributed primarily to final-state rescattering and hydrodynamic flow the latter, which will be the focus of this proceeding, is a consequence of gluon saturation .

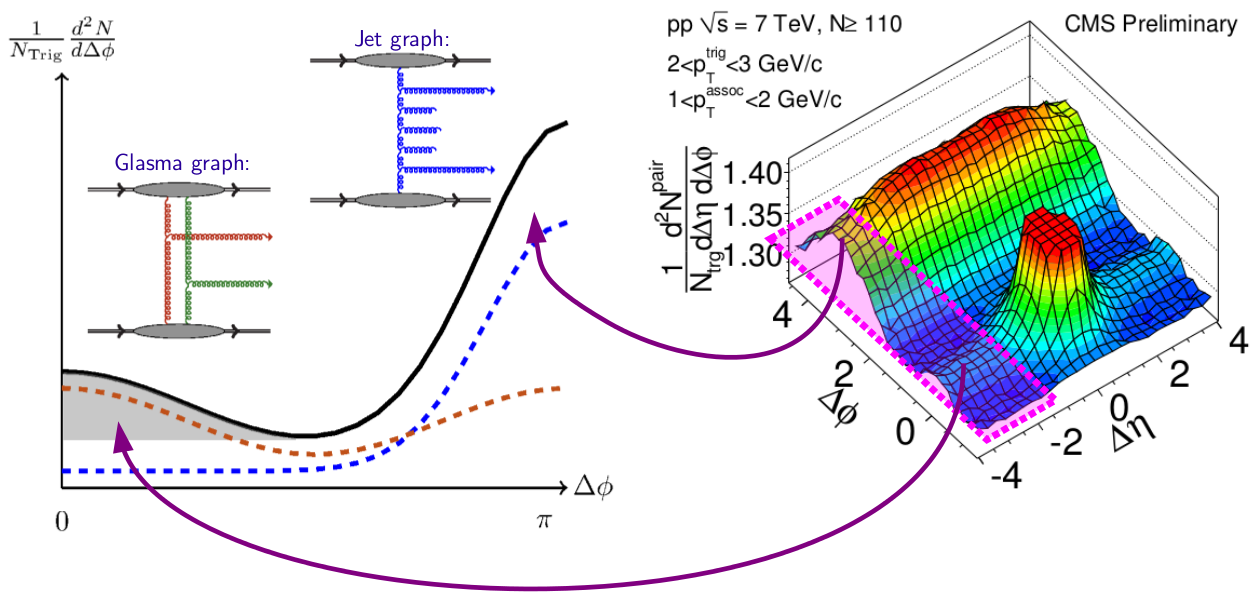
The ridge in proton-proton and proton-lead collisions is a natural consequence of gluon-saturation and non-linear parton dynamics in the nuclear wave-function before the collision occurs. The full structure of the two-particle correlation is explained by two competing QCD diagrams; as long as they are both computed within the CGC-EFT . The first diagram corresponds to the production of two gluons from a single ladder as shown in the right-most Feynman diagram appearing in Fig. 3. This production mechanism creates particles primarily back-to-back (i.e. on the away-side for ) and does not generate any near-side collimation. A second class of diagrams, herein called “Glasma Graphs”, where two gluons are produced from different ladders, is responsible for the near-side collimation identified with the ridge. The two-particle correlation generated by the Glasma graphs is symmetric with respect to and therefore produces an equal away-side collimation as well; however, this is hidden underneath the away-side jet and was only recently observed after a careful subtraction of peripheral events.
Saturation dynamics comes into play when determining the relative contribution of these two diagrams towards the two-particle correlation. A power counting exercise demonstrates that the Glamsa graph is enhanced by a factor of in the presence of saturation, which we associate with central / high-multiplicity collisions. This should be compared to the enhancement of the jet-graph in going from min-bias to central collisions.
The near-side collimation produced by the Glasma graph can be understood by looking at the schematic form of the double-inclusive cross section
| (1) |
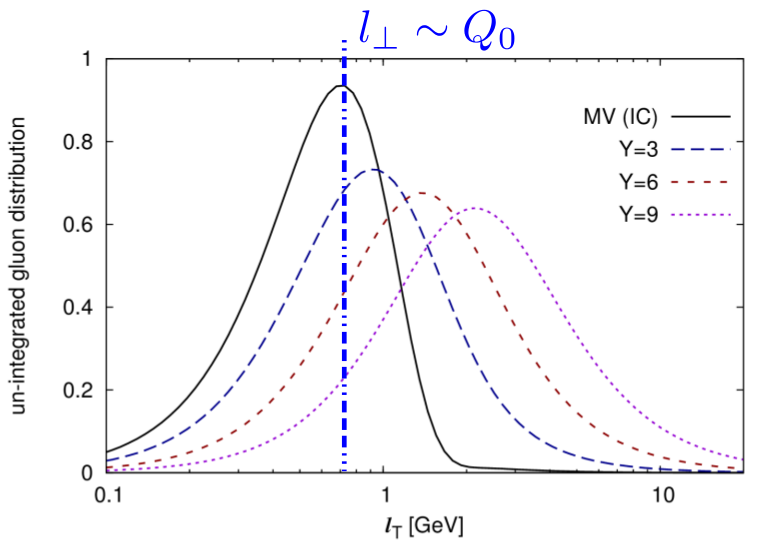
The full expression used in computations along with all relevant details is presented in . The function appearing in these expressions is the unintegrated gluon distribution and is obtained by solving the rcBK equation with MV model initial conditions at large . The Cauchy-Schwarz inequality dictates that the correlation strength at must be greater than or equal to that at ;
| (2) |
Furthermore the equality holds if and only if
| (3) |
and therefore, as long as the gluon distribution is a non-trivial function of momentum, there must be a collimation. The strength depends on the detailed structure of the gluon distribution function shown in fig. 4.
to larger rapidities via the rcBK evolution equation.
The rapid rise of the associated yield (see Fig. 3 for the definition) with centrality for asymmetric collisions can also be understood from equation 1 as well. If we take the unintegrated gluon distribution function as narrowly peaked around the saturation scale and of the projectile and target respectively, the associated yield increases quadratically with the larger of the two saturation scales ,
| (4) |
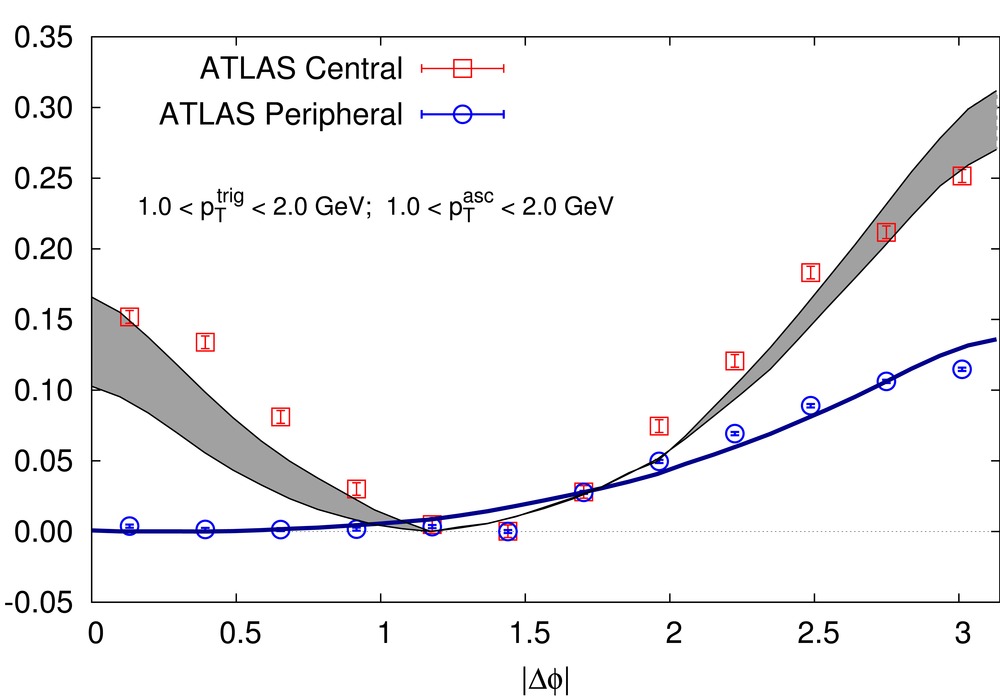
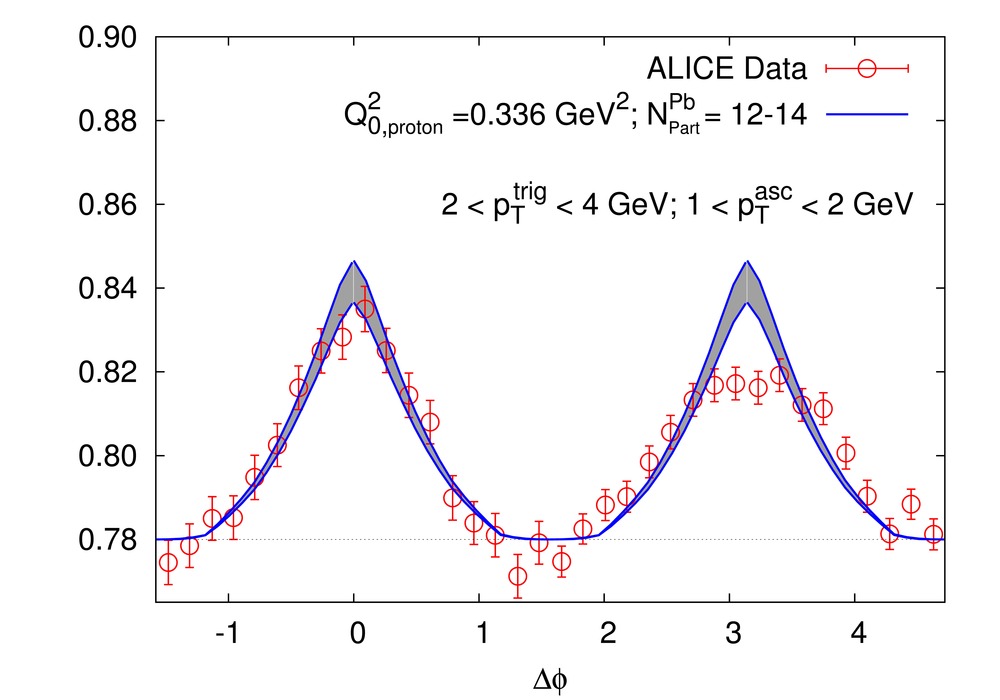
A recent work has compared predictions made within the CGC-EFT to the CMS , ALICE and ATLAS experimental data. Two examples of the quality of the theory to data comparison is shown in figure 5. While the CGC-EFT provides a unified description of both p+p and p+Pb collisions at a quantitative level one may still question the role played by final state effects. While this can only be addressed by detailed modeling there is strong evidence that final state interactions are small and not responsible for the ridge.
A crucial piece of evidence stems from the away-side jet, which remains unmodified from peripheral to central collisions; a fact confirmed a posteriori by the successful subtraction of the peripheral jet from central data by the LHC experimentalists. If final-state rescattering was strong enough to collimate the medium’s particles to create the ridge, rescattering should similarly modify the jet. This is indeed observed in heavy-ion collisions but it is not the case in p+p and p+Pb collisions.
A natural question is whether there is a unique final state interpretation of both the proton-proton and proton-lead ridge? The differences in systematics between these two systems is naturally understood within the CGC framework. Whether there is a consistent final-state model is far from clear. It seems extremely difficult for a final-state interpretation to account for an associated yield four times larger in p+Pb than in p+p at the same multiplicity, considering our expectation that the overlap areas in the two systems are approximately the same.
There is compelling evidence that the ridge in proton-proton and proton-lead collisions is a consequence of gluon saturation and non-linear gluon dynamics. This remarkable discovery of a novel collimation between two particles flying in opposite directions in ultra-rare high multiplicity events is probing rare quantum fluctuations within the proton and nucleus at the smallest length scales experimentally possible.
Acknowledgments
Supported by the US Department of Energy under Contract No. DE-FG02-03ER41260.
References
References
- [1] V. Khachatryan et al. [CMS Collaboration], JHEP 1009, 091 (2010) [arXiv:1009.4122 [hep-ex]].
- [2] K. Dusling and R. Venugopalan, Phys. Rev. Lett. 108, 262001 (2012) [arXiv:1201.2658 [hep-ph]].
- [3] F. Gelis, E. Iancu, J. Jalilian-Marian and R. Venugopalan, Ann. Rev. Nucl. Part. Sci. 60, 463 (2010) [arXiv:1002.0333 [hep-ph]].
- [4] K. Dusling and R. Venugopalan, Phys. Rev. D 87, 051502 (2012) [arXiv:1210.3890 [hep-ph]].
- [5] K. Dusling and R. Venugopalan, Phys. Rev. D 87, 054014 (2012) [arXiv:1211.3701 [hep-ph]].
- [6] K. Dusling and R. Venugopalan, Phys. Rev. D to appear [arXiv:1302.7018 [hep-ph]].
- [7] S. Chatrchyan et al. [CMS Collaboration], Phys. Lett. B 718, 795 (2013) [arXiv:1210.5482 [nucl-ex]].
- [8] B. Abelev et al. [ ALICE Collaboration], arXiv:1212.2001 [nucl-ex].
- [9] G. Aad et al. [ATLAS Collaboration], arXiv:1212.5198 [hep-ex].