Co2FeAl thin films grown on MgO substrates: Correlation between static, dynamic and structural properties
Abstract
Co2FeAl (CFA) thin films with thickness varying from 10 nm to 115 nm have been deposited on MgO(001) substrates by magnetron sputtering and then capped by Ta or Cr layer. X-rays diffraction (XRD) revealed that the cubic CFA axis is normal to the substrate and that all the CFA films exhibit full epitaxial growth. The chemical order varies from the phase to the phase when decreasing the thickness. Magneto-optical Kerr effect (MOKE) and vibrating sample magnetometer measurements show that, depending on the field orientation, one or two-step switchings occur. Moreover, the films present a quadratic MOKE signal increasing with the CFA thickness, due to the increasing chemical order. Ferromagnetic resonance, MOKE transverse bias initial inverse susceptibility and torque (TBIIST) measurements reveal that the in-plane anisotropy results from the superposition of a uniaxial and of a fourfold symmetry term. The fourfold anisotropy is in accord with the crystal structure of the samples and is correlated to the biaxial strain and to the chemical order present in the films. In addition, a large negative perpendicular uniaxial anisotropy is observed. Frequency and angular dependences of the FMR linewidth show two magnon scattering and mosaicity contributions, which depend on the CFA thickness. A Gilbert damping coefficient as low as 0.0011 is found.
I Introduction
The performances of spintronic devices depend on the spin polarization of the current. Therefore, half metallic materials should be ideal compounds as high spin polarized current sources to realize a very large giant magnetoresistance, a low current density for current induced magnetization reversal, and an efficient spin injection into semiconductors. Theoretically, different kinds of materials, such as Fe3O4 [1, 2], CrO2 [3], mixed valence perovskites [4] and Heusler alloys [5, 6], have been predicted to be half metals. Moreover, the half metallic properties in these materials have been experimentally demonstrated at low temperature. However, oxide half metals have low Curie temperature () and therefore their spin polarization is miserably low at room temperature. From this point of view, Heusler alloys are promising materials for spintronics applications, because a number of them have generally high [7] and therefore they may offer an alternative material choice to obtain half metallicity even at room temperature. Furthermore, their structural and electronic properties strongly depend on the crystal structure. Recently, Heusler compounds have attracted considerable experimental and theoretical interest, not only because of their half metallic behaviour but also due to magnetic shape memory and inverse magneto-caloric properties that they exhibit. One of the most important Co-based full-Heusler alloys is Co2FeAl (CFA). It has a high ( K) [7] and, therefore, it is promising for practical applications. Indeed, it can provide giant tunnelling magnetoresistance ( at RT) [8,9] when used as an electrode in magnetic tunnel junctions. Furthermore, as we illustrate in our present study, CFA presents the lowest magnetic damping parameter among Heuslers. This low damping should provide significantly lower current density required for spin-transfer torque (STT) switching, particularly important in prospective STT devices. However, the integration of CFA as a ferromagnetic electrode in spintronic devices requires a good knowledge allowing for a precise control of its magnetic properties, such as its saturation magnetization, its magnetic anisotropy, the exchange stiffness parameter, the gyromagnetic factor and the damping mechanisms monitoring its dynamic behaviour. In this paper we used X-rays diffraction (XRD), ferromagnetic resonance in microstrip line (MS-FMR) under in-plane and out of plane applied magnetic field, combined with transverse biased initial inverse susceptibility and torque (TBIIST) method, in order to perform a complete correlated analysis between structural and magnetic properties of epitaxial Co2FeAl thin films grown on MgO(001) substrates. In addition, a detailed study of the different relaxation mechanisms leading to the linewidth broadening is presented.
II Samples preparation and experimental methods
CFA films were grown on MgO(001) single-crystal substrates using a magnetron sputtering system with a base pressure lower than Torr. Prior to the deposition of the CFA films, a 4 nm thick MgO buffer layer was grown at room temperature (RT) by rf sputtering from a MgO polycrystalline target under an Argon pressure of 15 mTorr. Next, the CFA films, with variable thicknesses (10 nm nm), were deposited at RT by dc sputtering under an Argon pressure of 1 mTorr, at a rate of 0.1 nm/s. Finally, the CFA films were capped with a MgO(4nm)/Cr(10nm) or with a MgO(4nm)/Ta(10nm) bilayer. After the growth of the stack, the structures were ex-situ annealed at 600oC during 15 minutes in vacuum (pressure lower than Torr). The structural properties of the samples have been characterized by XRD using a four-circle diffractometer. Their magnetic dynamic properties have been studied by microstrip ferromagnetic resonance (MS-FMR).
The MS-FMR characterization was done with the help of a field modulated FMR setup using a vector network analyzer (VNA) operating in the 0.1-40 GHz frequency range. The sample (with the film side in direct contact) is mounted on 0.5 mm microstrip line connected to the VNA and to a lock-in amplifier to derive the field modulated measurements via a Schottky detector. This setup is piloted via a Labview program providing flexibility of a real time control of the magnetic field sweep direction, step and rate, real time data acquisition and visualization. It allows both frequency and field-sweeps measurements with magnetic fields up to 20 kOe applied parallel or perpendicular to the sample plane. In-plane angular dependence of resonance frequencies and fields are used to measure anisotropies. The complete analysis of in-plane and perpendicular field resonance spectra exhibiting uniform precession and perpendicular standing spin wave (PSSW) modes leads to the determination of most of the magnetic parameters: effective magnetization, gyromagnetic factor, exchange stiffness constant and anisotropy terms. In addition, the angular and the frequency dependences of the FMR linewidth are used in order to identify the relaxation mechanisms responsible of the line broadening and allow us for evaluating the parameters which monitor the intrinsic damping (Gilbert constant) and the extrinsic one (two magnon scattering, inhomogeneity, mosaïcity).
Magnetization at saturation and hysteresis loops for each sample were measured at room temperature using a vibrating sample magnetometer (VSM) and a magneto-optical Kerr effect (MOKE) system. Transverse biased initial inverse susceptibility and torque method (TBIIST) [10] has been used to study the in-plane anisotropy for comparison with MS-FMR. In this technique both a longitudinal magnetic sweep field (parallel to the incidence plane) and a static transverse field (perpendicular to the incidence plane) are applied in the plane of the film and the longitudinal reduced magnetization component is measured versus for various directions of with conventional magneto-optical Kerr setup. From the measured hysteresis loops under transverse biased field, the initial inverse susceptibility () and the field offset () which are related to the second and first angle-derivative of the magnetic anisotropy, respectively, are derived. Fourier analysis of and versus the applied field direction then easily resolves contributions to the magnetic anisotropy of different orders and gives the precise corresponding values of their amplitude and of their principal axes.
In order to obtain the desirable accuracy or even simply meaningful results higher-order nonlinear in contributions (quadratic or Voigt effect) as well as polar or other contributions to the Kerr signal are carefully determined and corrected [10]. TBIIST method surely does not have the same recognition than FMR techniques but seems to be complementary, especially for samples with a weak magnetic signal detectable with difficulty by FMR methods.
III Structural characterization
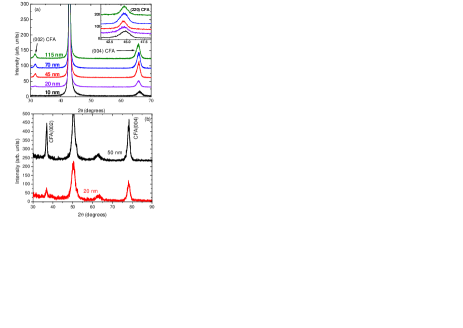
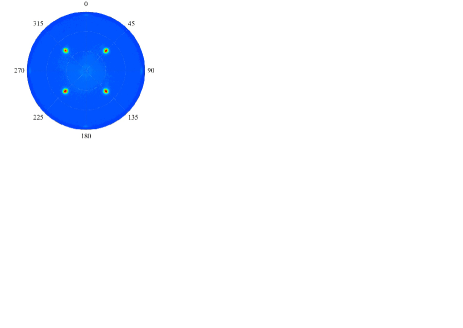
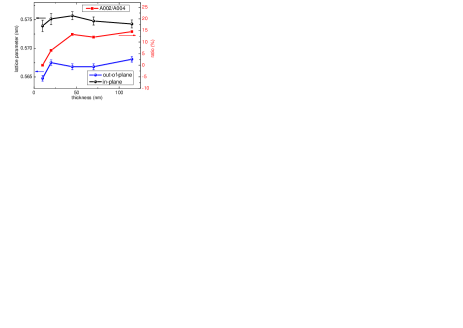
Figure 1 shows the X-rays diffraction patterns for CFA of different thicknesses. These XRD patterns show that, in addition to the feature arising from the (002) peak of the MgO substrate, the Cr-capped samples (Fig. 1a: Cu X-rays source ( nm)) exhibit only two peaks which are attributed to the (002) and (004) diffraction lines of CFA. The Ta-capped films (Fig. 1b: Co-X-rays source ( )) show an additional peak (around ) arising from the (002) line issued from the Ta film. Pole figures (Fig. 2) allow to assert an epitaxial growth of the CFA films according to the expected CFA(001)[110]//MgO(001)[100] epitaxial relation. Using scans of various different orientations we evaluated the out-of-plane () and the in-plane () lattice parameters (Fig. 3). A simple elastic model allowed us for deriving the unstrained a0 cubic parameter as well as the in-plane and the out-of- plane strains:
| (1) |
where the values of the elastic constants GPa and GPa have been calculated previously [11]. Introducing the Poisson coefficient the above parameters write as:
| (2) |
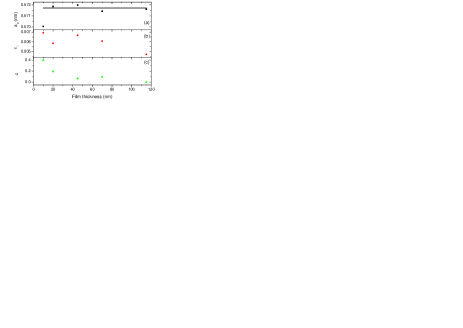
The cubic lattice constant does not depend upon the thickness, except for the thinner 10 nm film (Fig. 4a), which shows a significant reduction; its value, nm, is slightly smaller than the reported one in the bulk compound with the L21 structure (0.574 nm). The in-plane strain reveals a tensile stress originating from the mismatch with the lattice of the MgO substrate: however, its value does not exceed a few /, well below the Heussler/MgO mismatch, thus excluding an efficient planar clamping. The strain decreases versus the thickness, at least above 40 nm (Fig. 4b).
Odd Miller indices (e.g.: ) are allowed for diffraction in the L21 phase [12]. In contrast, they are forbidden in the B2 phase, which is characterized by a total disorder between Al and Fe atoms but a regular occupation of the Co sites. In the A2 phase the chemical disorder between Fe, Co and Al sites is complete: diffraction is only allowed for even indices subjected to . We do not observe or lines and then conclude to the absence of the L21 phase in the studied films. In contrast, a peak is observed, thus indicating that the samples do not belong to the A2 phase. However, the ratio of the integrated intensities of the and of the peaks increases versus the film thickness (Fig. 3). This ratio is proportional to , where is the chemical disorder. Assuming that the thickest film belongs to the B2 phase () the dependence of upon the film thickness is shown in figure 4c: the A2 phase () is almost completely achieved for the 10 nm thick sample. The reduction of in the thinner sample is probably due to its previously noticed [13] smaller value in the A2 phase compared to the B2 one.
IV Magnetic properties
The experimental magnetic data have been analyzed considering a magnetic energy density which, in addition to Zeeman, demagnetizing and exchange terms, is characterized by the following effective anisotropy contribution [14]:
| (3) |
In the above expression, and respectively represent the out-of-plane and the in-plane (referring to the substrate edges) angles defining the direction of the magnetization . and define the angles between an easy uniaxial planar axis or an easy planar fourfold axis, respectively, with respect to this substrate edge. , and are in-plane uniaxial, fourfold and out-of-plane uniaxial anisotropy constants, respectively. We introduce the effective magnetization obtained by:
| (4) |
As experimentally observed, the effective perpendicular anisotropy term (and, consequently, the effective perpendicular anisotropy field ), is thickness dependent: describes an effective perpendicular anisotropy term which writes as:
| (5) |
where refers to the perpendicular anisotropy term of the interfacial energy density. Finally we define and as the in-plane uniaxial and the fourfold anisotropy fields respectively. The resonance expressions for the frequency of the uniform and PSSW modes assuming in-plane or perpendicular applied magnetic fields are given by equations (6) and (7) respectively [14, 15].
| (6) |
| (7) |
In the above expressions s-1.Oe-1 is the gyromagnetic factor, is the index of the PSSW and is the exchange stiffness constant.
The experimental results concerning the measured peak-to-peak FMR linewidths are analyzed in this work taking account of both intrinsic and extrinsic mechanisms. Therefore, in the most FMR experiments, the observed magnetic field linewidth ( ) is usually analyzed by considering four different contributions as given by equation (8) [16-21].
| (8) |
When the applied field and the magnetization are parallel, the intrinsic contribution is not angular dependent; it derives from the Gilbert damping and is given by:
| (9) |
(9) where is the driven frequency and is the Gilbert coefficient.
The relevant mechanisms [16] describing the extrinsic contributions are:
1- Mosaicity: the orientation spread of the crystallites contributes to the linewidth. Its contribution is given by:
| (10) |
Where is the average spread of the easy axis anisotropy direction in the film plane. It is worth to mention that for frequency dependent measurements along the easy and hard axes the partial derivatives are zero and thus the mosaicity contribution vanishes. The suffix “res” indicates that equation (10) should be evaluated at the resonance. Therefore, using equation (6) for uniform mode (), the expression of is found and then calculated using the corresponding value of and at the resonance.
2- Inhomogeneous residual linewidth present at zero frequency. This contribution is frequency and angle independent inhomogeneity related to various local fluctuations such as the value of the film thickness.
3- Two magnon scattering contribution to the linewidth. This contribution is given by [22-24]:
| (11) |
with: . The expected fourfold symmetry induces the and coefficients; the coefficient is phenomenogically introduced.
The analysis of the variation of the resonance linewidth versus the frequency and the in-plane field orientation allows for evaluating , , , , (and ) and (and which, from symmetry considerations, is expected to have a or value, depending upon the chosen sign of ).
IV.1 Static properties
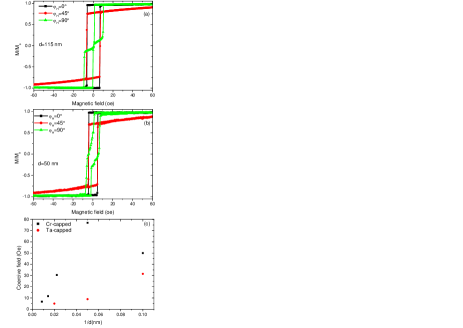
The magnetization at saturation measured by VSM, averaged upon all the samples has been found to be emu/cm3, thus providing a magnetic moment of 5.05±0.25 Bohr magneton () per unit formula, in agreement with the previously published values for the B2 phase [7]. For all the studied films the hysteresis loops were obtained by VSM and MOKE with an in-plane magnetic field applied along various orientations. Figure 5 shows representative behaviors of different CFA films. The observed shape mainly depends on the field orientation, in agreement with the expected characteristics of the magnetic anisotropy. As confirmed below, in all the studied samples this anisotropy consists into the superposition of a fourfold and of a uniaxial term showing parallel easy axes: this common axis coincides with one of the substrate edges and, consequently, with one of the crystallographic directions of the CFA phase. It results that if an orientation (say related to ) is the easiest, the perpendicular direction (( ) related to ) is less easy. A similar situation was studied and interpreted previously [25]: it is expected to provide square hysteresis loops for , as evidenced in figure 5, while in contrast, for , it leads to a two steps reversal, as can be seen in figure 5. The intermediate step leads to a magnetization nearly perpendicular to the applied field. For all the studied films a two steps loop is observed for ranging in the interval. In figure 5c the deduced coercive fields () from hysteresis loops along the easy direction () are compared for different thicknesses (10, 20, 45, 50, 70, and 115 nm). For both Cr-capped and Ta-capped films HC increases linearly with the inverse of the film thickness. The Cr-capped samples present higher coercive fields due to the different interface quality.
One can also observe that MOKE hysteresis loops are not strictly centrosymmetrical (see for example Fig. 5b for ) indicating the superposition of symmetrical (even function of applied sweep field ) and anti-symmetrical (odd in ) components in the Kerr signal. It has been shown and confirmed [26, 27] that, for in-plane magnetized thin films, the antisymmetrical part observed in the loops arises from the second order magneto-optical effects quadratic in magnetization. Therefore, the present study was not limited to the usual linear MOKE. We have also investigated this quadratic contribution through the study of the Kerr signal dependence upon the film orientation under a saturating in-plane field. Within the cubic approximation for a (001) surface, the Kerr rotation angle writes as [27]:
| (12) |
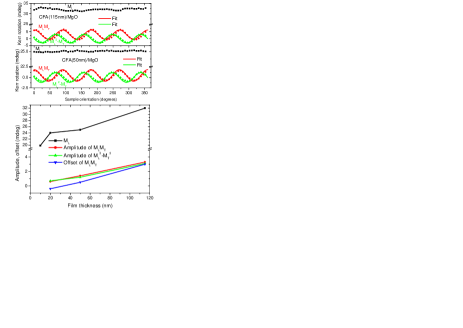
Where and stand for the longitudinal (i.e.: within the incidence plane) and the transverse (i.e.: normal to the incidence plane) component of the magnetization, respectively, and where is the angle of a cubic axis with the plane of incidence. The first term describes the usual linear contribution while the following ones correspond to the quadratic MOKE (QMOKE). The experimental study was performed under an angle of incidence of using a field magnitude large with respect to the anisotropy field. The different contributions to the Kerr signal, as functions of the film orientation are extracted by applying a rotating field technique [10]. Representative results obtained with 115 Cr- and 50 nm Ta-capped films are shown in figure 6. Beside the longitudinal component ( ) of the Kerr rotation, which is dominant, the QMOKE signal, which is most probably due to the second order spin-orbit coupling [26], is present. The derived ( ) and angular variations show the behaviour expected from the above equation.
The values for the amplitudes of the and of the ( ) contributions are the same within the experimental error for each sample suggesting that the applied cubic model is correct. The offset of the contribution is smaller than the amplitudes, but generally it follows the same trend as the amplitudes. As the thickness decreases the amplitudes and the offset decrease, suggesting that the chemical order progressively changes from the B2 to the A2 phase, as discussed above. Moreover, the amplitudes and offset values of CFA are comparable to those measured for Co2MnSi, which presents the L21 phase [28]. The TBIIST results are discussed in the following section, in order to allow for a comparison with the data derived from the FMR study of the dynamic properties.
IV.2 Dynamic properties
IV.2.1 Exchange stiffness and effective magnetization
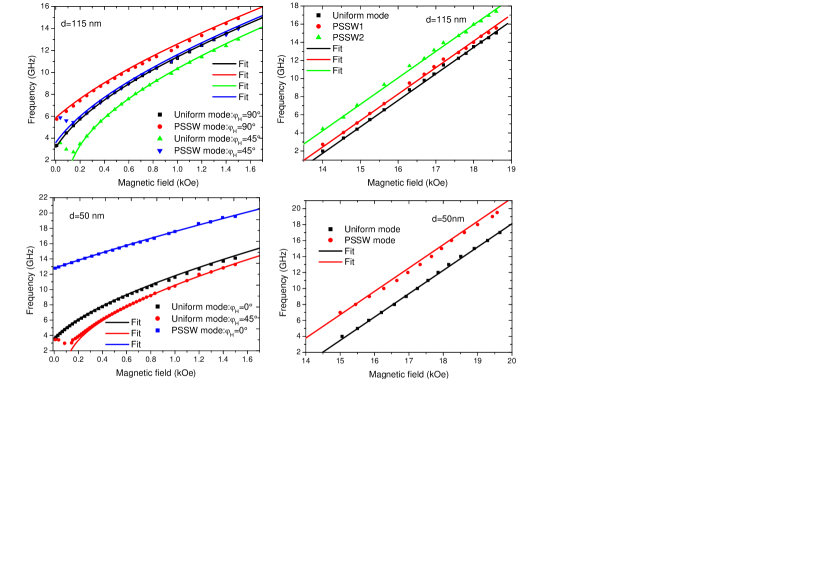
The uniform precession and the first PSSW modes have been observed in perpendicular and in-plane applied field configurations for samples thicknesses down to 50 nm. For the thickest film (115 nm) it was even possible to observe the second PSSW. For lower sample thickness, the PSSW modes are not detected due their high frequencies over-passing the available bandwidth (0-24 GHz). Typical in-plane and perpendicular field dependences of the resonance frequencies of the uniform and PSSW modes are shown on figure 7 for the 115 nm Cr- and the 50 nm Ta-capped films. By fitting the data in figure 7 to the above presented model, the gyromagnetic factor (), the exchange stiffness constant () and the effective magnetization ) are extracted. The fitted and values are 2.92 GHz/kOe and 1.5 µerg/cm, respectively: they do not depend of the studied sample. The derived exchange constant is in good agreement with the reported one by Trudel et al. [7].
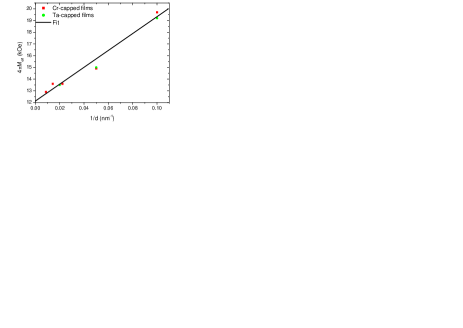
Figure 8 plots out the extracted effective magnetization versus the film thickness . It can be seen that follows a linear variation. This allows to derive the perpendicular surface anisotropy coefficient : erg/cm2. The limit of when tends to infinity is equal to 12.2 kOe: within the above mentioned experimental precision about the magnetization at saturation it does not differ from . We conclude that the perpendicular anisotropy field derives from a surface energy term; being negative, it provides an out-of-plane contribution. It may originate from the magneto-elastic coupling arising from the interfacial stress due to the substrate.
IV.2.2 Magnetic anisotropy
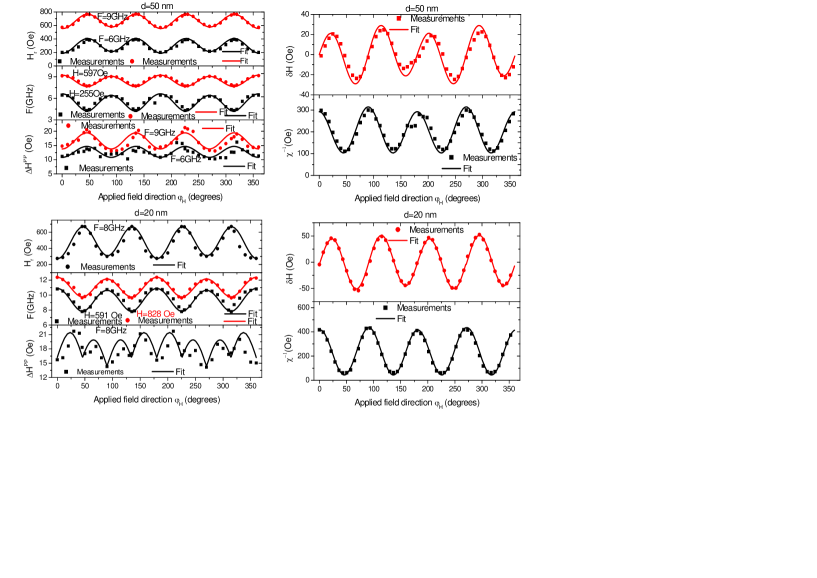
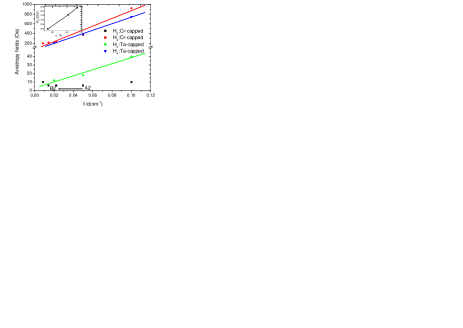
Figure 9 shows the angular dependences of the resonance field (at fixed frequency) and of the resonance frequency (at fixed applied field) compared to the static TBIIST measurements for three different CFA films. Both FMR and TBIIST data show that the angular behavior is governed by a superposition of uniaxial and fourfold anisotropy terms with the above-mentioned easy axes. As noticed above, the symmetry properties of the epitaxial observed films agree with the principal directions of the fourfold contribution. The fourfold and uniaxial anisotropy fields extracted from the fit of the experimental TBIIST and FMR data using the above-presented model are drawn on figure 10 and summarized in Table I: the compared results issued from the two techniques are in excellent agreement. For all the samples the fourfold anisotropy is dominant. While the uniaxial anisotropy field () of the Cr-capped films is small and does not seem to depend upon the thickness, in the Ta-capped films is higher, maybe due to interface effects, and is a decreasing function of the thickness (Figure 10). As suggested previously, we believe that the uniaxial anisotropy is induced by the stepping of the substrates, probably resulting from a small miscut along their crystallographic direction corresponding to the studied films. The reduced effect of the steps of the substrate when the thickness increases could then explain the thickness dependence of . However, up to now we have no completely satisfying interpretation of the presence of and of its variations versus the nature of the film capping.
The fourfold anisotropy fields () are comparable for Cr- and Ta-capped films and decrease when their thickness increases, as seen in figure 10. For large values of (45nm or higher) lies around 200 Oe and shows a small linear variation versus the in-plane strain , as shown in the insert of figure 10. This evolution confirms a direct correlation between the H4 field and the in-plane biaxial strain for the films with thicknesses above 45 nm. At smaller values of (10 or 20 nm) a large increase of , up to 920 Oe, is observed. It is presumably related to the B2A2 phase transition observed through X-rays diffraction. The observed symmetry argues for a magneto-crystalline contribution, which, as previously observed [29, 30], would be higher in phase A2 than in phase B2.
IV.2.3 FMR linewidth
In figure 9, the FMR peak to peak linewidth (() is plotted as a function of the field angle for the 50 nm and 20 nm Ta-capped CFA films using three driving frequencies: 6, 8, and 9 GHz. is defined as the field difference between the extrema of the sweep-field measured FMR spectra. All the other samples show a qualitatively similar behaviour to one of the samples presented here. The positions of the extrema depend on the sample. The observed pronounced anisotropy of the linewidth cannot be due to the Gilbert damping contribution, which is expected to be isotropic, and must be due to additional extrinsic damping mechanisms. In the 50 nm thick sample, the angular variation shows a perfect fourfold symmetry (in agreement with the variation of the resonance position). Such behaviour is characteristic of two magnon scattering. This effect is correlated to the presence of defects preferentially oriented along specific crystallographic directions, thus leading to an asymmetry (see equation (11)). Concerning the 20 nm thick film, the in-plane angular dependence of is less simple and shows eight maxima, that is expected from a mosaicity driven linewidth broadening. It can be seen that a smaller fourfold symmetry (four maxima) is superimposed on the eight maxima, indicating that two magnon scattering is still present. Therefore, the entire angular dependence of the FMR linewidth in our samples can be explained as resulting of the four contributions appearing in equation (8).
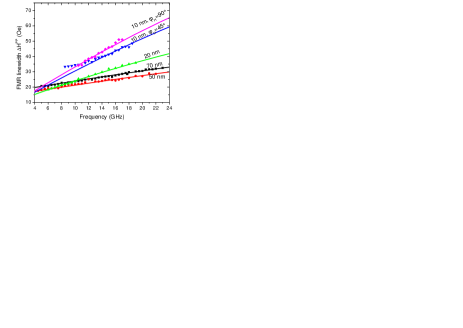
In figure 11, for the field parallel to an easy axis and a hard axis ( for 10 nm thick sample) of the fourfold anisotropy is plotted as a function of driving frequency for all samples. An apparently extrinsic contribution to linewidth was observed, which increased with decreasing film thickness. It should be mentioned that the observed linear increase of the linewidth with frequency in figure 11 maybe due to Gilbert damping but other relaxation mechanisms can lead to such linear behaviour. Therefore, only an effective damping parameter can be extracted from the slope of the curves and ranges between about 0.00154 for the easy axis of the 50 nm thick film and 0.0068 for easy axis the thinnest film. The pertinent parameters could thus be, in principle derived from the conjointly analysis of the frequency and angular dependence of . However, due to the limited experimental precision, some additional hypotheses are necessary in order to allow for a complete determination of the whole set of parameters describing the intrinsic Gilbert damping and the two magnon damping. A detailed analysis is presented in the appendix. Using the previously reported value: [31], which is in agreement with our experimental results, we were able to for each film. , ,, , are listed in Table II which also contains the parameters describing the damping effects of the mosaïcity () and of the inhomogeneity contribution ().
The two magnon and the mosaïcity () contributions to increase when the thickness decreases, probably due to the progressive above reported loss of chemical order. The increase of the residual inhomogeneities linewidth () with the thickness is most probably due the increase of defects and roughness. The uniaxial term is observed only in the thinnest (20 and 10 nm) samples. As expected, , but the sign of is sample dependent. Finally, it is important to notice that the very low value of the intrinsic damping in the studied samples allows for investigating the extrinsic contributions.
V Conclusion
Co2FeAl films of various thicknesses (10 nm nm)) were prepared by sputtering on a (001) MgO substrate. They show full epitaxial growth with chemical order changing from B2 to A2 phase as thickness decreases. MOKE and VSM hysteresis loops obtained with different field orientations revealed that, depending on the direction of the in-plane applied field, two or one jump switching occur, due to the superposition of uniaxial and fourfold anisotropies. The samples present a quadratic MOKE contribution with decreasing amplitudes as the CFA thickness decreases. The microstrip ferromagnetic resonance (MS-FMR) and the transverse biased initial inverse susceptibility and torque (TBIIST) methods have been used to study the dynamic properties and the anisotropy. The in-plane anisotropy presents two contributions, showing a fourfold and a twofold axial symmetry, respectively. A good agreement concerning the relevant in-plane anisotropy parameters deduced from the fit of MS-FMR and TBIIST measurements has been obtained. The fourfold in-plane field shows a thickness dependence behavior correlated to the thickness dependence of the chemical order and strain in samples. The angular and frequency dependences of the FMR linewidth are governed by two magnon scattering, mosaïcity and by a sample independent Gilbert damping equal to 0.0011
Appendix
In the section dealing with the discussion of the FMR linewidth measurements we stated that the conjointly analysis of the frequency and angular dependence of does not allow for the determination of all the parameters given in equation (8) and additional hypothesis should be done. The aim of this appendix is to clarify the manner in which the parameters summarized in Table II is done.
For most of the exploitable measurements the microwave frequency f during the measurements is not larger than and generally smaller ( varies from 18.5 to 28.5 GHz, depending on the film thickness). It then results that the two magnon damping is practically proportional to f and that the sum of the Gilbert and of the two magnon damping terms reads as (see equations (9) and (11)):
| (13) |
It is not possible to completely identify the respective contributions of the Gilbert and of the two magnon damping, only according to equation (13). The quasi-linear variation versus the frequency (Fig. 11) observed for allows for defining an effective damping parameter , which, is angle dependent due to two magnon scattering. The experimentally derived coefficient , from the linear fit of data presented in figure 11, varies from 0.0068 to 0.00154. Furthermore, the measured angular variation of the linewidth allows for evaluating (, ) and (, ) but, concerning the isotropic terms appearing in equation (13), only the sum can be derived. However, remembering that cannot be negative, the maximal available value of (corresponding to ) is easily found. Moreover, a lowest value can be obtained for noticing that equation (13) can also be written:
| (14) |
where the adequate third and the fourth terms represent the twofold and the fourfold contributions, which take into account that both of them are necessarily non-negative for any value of . The additional residual two magnon isotropic contribution cannot be negative. Hence: .
Introducing this minimal accessible value of , ( ), the maximal value of the Gilbert coefficient is then easily obtained. To summarize, for each sample the experimental data provide the allowed intervals for and for , respectively [0, ] and [(), ], and indeed, the chosen value of within [0, ] allows for deducing . The smallest calculated interval for , equal to [0, ] is obtained for the 70 nm film. A previous publication by Mizukami el al. [31] has concluded to a Gilbert coefficient equal to: . We then stated that and, consequently, we were able to deduce for each film. , ,, , are listed in Table II which also contains the parameters describing the damping effects of the mosaïcity and of the inhomogeneity.
References
- (1) [1] A. Yanase and K. Siratori, J. Phys. Soc. Jpn. 53, 312 (1984)
- (2) [2] Z. Zhang and S. Satpathy, Phys. Rev. B 44, 13319 (1991)
- (3) [3] K. Schwarz, J. Phys. F: Met. Phys. 16, L211 (1986)
- (4) [4] J. H. Park, E. Vescovo, H. J. Kim, C. Kwon, R. Ramesh, and T. Venkatesan, Nature (London) 392, 794 (1998)
- (5) [5] H. C. Kandpal, G. H. Fecher, and C. Felser, J. Phys. D 40, 1507 (2007)
- (6) [6] R. A. de Groot, F. M. Mueller, P. G. van Engen and K. H. J. Buschow, Phys. Rev. Lett. 50, 2024 (1983)
- (7) [7] S. Trudel, O. Gaier, J. Hamrle, and B. Hillebrands, J. Phys. D 43, 193001 (2010)
- (8) [8] W. H. Wang, E. Liu, M. Kodzuka, H. Sukegawa, M. Wojcik, E. Jedryka, G. H. Wu, K. Inomata, S. Mitani, and K. Hono, Phys. Rev. B 81, 140402 (R) (2010)
- (9) [9] W. H. Wang, H. Sukegawa, and K. Inomata, Phys. Rev. B 82, 092402 (2010)
- (10) [10] D. Berling, S. Zabrocki, R. Stephan, G. Garreau, J.L. Bubendorff, A. Mehdaoui, D. Bolmont, P. Wetzel, C. Pirri and G. Gewinner, J. Magn. Magn. Mat. 297, 118 (2006)
- (11) [11] M. S. Gabor, T. Petrisor Jr., and C. Tiusan, M. Hehn and T. Petrisor, Phys. Rev. B 84, 134413 (2011)
- (12) [12] D. Fruchart, R. Fruchart, Ph. L’Héritier, K. Kanematsu, R. Madar, S. Misawa, Y. Nakamura, P. J. Ziebeck, and K. R. A. Webster, in Magnetic Properties of Metals, edited by H. P. J. Wijn, Landolt- Börnstein, New Series, Group III, Vol. 19c, Pt. 2 (Springer-Verlag, Berlin, 1986).
- (13) [13] K. Inomata, N. Ikeda, N. Tezuk, R. Goto, S. Sugimoto, M. Wojcik and E. Jedryka, Sci. Technol. Adv. Mater. 9 (2008) 014101
- (14) [14] M. Belmeguenai, F. Zighem, Y. Roussigné, S-M. Chérif, P. Moch, K. Westerholt, G. Woltersdorf, and G. Bayreuther Phys. Rev. B 79, 024419 (2009)
- (15) [15] M. Belmeguenai, F. Zighem, T. Chauveau, D. Faurie, Y. Roussigné, S-M. Chérif, P. Moch, K.Westerholt and P. Monod, J. Appl. Phys. 108, 063926 (2010)
- (16) [16] Kh. Zakeri, J. Lindner, I. Barsukov, R. Meckenstock, M. Farle, U. von Hörsten, H. Wende, W. Keune, J. Rocker, S. S. Kalarickal, K. Lenz, W. Kuch, and K. Baberschke, Phys. Rev. B 76, 104416 (2007)
- (17) [17] H. Lee, Y.-H. A. Wang, C. K. A. Mewes, W. H. Butler, T. Mewes, S. Maat, B. York, M. J. Carey, and J. R. Childress, Appl. Phys. Lett. 95, 082502 (2009)
- (18) [18] H. Kurebayashi, T. D. Skinner, K. Khazen, K. Olejnik, D. Fang, C. Ciccarelli, R. P. Campion, B. L. Gallagher, L. Fleet, A. Hirohata, and A. J. Ferguson, Appl. Phys. Lett 102, 062415 (2013)
- (19) [19] K D Sossmeier, F Beck, R C Gomes, L F Schelp and M Carara, J. Phys. D: Appl. Phys. 43, 055003 (2010)
- (20) [20] Y. Y. Zhou, X. Liu, J. K. Furdyna, M. A. Scarpulla and O. D. Dubon, Phys. Rev. B 80, 224403 (2009)
- (21) [21] W. Platow, A. N. Anisimov, G. L. Dunifer, M. Farle, and K. Baberschke, Phys. Rev. B 58, 5611 (1998)
- (22) [22] R. Arias and D. L. Mills, Phys. Rev. B 60, 7395 (1999)
- (23) [23] D. L. Mills and R. Arias, Physica B 384, 147 (2006)
- (24) [24] R. Arias and D. L. Mills, J. Appl. Phys. 87, 5455 (2000).
- (25) [25] R. P. Cowburn, S. J. Gray, J. Ferré, J. A. C. Bland, and J. Miltat, J. Appl. Phys. 78, 7210 (1995).
- (26) [26] K. Postava, D. Hrabovsky, J. Pistora, A. R. Fert, S. Visnovsky, and T. Yamaguchi, J. Appl. Phys. 91, 7293 (2002).
- (27) [27] R.M. Osgood III, S.D. Bader, B. M. Clemens, R.L. White, H. Matsuyama, J. Magn. Magn. Mater. 182, 297 (1998).
- (28) [28] G. Wolf, J. Hamrle, S. Trudel, T. Kubota, Y. Ando and B. Hillebrands, J. Appl. Phys.110, 043904 (2011)
- (29) [29] O. Gaier, J. Hamrle, S. J. Hermsdoerfer, H. Schultheiß, B. Hillebrands, Y. Sakuraba, M. Oogane, and Y. Ando, J. Appl. Phys. 103, 103910 (2008)
- (30) [30] S.Trudel, G. Wolf, J. Hamrle, B. Hillebrands, P. Klaer, M. Kallmayer, H.-J. Elmers, H. Sukegawa, W. Wang, and K. Inomata, Phys. Rev. B 83, 104412 (2011)
- (31) [31] S. Mizukami, D. Watanabe, M. Oogane, Y. Ando, Y. Miura, M. Shirai and T. Miyazaki, J. Appl. Phys.105, 07D306 (2009)