Observation of rotation in star forming regions: clouds, cores, disks, and jets
Abstract
Angular momentum plays a crucial role in the formation of stars and planets. It has long been noticed that parcels of gas in molecular clouds need to reduce their specific angular momentum by 6 to 7 orders of magnitude to participate in the building of a typical star like the Sun. Several physical processes on different scales and at different stages of evolution can contribute to this loss of angular momentum. In order to set constraints on these processes and better understand this transfer of angular momentum, a detailed observational census and characterization of rotation at all stages of evolution and over all scales of star forming regions is necessary. This review presents the main results obtained in low-mass star forming regions over the past four decades in this field of research. It addresses the search and characterization of rotation in molecular clouds, prestellar and protostellar cores, circumstellar disks, and jets. Perspectives offered by ALMA are briefly discussed.
1 Introduction
Rotation is a ubiquitous phenomenon from the largest to the smallest scales in our Galaxy: the Galaxy itself rotates as a whole, its individual stars spin too – like our Sun –, the majority of stars belong to binary systems, and the formation of planets around stars would not be possible if a certain amount of angular momentum was not present at the beginning of the star formation process. The angular momentum thus plays a significant role during the process of star and planet formation. The typical specific angular momenta measured on different scales and at different evolutionary stages, from dense cores in molecular clouds down to the Sun, are listed in Table 1. This table shows that a parcel of gas initially located in a dense core has to reduce its angular momentum by 6 to 7 orders of magnitude in order to participate in the building of a typical star like our Sun. This puzzle has long been regarded as the “angular momentum problem” in the field of star formation (e.g., Spitzer 1978; Bodenheimer 1995; Mathieu 2004). Obviously, since angular momentum is a conserved quantity, this loss of angular momentum has to occur by transfer to other particles that will not be incorporated into the star. For instance, a fraction of the angular momentum initially present in a dense core can be stored by fragmentation into the orbital motion of a binary system. However, this fraction is typically on the order of a few percent only (see Table 1) and this process alone cannot solve the angular momentum problem. Magnetic braking may also play a significant role in carrying away angular momentum via Alfvén waves during the early phases of star formation (see, e.g., Bodenheimer 1995 , and the review of P. Hennebelle in this volume).
| Object | References | |
|---|---|---|
| (cm2 s-1) | ||
| Dense cores in molecular clouds | 1 | |
| Protoplanetary disks | 2 | |
| Pre-main-sequence binaries | 3 | |
| Pre-main-sequence stars | 4 | |
| Extrasolar planetary systems (exoplanet(s) + star) | 5, 6 | |
| Solar system (planets + Sun) | 7 | |
| Sun | 8 |
The specific angular momentum of a dense core has to be reduced by about two orders of magnitude during its gravitational collapse until the formation of a protoplanetary disk (see Table 1). During this protostellar phase, the ejection of matter in jets and outflows can partly contribute to this loss of angular momentum. Later on, the (proto)star-plus-disk system has to reduce its specific angular momentum by still a few orders of magnitude to reach the level of our solar system, which appears to have a typical specific angular momentum compared to the currently known extrasolar planetary systems (see Table 1). Finally, the star itself has to reduce its angular momentum by one to two orders of magnitude from the pre main sequence to the main sequence at the age of the Sun. Star-disk interactions and magnetized stellar winds are thought to play a significant role in this respect (see the review of J. Bouvier in this volume). The solution of the angular momentum problem obviously involves different physical processes at various stages during the process of star formation.
In order to better understand when and how these transfers of angular momentum occur during the process of star formation and set constraints on the physical processes at work, it is essential to collect measurements of rotation on different scales and at different evolutionary stages of the star formation process. With this in mind, the aim of this review is to present an overview of the observational results that were obtained on rotation in star forming regions over the past four decades until February 2013. An earlier review, which also discussed the physical processes thought to be at work on a theoretical basis, was presented by Bodenheimer (1995) about two decades ago. Since then, many new observational results have been collected. These new results, as well as the earlier ones, are reviewed here critically. As a caveat, we stress that this review focuses on low-mass star forming regions only111Some aspects of rotation in high-mass star forming regions are discussed in, e.g., Pirogov et al. (2003), Cesaroni et al. (2007), Beltrán et al. (2011), and Li et al. (2012)..
The basic tools that can be used to probe rotation in star forming regions are presented in Sect. 2. Section 3 addresses the search for rotational signatures on large scales in molecular clouds and on smaller scales in dense cores. Sections 4 to 6 deal with more evolved stages of star formation: rotation of protostellar envelopes is examined in Sect. 4, protoplanetary disks in Sect. 5, and jets and outflows in Sect. 6. The reader will find a short summary of the main results and ideas at the end of each section. Overall conclusions are presented in Sect. 7 and some perspectives offered by the Atacama Large Millimeter/submillimeter Array (ALMA) are briefly described.
2 How to probe rotation in star forming regions
This section describes basic tools that can be used to search for signatures of rotation in star forming regions.
2.1 Centroid velocity
The centroid velocity of a molecular transition observed toward an astronomical object is the average velocity of the emitting particles along the line of sight. It corresponds to the “systemic” velocity of the object for the line of sight toward its center. There are two main traditional ways to derive the centroid velocity. For a spectrum with a shape close to a Gaussian, a least-square fitting with the 3-parameter function
| (1) |
yields the centroid velocity , as well as the peak temperature and the linewidth . The second method consists in computing the first moment of the spectrum:
| (2) |
with the number of channels in the selected velocity range over which the emission is detected and the flux density in temperature scale in channel . If the channels are independent, the uncertainty associated to the first moment is
| (3) |
with the rms noise level of the spectrum. The first method can relatively easily handle multiple components along the line of sight but convergence issues are encountered when the signal-to-noise ratio becomes too low. The second method is mathematically simple and does not evolve any fitting process, but it is more difficult to deal with multiple components and the equation may diverge when is close to zero, for instance in case of a low signal-to-noise ratio.
2.2 How does rotation manifest itself observationally?


Let’s assume an object in solid-body rotation with an angular velocity . Its rotation velocity field is defined by the equation . being uniform for solid-body rotation, is proportional to , the distance to the rotation axis. Let’s take two points and along the line of sight, and let’s call the point closest to the rotation axis along the line of sight and its distance to the rotation axis (see Fig. 1a). The projection onto the line of sight of the velocity difference between and is
| (4) |
The projection onto the line of sight of the rotation velocity is thus independent of the position along the line of sight. This implies that the centroid velocity of the spectrum is equal to the rotation velocity of () for a rotation axis orthogonal to the line of sight. The proof of Eq. 4 is actually valid for any inclination of the rotation axis to the line of sight, and the centroid velocity becomes for the general case (see Fig. 1b). As a result, the velocity gradient along the direction perpendicular to the projection onto the plane of the sky of the rotation axis is and is uniform for solid-body rotation.
If the angular velocity depends on (but not on the azimuth), the object is in differential rotation. For symmetry reasons, the centroid velocity for the line of sight with impact parameter still corresponds to the rotation velocity at projected onto the line of sight. Measuring the variations of centroid velocity as a function of thus allows to derive .
A search for rotation signature will start by investigating a map of centroid velocity. A solid-body rotation will manifest itself as a uniform gradient of centroid velocity, with a magnitude equal to . Estimating the mean velocity gradient in such a map can thus be done by a simple planar least-square fitting with the function , with and in radian (Goodman et al. 1993). The position angle of the direction of the mean velocity gradient is and its magnitude is (), with the distance. The magnitude is often given in km s-1 pc-1 (1 km s-1 pc-1 s-1).
2.3 Position-velocity diagrams


Once the direction of the mean velocity gradient is known, it is instructive to analyze the variations of the centroid velocity in a position-velocity (P-V) diagram along this direction. Figure 2a shows such a diagram for a synthetic protostellar envelope in solid-body rotation. The centroid velocity curve is a straight line with a slope equal to the velocity gradient. The deviation from a straight line indicates differential rotation, as illustrated in Fig. 2b for an envelope with . The shape of the centroid velocity curve is affected by the finite angular resolution of the telescope in the central parts, which prevents drawing any conclusion about the velocity field within the inner region of diameter about twice the beam width (). However, the emission contours in the P-V diagram provide additional information about the rotation velocity field even in the unresolved central parts. Fitting a synthetic contour map to the observed one allows to derive constraints on this velocity field down to radii smaller than , provided the contribution of other motions (infall, outflow, turbulence) is negligible or well known.
2.4 Angular momentum and rotational energy
This section lists a number of useful equations for the case of an object in solid-body rotation with a power-law density profile and a radius (see, e.g., Goldsmith & Arquilla 1985). The gradient of centroid velocity is (see Sect. 2.2). For a population of objects with random inclinations, the statistical correction to estimate the angular velocities consists in dividing the magnitudes of the velocity gradients by . The moment of inertia is , the angular momentum , and the specific angular momentum . The rotational energy is and the gravitational energy is:
| (5) |
The ratio of rotational to gravitational energies is:
| (6) |
For a uniform density (), we obtain , , and . For a centrally-peaked profile with , , , and . Note that is proportional to , with the mean density.
2.5 Basic procedure to reveal the presence of rotation
The basic procedure to reveal the presence of rotation requires a tracer being optically thin in order to trace all material along each line of sight. Of course, only the material at densities (roughly) higher than the critical density of the molecular transition is probed. One should in addition keep in mind that the molecule abundance may not be uniform due to gas-phase chemical reactions and/or gas depletion/release onto/from the dust grain surface. This can affect the derivation of the centroid velocity. The advantage of an optically thin tracer is also that its lineshape will not be distorted by optical depth effects.
The first step of the procedure is to search for a one-dimensional, systematic pattern in a map of centroid velocity. The second step consists in deriving the direction of the mean velocity gradient (via, e.g., planar least-square fitting). The final step is to analyze the P-V diagram along the direction of the mean velocity gradient. The curve of centroid velocity will indicate if the object is in solid-body or differential rotation depending if it is a straight line or not. In addition, comparing the emission contours to synthetic P-V diagrams can yield constraints on the rotation velocity field at scales even smaller than the beam.
This procedure is relatively simple but one should keep in mind that, depending on the geometry of the source, other types of motion, such as infall, outflow, or shear motions can also produce velocity gradients that could be mistaken as due to rotation.
3 Rotation of molecular clouds and prestellar cores
This section addresses the search for rotation in the prestellar phase, from the scales of molecular clouds down to prestellar cores.
3.1 Rotation of molecular clouds
Velocity gradients in tracers such as CO and 13CO in emission or H2CO in absorption were found in large-scale maps of molecular clouds in the 70’s. They were often interpreted as indications of rotation. Fleck & Clark (1981) compiled such measurements of 13 “rotating” clouds. Their angular velocities normalized to the galactic angular velocity ranged from 7 to 300. The early interpretation of these high values was that the angular momentum of these clouds was acquired from galactic rotation, starting with corotation and then spin-up during cloud contraction. However, this interpretation was questioned by the random orientation of rotational axes of early-type stars, binaries, and molecular clouds with respect to . For the cloud sample mentioned above, , with the cloud radius at which the velocity gradient was measured and (see Fig. 1 of Fleck & Clark 1981). Fleck & Clark (1981) interpreted this relation as well as the cloud size distribution as resulting from the turbulent properties of the interstellar medium, a Kolmogorov cascade with turbulence being sustained on large scales by the shearing action of differential galactic rotation. Cloud “rotation” would then originate in turbulence vorticity.
Goldsmith & Arquilla (1985) analyzed a sample of 16 clouds without evident signs of high-mass star formation. The sample was biased to include only “rotating” clouds, i.e. clouds with a clear velocity gradient. The cloud sizes range from 0.1 to 17 pc with a median of 0.6 pc, and the typical densities are cm-2. Under the assumption of solid-body rotation, they found specific angular momenta scaling as , i.e. , consistent with the findings of Fleck & Clark (1981). They interpreted this relation as evidence for loss of angular momentum in the process of cloud contraction and fragmentation. They suggested that this loss could be due to the redistribution of angular momentum in the orbital motions of fragments or to magnetic braking that transfers angular momentum to larger scales. Under the assumption of uniform density, they derived ranging from 0.04 to 2.5, with a median of 0.25, suggesting that rotation is significant but does not dominate the cloud energetics. All the conclusions are based on the assumption that the velocity gradients do trace rotation. Examining in more details the 13CO 1–0 P-V diagrams of these clouds, the interpretation appears in some cases ambiguous: B361 has a P-V diagram suggestive of differential rotation along the axis of its mean velocity gradient (see Fig. 3 of Arquilla & Goldsmith 1985), but the velocity dispersion along the orthogonal axis is as large as the velocity variations along the axis of the velocity gradient (see Fig. 3b of Arquilla & Goldsmith 1986).
Finally, under the assumption that linear velocity gradients observed in their sample of 5 giant molecular clouds are due to rotation, Imara & Blitz (2011) find that the specific angular momentum of these clouds is smaller than that in the surrounding atomic gas out of which these clouds formed. Even more importantly, they find that the velocity gradient position angles in the molecular and atomic gas are largely divergent, which leads them to suggest that rotation may not be the best explanation of the velocity fields observed in giant molecular clouds.
Overall, all these results suggest that the interpretation of velocity gradients on molecular cloud scales as due to rotation is by no means straightforward and robust (but see Phillips 1999 for an alternative view).
3.2 Rotation of dense cores
The presence of rotation on smaller scales corresponding to dense cores traced with ammonia ( cm-2) was investigated by Goodman et al. (1993). Their sample contains 43 cores with radii ranging from 0.1 to 0.5 pc. Significant velocity gradients were found in a large fraction of the sample. Some neighboring cores have non-parallel velocity gradients (see, e.g., their Fig. 4a). The gradient directions do not correlate with the core elongations. The orientations of the gradients are random within a complex, for instance for the subsample of 16 cores in Taurus. At least two cores, L1251A and L1251E, have a rotation axis not parallel to the magnetic field. Finally, assuming uniform density and not correcting for inclination, is less than 10% for most cores, with a median of 0.03, pointing to a minor role of rotation in supporting the dense cores, in agreement with the absence of correlation between rotation axis and direction of elongation.
The angular momenta derived by Goodman et al. (1993) correlate with the radii of the NH3 dense cores as , in a very similar way as for the molecular clouds (Sect. 3.1). However, the authors pointed out that, given , this correlation is dominated by . The correlation of the angular velocities with radius, , is actually very weak for their sample. In addition, they did not find any correlation between and , which could result from being proportional to , not correlating (or only weakly) with , and ammonia probing a small dynamic range of densities.
Caselli et al. (2002) probed rotation of dense cores at even higher densities with N2H+ 1–0 ( cm-3). Their sample includes 57 cores, all previously mapped in ammonia. On average, the angular velocity derived with N2H+ is 1.6 times larger than with NH3, but with a large dispersion (1.0). The directions of the N2H+ and NH3 gradients are well correlated, and the distributions of are very similar for both tracers ( and 0.03, respectively). The planar least-square fitting method was also applied on subregions of each core. This revealed that many cores have internal variations of magnitude and direction of velocity gradient. Simple solid-body rotation thus appears to be rare at the scale of dense cores.
3.3 Probing higher angular resolution
L183 is a centrally condensed, chemically evolved, high-column density prestellar core. Recent interferometric observations in N2H+ 1–0 revealed the presence of a velocity gradient on small scales (3300 AU), about 5 times larger than and with the same direction as the gradient measured on larger scales (10300 AU) with single-dish telescopes (Kirk et al. 2009). The authors interpreted the gradients as due to rotation and concluded that the core inner parts span up with rough conservation of specific angular momentum. The direction of the velocity gradient was claimed to be roughly perpendicular to the projection onto the plane of the sky of the magnetic field traced by dust polarization, possibly indicating an important role of the magnetic field in the core evolution. However, there are two caveats to this result: the velocity gradient is seen only in the northern part of the core, not toward the main peak traced with N2H+, and the positions of the continuum and N2H+ peaks do not match, suggesting that the N2H+ abundance is not uniform, which may affect the measurements of centroid velocities.
3.4 Complex motions in protoclusters
The previous sections addressed the search for rotation in relatively isolated dense cores. Since many stars form in clusters, it is relevant to investigate the rotational properties of prestellar cores located in protoclusters. The protocluster L1688 in Ophiuchus consists of 6 dense clumps, Oph A to F, within which 60 prestellar cores are embedded (Motte et al. 1998). Forty-eight of them were surveyed in N2H+ 1–0 (André et al. 2007). The centroid velocities of the cores trace their motions within the protocluster. They reveal a large-scale ( pc) velocity gradient of magnitude km s-1 pc-1 across the cloud (see Fig. 7 of André et al. 2007). The position angle (east from north) of the gradient changes from 117∘ to 186∘ when the cores in Oph B are excluded from the fit. It is thus unclear whether this large-scale velocity gradient really traces rotation of the protocluster. The N2H+ centroid-velocity map of each dense clump reveals its own kinematics (see Fig. 6 of André et al. 2007). On the one hand, the velocity structure within Oph A, B1, and B2 is highly complex, with no clear one-dimensional velocity pattern. It is thus difficult to conclude anything about rotation in these clumps. On the other hand, simple velocity gradients in Oph C and E are consistent with the presence of rotation. In Oph F, two unrelated components seem to overlap along the line of sight. Each component has a simple velocity gradient, possibly due to rotation.

The prestellar cores embedded in the clumps with possible signs of rotation represent only of the full N2H+ sample of L1688. It is thus difficult to draw general conclusions about the rotational properties of prestellar cores in protoclusters. However, a closer look at the kinematics in Oph E, which was also mapped in H13CO+ 1–0, DCO+ 2–1, and DCO+ 3–2 by André et al. (2007), is instructive. The mean velocity gradient over the clump has a magnitude of km s-1 pc-1 at . Fitting the two embedded prestellar cores Oph E-MM2d and E-MM4 separately yields velocity gradients of magnitude km s-1 pc-1 at and km s-1 pc-1 at , respectively (see Fig. 5.15 of Belloche 2002). The velocity gradients around Oph E-MM2d and E-MM4 are significantly not parallel. If they are due to rotation, then their misalignment likely results from the turbulent nature of rotation in protoclusters. This extends to much smaller scales the conclusion on the significant role of turbulence drawn on cloud scales by Fleck & Clark (1981) (see Sect. 3.1). This conclusion is further strengthened by the scaling of the angular velocity as a function of radius. We find and for the five structures with clear velocity gradient (see Fig. 3). Even if the statistics is poor, this tentative correlation of with in L1688 is close to the correlation derived on larger scales for a sample of clouds by Fleck & Clark (1981) which was interpreted as a signature of interstellar turbulence.
Assuming solid-body rotation and no correction for inclination, the velocity gradients measured for Oph C-S, E-MM2D, E-MM4, and F-MM1 imply ranging from 2 to 22% if the density is uniform, or from 0.7 to 7% if (see Table 5.7 of Belloche 2002). Like for the isolated cores mentioned in Sect. 3.2, rotation is energetically not dominant in the protocluster L1688, down to scales of a few 1000 AU. Finally, we note that the rotation period associated with the derived angular velocities of the prestellar cores in L1688 is on the order of yr without correction for inclination. This is a factor 2 to 10 longer than the lifetime of the L1688 prestellar cores estimated by André et al. (2007). This confirms that rotation is dynamically not dominant at the scale of prestellar cores in this protocluster.
3.5 Peculiar motions in starless cores
This section addresses two cases further illustrating the difficulties in probing rotation in starless cores. L1506C is a large, low-density, starless core embedded in a filament in Taurus. Its inner parts ( pc) are characterized by a very low level of turbulence ( m s-1) and a high level of C18O depletion, unexpected given the low density of the core (Pagani et al. 2010). The authors proposed that this high level of depletion is related to the low level of turbulence promoting dust coagulation, which in turn may decrease the desorption efficiency. An even more puzzling property of this core is its kinematical structure: Pagani et al. (2010) report a velocity gradient in 13CO with a direction opposite to the velocity gradients traced by C18O and N2H+. Their detailed radiative transfer analysis shows that the inner parts are contracting ( km s-1) and rotating with , and the outer parts are expanding ( km s-1) and rotating in opposite direction. Pagani et al. (2010) interprete these properties as evidence for decoupling of the inner core from the external parts, and suggest that L1506C is a prestellar core in the making. The peculiar velocity fields (infall/expansion, counter-rotation) remain however to be explained physically: the authors suggest that they may result from oscillations produced by magnetic torques. Alternatively, the velocity gradients may not trace rotation.
The prototypical, isolated, starless core B68 is supported by thermal pressure (Alves et al. 2001; Lada et al. 2003). Lada et al. (2003) reported an approximately east-west velocity gradient, which they interpreted as rotation with . However, the presence of a “bullet” to the south-east of B68 led Burkert & Alves (2009) to propose that B68 is undergoing a collision with this small core, which they qualitatively reproduced with hydrodynamic simulations. This scenario was recently followed-up by Nielbock et al. (2012) who analyze larger maps of centroid velocity. They establish a connection between the systemic velocity of the putative colliding small core and the velocity gradient seen across B68 (see their Fig. 17). On even larger scales, their 13CO 2–1 centroid-velocity map shows that the velocity structure of B68 is related to a larger-scale gradient along a large-scale underlying filamentary structure (see their Fig. 18). This velocity gradient could be due to streaming motions of cores along the filamentary structure rather than rotation. This would support the collision interpretation for B68.
3.6 Reliability of angular momenta derived observationally
The rotation measurements reported in the previous sections are based on two-dimensional centroid-velocity maps. The loss of the third spatial dimension inherent in astronomical observations may bias the interpretation of velocity gradients, and in particular the calculation of angular momenta. Dib et al. (2010) investigate this issue by means of three-dimensional magnetohydrodynamic simulations of isothermal, self-gravitating clouds with decaying turbulence. The rms Mach number of turbulence in their simulations is similar to those of the Ophiuchus (L1688) and Perseus molecular clouds. The dense cores generated in these simulations show a variety of morphologies, from roundish to filamentary (see their Fig. 3). The authors compute projected maps of centroid velocity to compare the outcome of the simulations to observations. As their Fig. 9 shows, turbulence generates velocity gradients qualitatively similar to those measured in molecular cloud cores. Dib et al. (2010) compute the distribution of 3D specific angular momenta () of their synthetic magnetized cores. They find a median about 5 to 10 times lower than the median of angular momenta () derived observationally from two-dimensional centroid-velocity maps of NH3 and N2H+ dense cores (see Sect. 3.2).
To understand this discrepancy, they also compute the specific angular momenta of the synthetic cores by following the observational procedure (), i.e. measuring the mean velocity gradient in projected maps of centroid velocity and assuming solid-body rotation and uniform density to compute the angular momentum. They find one order of magnitude larger than for their synthetic cores, i.e. values consistent with the observed ones (). The “rotational” properties of the synthetic cores are thus very similar to the observed ones, but this analysis suggests that the assumption of solid-body rotation and uniform density to compute the specific angular momentum of a prestellar core based on a two-dimensional map overestimates the true value of the angular momentum. Assuming centrally peaked density profiles is not sufficient to remove the discrepancy. Interestingly, Dib et al. (2010) find a correlation between and somewhat steeper than between and (exponent 1.8–2 vs. 1.1–1.3).
A puzzling result of this work, however, is that the synthetic and observed cores have similar distributions of ( for the former and for the latter) while could have been expected a priori given that . A key result to solve this puzzle is provided by Offner et al. (2008) who did a similar analysis for a population of non-magnetized synthetic cores. They obtain –0.1 for the synthetic cores (see their Fig. 5), in rough agreement with the findings of Dib et al. (2010). In addition, they compute for the synthetic cores and obtain a median value close to 1, which explains why Dib et al. (2010) find a good agreement between and . The reason why while –0.1 is unclear. We speculate that it is due to the scalar nature of as opposed to the vectorial nature of the angular momentum. Two parcels of gas with opposite will not contribute to the total angular momentum while they will both contribute to the “rotational” energy. This illustrates that certainly includes more than pure rotational energy.
3.7 Summary
Given their scaling properties, the velocity gradients measured in molecular clouds and interpreted as rotation likely originate in turbulence vorticity. At the scale of dense cores, the rotational energy is only a few percent of the gravitational energy. Rotation is thus energetically not dominant. The direction of rotation axis is not correlated with the core elongation or the magnetic-field direction. The correlation between the specific angular momentum and the radius () is similar to the one found on larger scales for molecular clouds. Interpreted in terms of rotation, it suggests a loss of angular momentum during the contraction process of dense cores. This loss could be due to magnetic braking, gravitational torques, or result from the transfer of angular momentum into the orbital motion of fragments. However, as for clouds, this behaviour may simply result from the properties of interstellar turbulence. The interpretation of velocity gradients in clouds and dense cores as rotation is therefore not unique. In any case, although often used as a zeroth-order approximation, solid-body rotation appears to be rare, which, in combination with the two-dimensional nature of astronomical data, likely results in overestimating the specific angular momenta and the ratios of rotational to gravitational energies. Finally, the velocity structure in protoclusters or “non-isolated” cores is often complex, resulting from, e.g., confusion along the line of sight, shear motions, or streaming motions along filamentary structures. In protoclusters, turbulence seems again to play a major role in the production of velocity gradients. Probing rotation at the prestellar stage is thus often more challenging than one could naively expect.
4 Rotation of protostellar envelopes
4.1 General properties of protostars
Protostars are systems in the main accretion phase, with a stellar embryo – i.e. an hydrostatic object – at their center, accumulating mass from a collapsing envelope and/or accreting circumstellar disk. This accretion process is systematically accompanied by ejection of matter in the form of bipolar jets and outflows. Two types of protostars have been defined observationally: Class 0 protostars have most of their mass still in the envelope () while Class I protostars have accreted most of their mass () (André et al. 1993, 2000). In the Class 0 phase, the envelope is still prominent and should retain memory of its initial conditions, and in particular have similar properties as in the prestellar phase. In the Class I phase, the system is dominated by a star-disk system, with a residual envelope.
Studying protostars is highly relevant for understanding star formation, and in particular the evolution of angular momentum, because a protostar will form a star. This is not necessarily the case for starless cores, some of them being maybe only transient structures (see, e.g., Belloche et al. 2011 for a discussion of the fate of starless cores). The advantage of protostars over starless cores for searching for rotation is that the position of the system “center” is known. In addition, jets and outflows, which are thought to be driven by magnetocentrifugal acceleration (e.g., Königl & Pudritz 2000; Shu et al. 2000), define a “natural” axis for rotation a priori. In addition, they can give clues about the inclination of the system (Cabrit & Bertout 1990), which is needed to derive the angular velocity and angular momentum.
4.2 Rotation and outflow axis
As stated in Sect. 4.1, we naively expect to find velocity gradients tracing rotation in protostellar envelopes in the direction perpendicular to the outflow axis. In practice, this is not often the case. Curtis & Richer (2011) surveyed starless and protostellar cores in Perseus in C18O 3–2. Seven Class 0 cores have a simple bipolar CO outflow and a significant C18O velocity gradient. For two of them, the velocity gradient is roughly orthogonal to the outflow axis, as we expect for rotation, but for 5 of them, it is roughly parallel. This may indicate that the rotation axis changes direction from large scales (– cm-3) to small scales where the jet/outflow is launched (at most a few AU, see Sect. 6 and, e.g., Ferreira et al. 2006). Alternatively, C18O 3–2 observed with single-dish telescopes may be a poor probe of envelope rotation. C18O is indeed known to suffer from depletion at high density. Entrainment by the outflow may in addition contaminate the P-V diagrams. In high-density protoclusters, C18O 3–2 may also be too sensitive to the ambient cloud.
Tobin et al. (2011) surveyed 17 isolated, mostly Class 0 but also a few Class I, protostellar envelopes in N2H+ 1–0 and NH3 (1,1) with single-dish telescopes and interferometers. The single-dish maps reveal 11 sources (out of 16) with a velocity-gradient direction lying within 45∘ of the normal to the outflow, and 12 sources out of 14 observed interferometrically have the same property (see their Fig. 27). In addition, the directions of the single-dish and interferometric gradients are found to be generally consistent (see their Fig. 28). The average magnitude of the single-dish velocity gradients is 2.2 km s-1 pc-1, and 8.6 for the interferometric data. From these results, it is tempting to interprete the velocity gradients as due to rotation, with spinning-up from large ( AU) to smaller ( AU) scales. However, there is a significant spread of position angle relative to the normal to the outflow, which may indicate that the velocity gradients do not trace pure rotation. But if they do, then, again, these offsets imply that the orientation of the rotation axis changes from scales of AU to scales of a few AU where the jets/outflows are launched. The authors suggest also that the rotation signature may be affected by the asymmetry of the envelopes, most of them being indeed found to be asymmetric (Tobin et al. 2010a). Note also that both tracers used by Tobin et al. (2011) do not peak on the central protostar in general, suggesting that they do not trace well the innermost parts ( AU).
Chen et al. (2007) carried out a similar interferometric survey of 8 Class 0 protostars in N2H+ 1–0. Only two of these sources, which are also in the sample of Tobin et al. (2011), have a velocity gradient close to the normal to the outflow. Combining both samples, only 12 out of 19 Class 0 envelopes have this property on scales –8000 AU. We conclude from this that even N2H+ 1–0 is not an ideal probe of rotation in protostellar envelopes, or, again, that the angular momentum on scales at which the jet/outflow is launched ( a few AU) has a significantly different direction than on scales of a few thousand AU. In the latter case, it would be tempting to conclude that turbulence vorticity, rather than well-ordered rotation, still dominates the velocity field on scales of a few thousand AU. It would then be interesting to check whether the protostellar envelopes with a velocity gradient not perpendicular to the outflow axis are also those with a higher level of turbulence.
Finally, in this context, it is worth mentioning that the TADPOL polarization survey performed toward a sample of 27 protostellar sources with CARMA found a random orientation of the magnetic fields with respect to the outflow axes on scales of AU (Hull et al. 2012). This and the results mentioned in the previous paragraphs suggest that the naive picture of the rotation, magnetic field, and outflow axes being aligned in a protostellar envelope is rare at this scale. For completeness, it would be interesting to investigate if there is a degree of correlation between the magnetic field direction and the direction of the velocity gradients thought to trace rotation in these protostellar envelopes.
4.3 The test case IRAM 04191
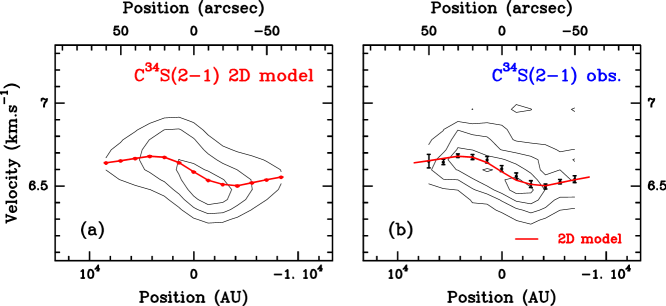
IRAM 04191+1522 – hereafter IRAM 04191 – is a very young Class 0 protostar (1– yr) located in Taurus. It has a prominent envelope () and drives a collimated outflow (André et al. 1999). Its internal luminosity is very low (, Dunham et al. 2006). IRAM 04191 belongs to the “well-behaved” protostellar envelopes in terms of velocity gradient: it harbors a regular, large-scale velocity gradient the direction of which is parallel to the envelope major axis and orthogonal to the outflow axis (see Fig. 2 of Belloche et al. 2002). Its centroid-velocity curve along the direction of the mean velocity gradient is not a straight line, but it is centrosymmetric, which is a strong evidence for rotation (see Fig. 4b). The magnitude of the velocity gradient is 7–10 km s-1 pc-1 at AU, 1.3 km s-1 pc-1 at AU, and km s-1 pc-1 at AU (Belloche et al. 2002). The envelope is thus in differential rotation, the inner parts rotating faster than the outer parts. The observed P-V diagram is well reproduced by a parametric model of a differentially rotating, infalling, spherical envelope, with CS (and C34S) depleted toward the center (see Fig. 4a). The model fits well several transitions of CS and C34S and strong constraints on the infall and rotation velocity fields could be derived (see Figs. 14 and 12 of Belloche et al. 2002). These kinematical features are in qualitative agreement with a model of Basu & Mouschovias (1995) of a supercritical magnetized envelope collapsing and detaching from its subcritical environment (see Belloche et al. 2002 and Fig. 5).
The differential pattern seen in the P-V diagram of IRAM 04191 is not unique: the P-V diagram of CB230 shows a similar shape for instance (see Fig. 24 of Tobin et al. 2011). But only 2–3 protostellar envelopes have a similar P-V diagram out of 17 observed by Tobin et al. (2011). Therefore the conclusions obtained for IRAM 04191 cannot be generalized to all Class 0 protostars.
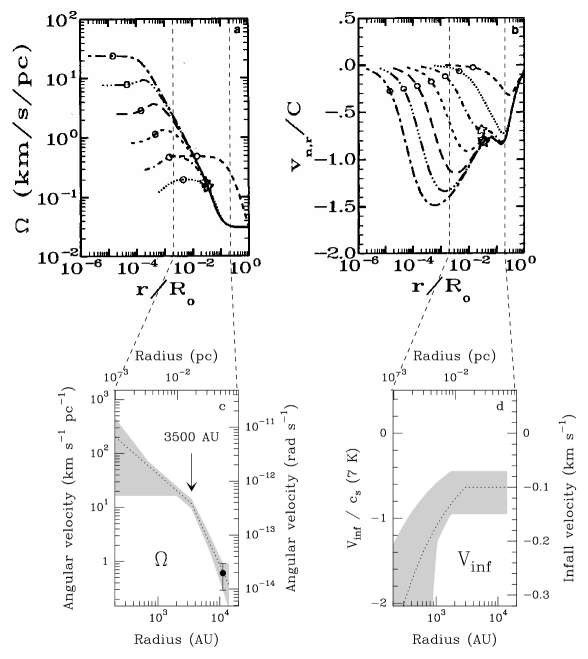
On smaller scales, the angular velocity of the envelope of IRAM 04191 keeps increasing. Belloche & André (2004a) derive a velocity gradient of 26 km s-1 pc-1 at AU from N2H+ 1–0 interferometric observations. However, the N2H+ emission map presents a hole toward the center and the column density profile is consistent with N2H+ being absent from the gas phase for AU (see Figs. 1 and 4b of Belloche & André 2004b). Because there is no evidence for strong C18O desorption, Belloche & André (2004b) conclude that N2H+ suffers from depletion at densities higher than cm-3. Based on independent N2H+ 1–0 interferometric measurements with similar angular resolution, Lee et al. (2005) report a linear velocity gradient for AU. They conclude that the innermost parts of the envelope are in solid-body rotation, indicating that the infalling material loses angular momentum, possibly due to magnetic braking like in the collapse simulations of magnetized singular isothermal toroids by Allen et al. (2003). However, an alternative (more likely?) explanation is that the depletion of N2H+ from the gas phase significantly affects the P-V diagram. If there is no molecule emitting below a radius , then the P-V diagram for will trace the velocity field of the shell of radius only, which, in projection, will appear as a linear velocity gradient. A tracer less sensitive to depletion is thus necessary to unambiguously probe the rotational properties of the innermost parts of the IRAM 04191 envelope. H2D+ may be a good candidate (Walmsley et al. 2004).
4.4 Do velocity gradients really trace rotation of protostellar envelopes?
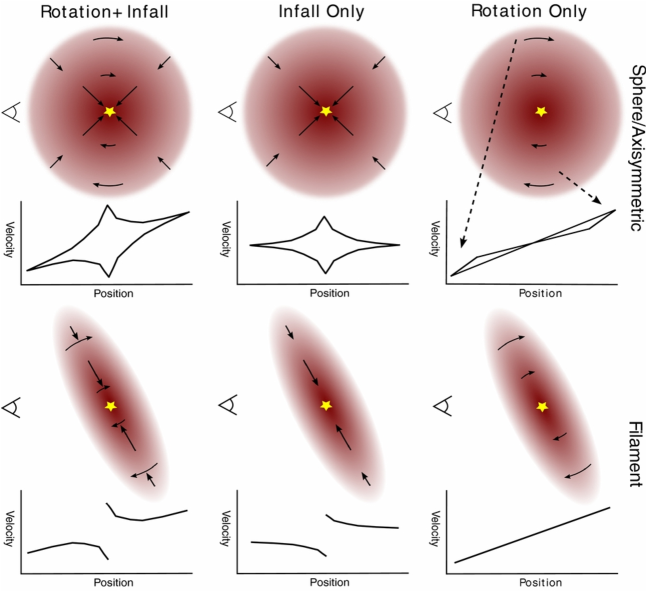
The protostellar envelopes studied by Tobin et al. (2010a) are often flattened. They even find indications that some of them are filamentary. Tobin et al. (2012a) argue that infall in such prolate structures at intermediate inclination would produce a gradient in centroid-velocity maps that can mimic (differential) rotation (see Fig. 6). As a proof of concept, they use an analytic model of rotating collapse based on Ulrich (1976) and Cassen & Moosman (1981), where the self-gravity of infalling gas is neglected. The particles follow ballistic trajectories around a central gravitating mass. The model is truncated to mimic a filamentary structure. This model is applied to 5 sources of Tobin et al. (2011) with a well-ordered velocity field. Most P-V diagrams can be reasonably well fitted with such a model of collapsing filament. The agreement between model and observations is not a proof that the kinematics is effectively dominated by infall in a filamentary structure, but it shows that this idea is a viable concept. If envelopes are really filamentary, then the velocity gradients could probe infall rather than rotation. In this case, it would become necessary to go to smaller scales to trace rotation and derive meaningful constraints on the distribution of angular momentum.
4.5 Specific angular momentum in protostellar envelopes

In this Section, we assume that velocity gradients do trace rotation in protostellar envelopes. Ohashi et al. (1997) compiled measurements of velocity gradients in a few protostellar envelopes and circumstellar disks of the Taurus molecular cloud made in the 90’s. The specific angular momenta of these systems are compared to those of the NH3 dense cores of Goodman et al. (1993) in Fig. 7, which can be interpreted as an evolutionary diagram. The measurements obtained for IRAM 04191 (see Sect. 4.3) are also displayed. The local specific angular momentum is approximately constant for infalling envelopes and circumstellar disks in Taurus (about km s-1 pc or cm2 s-1, see dashed line in Fig. 7), while the angular velocity is approximately constant for the dense core regime (see solid line in Fig. 7). The transition between the dense core – correlation to a regime of constant specific angular momentum occurs at a radius of AU or pc. As pointed out by Ohashi et al. (1997), this appears to be the scale below which the collapse is dynamical with conservation of angular momentum. The interpretation of the inner envelope of IRAM 04191 being a magnetically supercritical core detaching from its subcritical environment (Sect. 4.3) fits relatively well into this pattern222Beware, however, that the datapoints for IRAM 04191 in Fig. 7 represent the profile of specific angular momentum for an envelope at a given time, while the other points rather correspond to the evolution in time of the specific angular momentum of protostellar systems, which is conceptually different. A direct comparison is therefore not straightforward.. A more complete version of this diagram will be presented and discussed in Sect. 7.2.
4.6 Summary
The velocity structure of protostellar envelopes is often complex. In about of the cases, the velocity gradient in the envelope is not orthogonal to the outflow axis. This suggests that either velocity gradients do not reliably trace rotation (on scales 1000–10000 AU), or the direction of the rotation axis changes from large ( AU) to small ( a few AU) scales where the jets/outflows are launched. Given that protostellar envelopes are often asymmetric, the velocity gradients may also trace infall if the envelopes have a filamentary structure. Therefore, velocity gradients do not unambiguously trace rotation in protostellar envelopes. However, if the rotation signature in P-V diagrams can be trusted, there are good indications for differential rotation, with spinning-up of the inner parts, to occur below pc (e.g., IRAM 04191). In addition, there seems to be in Taurus a characteristic scale of pc below which the specific angular momentum is conserved, probably as a result of dynamical collapse.
5 Rotation of protoplanetary disks
5.1 General properties of circumstellar disks
The presence of disks aroung young pre-main-sequence (PMS) stars was initially inferred from the infrared excess emission in the spectral energy distribution of these stars. The flattened morphology of these putative disks was later confirmed by imaging, in particular as shadows in front of a bright background in the optical (see, e.g., Figs. 1 of McCaughrean et al. 1998 and Smith et al. 2005). The lifetime of disks around solar-type PMS stars is on the order of 1–10 Myr with a median of 3 Myr (Williams & Cieza 2011). Their mass ranges from 0.5 to 50 with a median of 5 (Williams & Cieza 2011). Given the high detection rate of exoplanets around stars (e.g., Mayor et al. 2011), it is reasonable to consider the circumstellar disks around PMS stars as protoplanetary.
In the Class II phase, the median ratio of disk to star masses is 0.9% (Williams & Cieza 2011). Therefore the disk self-gravity is negligible and we expect their kinematics to be dominated by Keplerian motion, i.e. . Centroid-velocity maps of such disks are expected to have a very characteristic bipolar morphology (see, e.g., Fig. 2 of Guilloteau et al. 2006). Since Keplerian disks exist in the Class II phase (see Sect. 5.5), they must have formed during the Class 0/I protostellar phase. The next three sections will try to address the questions of when a disk appears in the process of star formation and when Keplerian rotation sets in.
5.2 Disk formation
The centrifugal radius is defined as the radius where gravity is balanced by the centrifugal force . For a collapsing, non-magnetized, singular isothermal sphere initially in solid-body rotation, the centrifugal radius is found to grow with time as:
| (7) |
with and the sound speed (Terebey et al. 1984). Under these restrictive and idealized conditions, rotationally supported disks are expected to form from the beginning of the Class 0 phase on with a radius growing as . As an illustrative application, let’s compute the expected centrifugal radius of IRAM 04191 in the framework of this model. We use the velocity gradient measured at 2000 AU to estimate (see Sect. 4.3). For a temperature of 10 K and an age of 1– yr, we find –80 AU. The constraints derived on the kinematics of the envelope imply an upper limit to the centrifugal radius of 400 AU (see Fig. 15 of Belloche et al. 2002). In addition, the weak interferometric detection in continuum emission at 1.3 mm implies either a disk mass lower than 0.001 or a disk radius smaller than 10 AU if the emission is optically thin or thick, respectively (Belloche et al. 2002). Depending on the exact age of IRAM 04191, the latter upper limit is marginally consistent with the prediction of Terebey et al. (1984).
The non-magnetized picture of disk growth described in the previous paragraph has been challenged in the past decade by the advent of 3D MHD simulations. In ideal MHD, for magnetization levels comparable to those observed in dense cores, these simulations predict a “magnetic braking catastrophe” which prevents the formation of a disk when the magnetic field is parallel to the rotation axis (e.g., Mellon & Li 2008; Hennebelle & Fromang 2008 ; see also the axisymmetric simulations of Allen et al. 2003). When the initial magnetic and rotation axes are not aligned, disk formation can occur depending on the initial mass-to-magnetic-flux ratio (Hennebelle & Ciardi 2009; Joos et al. 2012). Non-ideal MHD effects such as ambipolar diffusion, Ohmic dissipation, and the Hall effect, have also been investigated recently (e.g., Shu et al. 2006; Mellon & Li 2009; Krasnopolsky et al. 2010; Dapp & Basu 2010; Machida et al. 2011; Krasnopolsky et al. 2011; Li et al. 2011). Ambipolar diffusion does not change the disk outcome, but Ohmic dissipation and the Hall effect may (or not) enable the formation of rotationally supported disks in the Class 0 phase, albeit maybe small ones only ( a few AU, see discussion in Li et al. 2011). This is currently an active field of research and the conclusions are not well settled. Observational constraints on the formation of disks in the Class 0 phase are highly needed.
5.3 Class 0 protostellar disks (?)
Several interferometric surveys were performed in dust continuum emission to search for disks around Class 0 and I protostars. The PROSAC survey was performed at 1.1 mm with the SMA with an angular resolution of 1–3′′ (i.e. not sufficient to resolve most disks), with complementary single-dish maps obtained at 870 m with SCUBA on JCMT. The sample includes 10 Class 0 and 9 Class I protostars at distances ranging from 125 to 325 pc (Jørgensen et al. 2009). The respective contributions of the envelope and the (unresolved) “disk” to the continuum emission was estimated using a parametric model of spherically-symmetric protostellar envelopes with a power-law density structure. Assuming 30 K for the disk emission and the same dust opacity coefficient as for the envelope, Jørgensen et al. (2009) derived a median disk mass of 0.09 M⊙ for Class 0 and 0.011 for Class I objects. After corrections for non-uniform temperature, they obtain the same median disk mass for Class 0 and I protostars (). Taking grain growth into account would lower the Class I median mass with respect to the Class 0 one. It appears from this study that (massive) disks are formed early in the Class 0 phase and that the infalling material from the envelope must be rapidly transported through the disk onto the star.
Enoch et al. (2011) surveyed 9 Class 0 and 3 Class I protostars in Serpens with CARMA at 1.3 mm with an angular resolution of . They estimated the “disk” masses from the long-baseline (50 k) flux, arguing that the envelope emission contributes to at most 30% and can be neglected. They detected 6 Class 0 sources and obtained a median disk mass of 0.15 . Based on this small sample, they did not see any obvious systematic variation of the disk mass from the Class 0 to the Class I phase, in agreement with Jørgensen et al. (2009).
Maury et al. (2010) compare the results of their sub-arcsecond resolution (–0.5′′), dust continuum survey of 5 Class 0 protostars in Taurus and Perseus performed with the IRAM Plateau de Bure interferometer (PdBI) to the outcome of hydrodynamic simulations of a massive (0.7 ) disk around a 0.7 star, which fragments rapidly and may thus exist only during the Class 0 phase (Stamatellos & Whitworth 2009). They conclude that the data are not consistent with the model and that none of their sources can harbor such a massive disk. However, they do not exclude the presence of 0.1 disks.
Although the results of Jørgensen et al. (2009) and Enoch et al. (2011) tend to suggest that “disks” are common in the Class 0 phase, a significant number of Class 0 protostars do not show any evidence for the presence of such disks: for 3 sources in Serpens (Enoch et al. 2011), for L483 (Jørgensen et al. 2009), for L723 (Girart et al. 2009), and for IRAM 04191 (Belloche et al. 2002). L1521F is even weaker than IRAM 04191 in the survey of Maury et al. (2010), suggesting that its disk, if any, is even less massive.
Although Jørgensen et al. (2009) and Enoch et al. (2011) claim detecting “disks” in their samples of Class 0 sources, it is important to keep in mind that the emission was not resolved by these observations and that strong assumptions about the structure of the envelope – spherically-symmetric envelope with power-law structure for the former study, no envelope contribution at 50 k for the latter – had to be made in order to derive the excess emission attributed to a “disk”. Chiang et al. (2008) compared the emission of 4 Class 0 sources observed by Looney et al. (2000) at sub-arcsecond resolution () with BIMA – 3 being also in the PROSAC sample – with a model of a collapsing, magnetized envelope (Tassis & Mouschovias 2005). They obtain good fits for all their sources without the need for an additional circumstellar-disk component at the 90% confidence level, which contradicts the conclusions of Jørgensen et al. (2009) for the sources that both studies have in common. This shows that knowing the inner structure of the envelope, which departs from a power-law in the model of Tassis & Mouschovias (2005), is crucial to derive reliable constraints on the mass of a putative disk. Chiang et al. (2008) mention that models with a disk mass up to in addition to the magnetized envelope give acceptable fits also.
The unresolved components interpreted as disks by Jørgensen et al. (2009) and Enoch et al. (2011) may actually be infalling, magnetized pseudo-disks (e.g., Hennebelle & Fromang 2008), i.e. structures that become flattened because of the magnetic field rather than rotation. The observed unresolved components could also be related to outflow cavities rather than circumstellar disks (Joos et al. 2012). Higher-angular resolution is necessary to better resolve the continuum emission and allow for a detailed comparison to predictions of collapse models. In addition, probing the velocity field of these compact structures will be crucial to distinguish between the alternatives mentioned above: for instance, a magnetic pseudo-disk should be infalling while the velocity field of a rotationally supported disk should be dominated by rotation.
One of the highest-resolution study of the kinematics of the inner parts of a Class 0 protostellar envelope was done by Choi et al. (2010). They mapped the Class 0 binary system NGC 1333 IRAS 4A in NH3 (2,2) and (3,3) with VLA with an angular resolution of 0.3′′, i.e. 70 AU at the distance of 235 pc which they assume for Perseus. They detect a compact emission of deconvolved size AU around the component 4A2 and find a clear velocity gradient perpendicular to the outflow axis (see their Fig. 2). They use a parametric model of a thin disk assuming a power-law distribution for the NH3 line brightness to fit the velocity field of this compact structure. They reproduce well the position-velocity diagram taken along the direction perpendicular to the outflow assuming a rotation velocity . Assuming the structure is in Keplerian rotation, they derive the mass of the central star () and then its age ( yr) from an estimate of the mass accretion rate ( yr-1) based on the measured accretion luminosity and assuming . This age is somewhat longer than the dynamical time associated with the outflow ( yr, Knee & Sandell 2000), but is not inconsistent given the large uncertainties on the luminosity and the stellar radius. This could be the first reliable observational evidence for a rotationally supported disk in the Class 0 phase. We note however that the mass infall rate measured in the collapsing envelope is about 50 times higher than the mass accretion rate mentioned above (Di Francesco et al. 2001; Belloche et al. 2006). The mass accretion rate may thus have been underestimated and radial motions in the “disk” may still be significant, implying in turn that the measured rotation velocities may be sub-Keplerian and not Keplerian. In any case, a better resolved velocity profile is needed in order to fit the exponent of the rotation velocity profile.
Very recently, Tobin et al. (2012b) reported the detection of a Keplerian disk around the Class 0 protostar L1527 based on SMA and CARMA observations. This system is known to be edge-on with infrared images revealing on very small scales a 60 AU thick dark lane that suggests a disk seen in absorption against scattered light from the central protostar. The SMA continuum observations with angular resolution resolve a flattened structure coinciding with the infrared dark lane, with a radius of 90 AU and a mass of . The 13CO 2–1 CARMA observations show a clear velocity gradient along the flattened structure. The angular resolution is about (140 AU), but the location of the emission peak in each velocity channel was determined with higher precision, which allowed the authors to derive a velocity curve consistent with . Assuming the disk is rotationally supported, they derive a mass of for the central protostar, and then an age of yr from an estimate of the mass accretion rate ( yr-1) based on the measured accretion luminosity and assuming . This age is likely to be overestimated because it assumes a constant accretion rate. The dynamical timescale associated with the outflow is indeed an order of magnitude shorter. Like for NGC 1333 IRAS 4A, higher-angular-resolution molecular-line observations will be decisive to fit the exponent of the velocity profile and fully demonstrate the Keplerian nature of this disk. L1527 has the advantage of being a factor of closer.
5.4 Class I protostellar disks
As was seen in Sect. 5.3, the detection of rotationally supported disks in the Class 0 phase is challenging because the envelope is still prominent at this stage and its structure needs to be well understood in order to disentangle the contribution of a disk to the detected emission. From this point of view, the Class I phase is a priori more favorable because the mass of the central object (star plus disk) now dominates the system.
The kinematics of the young ( K) and luminous () Class I protostar L1551-IRS5 in Taurus was studied in C18O 1–0 with the Nobeyama Millimeter Array (NMA) ( ) by Momose et al. (1998). The continuum emission is elongated roughly perpendicular to the outflow and a clear velocity gradient is detected (see their Figs. 1 and 3). Its direction makes an intermediate angle to the outflow axis, which is interpreted as resulting from a combination of infall and rotation. Momose et al. (1998) interprete the position-velocity diagrams in terms of a flattened envelope inclined to the line of sight. Infall produces a velocity gradient along the minor axis of the continuum emission and rotation along the major axis. They derive an infall velocity . The rotation velocity is found to be in the outer parts () and consistent with both and in the inner parts. The authors estimate that contamination by the outflowing gas is negligible and derive a mass infall rate of yr-1. They estimate the centrifugal radius to be AU, the radius were the infall and rotation velocities are approximately equal. A similar analysis was done for a small C18O 1–0 survey of 2 Class 0 and 6 Class I protostars in Taurus performed with the NMA and OVRO (Ohashi et al. 1997; Ohashi 1999). The infall and rotation velocity profiles were derived from P-V diagrams along the minor and major axes, respectively. They found 3 sources with both infall and rotation signatures. From an extrapolation of the derived velocity profiles, they find centrifugal radii in the range 100–170 AU. These radii may characterize the rotationally-supported disks in the Class I phase but it should be kept in mind that they result from an extrapolation and are therefore relatively uncertain. It is in any case not a direct proof of the existence of such disks.
The Class I sources included in the PROSAC sample (see Sect. 5.3) were also observed with SMA in HCO+ 3–2 at a resolution of , i.e. about 400 AU (Brinch et al. 2007; Lommen et al. 2008; Jørgensen et al. 2009). The HCO+ emission was found to be elongated like the continuum emission for 4 out of 10 sources. For the other sources, it may be contaminated by the outflow. The P-V diagrams along the direction perpendicular to the outflow were compared to Keplerian velocity profiles for these 4 sources. The authors find such velocity profiles to be consistent with the data, suggesting that they may trace rotationally-supported disks (of sizes AU). However, these comparisons are not a proof that the “fit” is unique. Other velocity profiles may also be in reasonable agreement. There is a clear need for better resolved rotation velocity profiles for all Class I sources discussed up to here.
HH 111 is a young ( K) Class I system driving a highly collimated jet in L1617 in Orion (see Fig. 1 of Reipurth et al. 1999). Lee (2011) resolved the inner continuum emission as a flattened structure (deconvolved AU) perpendicular to the jet. The envelope is rotating, as traced in C18O 2–1 emission with SMA (, i.e. 500 AU, Lee 2010). The P-V diagram along the direction perpendicular to the jet shows a clear velocity pattern with for AU and for AU (see their Figs. 4 and 5). This P-V diagram and the one along the outflow axis are fitted with an LTE radiative-transfer model, which provides a good agreement, apart from some contamination by the outflow in the latter (see their Fig. 7). The specific angular momentum is found to be uniform ( km s-1 pc-1) over the range 2000–8000 AU, and decreasing toward the center at smaller radii. At higher-angular resolution with SMA (, i.e. 240 AU), 13CO 2–1 is, apart from some outflow contamination, well fitted by the rotation velocity profile derived above from C18O and suggests the presence of a resolved Keplerian disk (Lee 2011). From the continuum emission the author estimates a disk mass of 0.14 and from the rotation velocity profile () in the inner part a stellar mass of 1.3 . In addition, Lee (2010) argues that the compact emission probed with SO may trace an accretion shock at 400 AU. The picture emerging from these results is that HH 111 has an outer (2000–8000 AU) envelope collapsing with conservation of specific angular momentum, a transitional, sub-Keplerian, collapsing inner (400–2000 AU) envelope, and a rotationally-supported disk of radius 400 AU. One puzzle in this picture is that the rotation velocities are found to dominate over the infall velocities up to at least 8000 AU in the envelope.
Finally, let us discuss the structure of L1551-NE, a young ( K) Class I binary system in Taurus. Takakuwa et al. (2012) observed it in 0.9 mm continuum emission and in C18O 3–2 with SMA at very high angular resolution (, i.e. 100 AU). The continuum emission is ring-like, with a strong peak in the center, and is interpreted as consisting of (unresolved) circumstellar disks and a (resolved) circumbinary disk. The C18O emission is modeled with both a thin Keplerian or infalling disk. The best-fit is obtained for a Keplerian-disk velocity structure without infall. From this modeling, the authors derive a circumbinary disk radius of 300 AU, a total (circumbinary+circumstellar) disk mass of 0.05 and a stellar (binary) mass of .
The presence of rotationally supported disks is proven rather convincingly for the last two sources, HH 111 and L1551 NE, with radii of 300–400 AU. Both sources have a bolometric temperature close to the threshold separating Class I from Class 0 sources (70 K, but with the caveat that is sensitive to the inclination). The presence of extended Keplerian disks around such very young Class I sources strongly suggests that these extended disks were formed during the Class 0 phase already. This holds true only if these sources are as young as suggested by their bolometric temperatures. The PROSAC sample contains good disk candidates, but higher-angular resolution observations of optically thin tracers are needed to confirm the Keplerian rotation in these objects. Overall, the studies mentioned in this section suggest Class I disk radii in the range 100–400 AU and a disk-to-star mass ratio in the range 1–10, somewhat higher than for Class II sources (median ratio 0.9%, see Sect. 5.1).
5.5 Class II protoplanetary disks
While Keplerian rotation in circumstellar disks is still laborious to probe in the Class 0 and I phases, it is observationally well established around T Tauri stars. This is for instance well shown by the CO 2–1 survey of T Tauri disks in Taurus carried out with the PdBI at an angular resolution of (100 AU) by Simon et al. (2000). They performed a minimization of a parametric model of a disk in hydrostatic equilibrium (Dutrey et al. 1994; Guilloteau & Dutrey 1998). The velocity field is parametrized as and the best fit for all sources is obtained for , with a precision better than 10%. This allows for a precise measurement of the stellar masses.
Three recent surveys of PMS circumstellar disks were made in continuum emission: 14 low- and intermediate mass PMS stars (10 in Taurus) with CARMA (, i.e. 100 AU, Isella et al. 2009), 17 PMS stars in Ophiuchus with SMA (, i.e. 40 AU, Andrews et al. 2009, 2010), and 23 PMS stars in Taurus-Auriga with the PdBI at two frequencies ( down to , i.e. 60 AU, Guilloteau et al. 2011). For the first two datasets, the surface density profile was derived by fitting a parametric model of a 2D, flared density structure based on a similarity solution describing the viscous evolution of an accretion disk, with a viscosity scaling as (Lynden-Bell & Pringle 1974; Hartmann et al. 1998). The radiative transfer was performed with a two-layer approximation for the first study and in full 2D for the second study. The dust opacity coefficient and the gas-to-dust mass ratio were assumed to be uniform. The best-fit models of the first study yield disk radii in the range 90–320 AU, initial radii –40 AU (63% of the mass contained within , 90% within ), and initial masses in the range 0.05–0.4 . Making a number of assumptions, Isella et al. (2009) estimate the specific angular momenta required for parent dense cores to produce disks with initial radii within the range they derive. They find – km s-1 pc, 10 times smaller than the observed specific angular momenta of N2H+ dense cores of mass 1–10 . They conclude that only 10% of the core specific angular momentum was conserved during the collapse phase. Following a similar procedure with slightly different assumptions, Andrews et al. (2010) derive – km s-1 pc for their Ophiuchus sample. They argue that this matches the lower range of N2H+/NH3 dense cores, and that the agreement may even be better if the observed dense-core overestimate the true (see Sect. 3.6). It is therefore unclear whether these disks measurements imply a loss of angular momentum during the collapse phase or not.
The PdBI sample was fitted with two models, a truncated power-law model and a viscous disk model similar to the previous two studies. Guilloteau et al. (2011) find that both models fit the data equally well. The measurements were done at two frequencies, allowing the dust opacity index () to be determined across the disks. is found to increase from at center to 1.7–2 at the edges, suggesting that grains are larger toward the center. The disk outer radii are found in the range 14–600 AU, with a hint of increase with stellar age, which would be consistent with a viscous evolution. Based on the viscous disk model, the authors derive initial disk radii smaller than 100 AU.
All three studies find initial and current outer radii of PMS disks somewhat smaller than the disk radii derived for the Class I objects ( 100–400 AU, see Sect. 5.4). This may suggest that the Class I ”disks” are not yet fully rotationally supported disks or that they are pseudo-disks (see definition in Sect. 5.3). Alternatively, inferring disk evolution from current surface density profiles of observed PMS disks based on a viscous disk model may not be correct. Finally, the samples are still small, especially for the Class I phase, and may not be free of biases.
5.6 Summary
The theoretical outcome of dense core collapse is uncertain in terms of disk formation: the existence of disks and their properties depend strongly on the magnetic field configuration and on the role played by non-ideal MHD effects. The existence of rotationally supported disks in the Class 0 phase is not fully established observationally, even if two sources turn out to show good Keplerian-disk candidates. Higher angular resolution is needed to distinguish Keplerian disks from pseudo-disks or envelope small-scale structures. ”Disks” associated with Class I protostars have typical radii of 100–400 AU and disk-to-star mass ratios of 1–10. The presence of a rotation velocity field scaling as is well demonstrated in a few cases, possibly very young Class I objects, suggesting that these disks were already formed during the Class 0 phase. The scaling as may however not be an unambiguous sign of Keplerian rotation. Keplerian rotation is well established in disks around PMS stars. The small radii of these PMS disks question the Class I disks being already Keplerian. The latter may correspond to pseudo-disks.
6 Rotation of jets
6.1 Properties and origin of jets
Jets and outflows are ubiquitous in star formation. Most YSOs where accretion or infall is occuring are associated with a jet or an outflow (Cabrit 2002): Class 0 and I protostars, which have strong or residual infall in their envelope plus possibly an accretion disk, and Class II PMS stars, which have accretion disks. A strong correlation between ejection and accretion was established in Class II sources, suggesting that the ejection process is driven by disk accretion (Cabrit et al. 1990). The ratio is about 0.1–0.2 in Class II sources (Cabrit 2007). Jets from Class II sources have narrow opening angles (a few degree) beyond 50 AU and the sources have no dense envelopes to confine them, which means that they must be intrinsically collimated. It is believed that this happens through MHD self-collimation along rotating open field lines (e.g., Ferreira et al. 2006). Jets are thought to be driven by magnetocentrifugal acceleration, which implies that they remove angular momentum from the accretion disk and/or the stellar magnetosphere (see, e.g., Königl & Pudritz 2000; Shu et al. 2000; Zanni & Ferreira 2013 , and also the contribution of J. Ferreira in this volume).
Three main magnetocentrifugal mechanisms have been proposed for steady jets (see, e.g., Königl & Pudritz 2000; Shu et al. 2000; Ferreira et al. 2006 for details): the stellar wind model which launches the jet close to the stellar surface, the X-wind model for which the jet is launched from a narrow region close to the radius of the disk where it is truncated by the stellar magnetosphere, and the extended disk wind model for which the launching occurs over a wider range of disk radii (). Constraints on the launching mechanism, such as the radius where it occurs and the magnetic lever arm braking the rotating disk/star, can be derived from the location of the jet in a diagram displaying the local specific angular momentum of the jet (, with the toroidal velocity) versus its poloidal velocity () (see Fig. 2 of Ferreira et al. 2006). This motivates the search for rotation signatures in jets.
Anderson et al. (2003) computed a practical form of the equation relating the launching radius to the poloidal and toroidal velocities of the jet, and , at a distance from its axis and far from the launching region (their Equation 5):
| (8) |
As stated by Anderson et al. (2003), this equation is an approximation and is valid only when the kinetic energy of the jet is much greater than the gravitational binding energy at the launching region. It is not valid anymore when the magnetic lever arm is small, in which case more terms have to be taken into account (see their Equation 4). This is the reason why the curves of constant in Fig. 2 of Ferreira et al. (2006) are curved toward low values of the magnetic lever arm () while Equation 8 would produce straight lines. After using Equation 8, it should thus always be verified a posteriori that the gravitational energy at the launching region is negligible compared to the kinetic energy of the jet, otherwise the complete equation has to be used.
6.2 Jet rotation signature
In the absence of rotation, spectra taken at symmetric position on each side of the axis of an axisymmetric jet should have the same centroid velocity. If the jet is rotating, there should be a velocity shift between both spectra. Pesenti et al. (2004) present predictions for an optical line ([O I] at ) based on a self-similar MHD disk-wind solution and taking into account projection effects (inclination angle ) and a finite angular resolution. They investigate two ionization profiles, and , being the radius in the disk. Let’s call and the centroid velocities of spectra taken at symmetric positions at distances / on each side of the jet axis, and the poloidal and azimuthal velocities of the jet, and the velocity offset between both spectra. Under the assumption that only one streamline dominates the emission along each line of sight, we have the following equations:
| (9) |
| (10) |
Equation 9 assumes that , i.e. that the radial velocity . As shown in Fig. 3b of Pesenti et al. (2004), can be underestimated if the jet section is not well resolved (for ). This implies that only the external radius of the launching region can often be reliably determined. is also sensitive to the distribution of the line emission across the jet axis because in reality several streamlines contribute along each line of sight. If the outer, slower streamlines dominate the emission, then will also be underestimated (see the difference between the predictions for and in Fig. 3b of Pesenti et al. 2004). As a result, a careful choise of the tracer and a high angular resolution (better than 5 AU, i.e. at 125 pc) are needed to fully probe the rotation profile of the jet and test MHD launching models.
6.3 Jet rotation in the Class II and I phases
Indications of jet rotation based on measurements of transverse velocity shifts were found in a few Class I and II sources (see Sect. 6.6). One of the first claimed evidences for rotation in a jet was presented in Bacciotti et al. (2002) for the Class II object DG Tau (see Davis et al. 2000 for an earlier claim in HH 212). The authors observed with a slit parallel to the jet, at seven offsets across the jet, in optical forbidden lines ([O I], [N II], and [S II]) with an angular resolution of , i.e. about 14 AU. They applied two methods, multiple Gaussian fitting and cross-correlation of spectra at symmetric positions with respect to the jet axis, both with an accuracy of km s-1 (see their Fig. 1). They measure velocity shifts –20 km s-1 across the jet (see their Fig. 2) and conclude that the jet is rotating with –15 km s-1 for distances from the central star between and , i.e. 11 and 56 AU (in projection). In the framework of the jet launching paradigm described in Sect. 6.1, the radius of the launching region is AU for the external part of the atomic jet (Pesenti et al. 2004 , with a more sophisticated analysis than in Bacciotti et al. 2002 and Anderson et al. 2003). In addition, Bacciotti et al. (2002) estimate that the flux of angular momentum carried by the jet represents about 60% of the angular momentum loss rate needed in the disk at for accretion to occur at the observed rate. Further observations with HST/STIS in the near-UV confirmed the sign and magnitude of the velocity gradient in DG Tau (Coffey et al. 2007). Signatures of rotation were also found for the molecular (H2) jet of the Class I protostar HH 26 with observations performed in H2 1–0 S(1) with VLT/ISAAC (Chrysostomou et al. 2008). The authors derive –4 AU and estimate that the transported angular momentum flux represents about 70% of the loss rate needed for accretion. These two examples suggest that jets significantly contribute to the removal of angular momentum from accretion disks at the launching radius, both in the Class I and II phases.
Altough the previous examples suggest that jet rotation is observationally well established, contradictions found in other sources raise the question whether these tiny velocity shifts really trace rotation. Using optical lines with HST/STIS, Woitas et al. (2005) reported the detection of rotation in the jet of RW Aur based on such velocity shifts, but with a large dispersion (see their Figs. 4 and 5). However, the disk of RW Aur was found to rotate in the opposite direction, based on CO 2–1 observations with the PdBI (Cabrit et al. 2006), which casts serious doubts about the interpretation of the velocity shifts in the jet as tracing rotation. Further observations of the jet were performed in the near-UV (Coffey et al. 2012). Velocity shifts in the approaching jet lobe were found to be consistent with the disk rotation, thus in contradiction with the velocity shifts measured in the optical. But no velocity shift was apparent in the receding jet, and no velocity shift was found again in the approaching jet six months later. The detection of jet rotation in RW Aur has therefore not been secured yet.
6.4 Jet rotation in the Class 0 phase
Evidence for jet rotation has been claimed for several Class 0 protostars. For instance, velocity gradients across the jet of NGC 1333 IRAS 4A2 were reported in SiO 1–0 with the VLA (–2′′, i.e. 350–470 AU, Choi et al. 2011). The velocity gradient has the same direction for both lobes and is seen along 8 cuts perpendicular to the jet. In addition, the direction of rotation is the same as for the “disk” (Choi et al. 2010 , see Sect. 5.3). One caveat concerning the analysis is that the velocity gradient is inferred from simply connecting “blobs” in the P-V diagrams and is therefore somewhat subjective (see Fig. 2 of Choi et al. 2011). The proper motion of the outflow was measured by Choi et al. (2006) who derived a poloidal velocity km s-1. It was assumed to be the same for the SiO component. The radius of the SiO jet is found to increase linearly and the angular speed of the outer layer to decrease with distance from the protostar (see Fig. 3 of Choi et al. 2011). The specific angular momentum slightly increases with distance, which led the authors to suggest that the angular momentum injection at the basis of the jet decreases with time. At least, there seems to be no significant loss through interaction with the ambient medium. In the framework of the magnetocentrifugal launching paradigm, the derived poloidal and azimuthal velocities imply a launching radius AU (see their Fig. 5), which favors the extended disk-wind model over the X-wind and stellar-wind models, and a mass ejection efficiency as traced by the SiO component . The latter is only a crude estimate and needs to be verified with a measurement of the mass ejection rate.
6.5 Outflow rotation
So far, we discussed claims for rotation in jets. Rotation has also been searched for in molecular outflows. Molecular outflows are less collimated than jets which typically have a full opening angle . The former may consist of cloud material entrained by the latter, or material launched at larger radii than jets and maybe appearing at the stage of the first hydrostatic core already (see, e.g. Machida et al. 2008; Hennebelle & Fromang 2008). The molecular outflow of CB26, a Class I object in Taurus-Auriga, was mapped with the PdBI in CO 2–1 with an angular resolution of (about 210 AU, Launhardt et al. 2009). It is small and well collimated, and it has the same direction as the HH objects associated with CB26. A clear velocity gradient is detected orthogonal to the outflow axis (see their Fig. 4). The gradient has the same orientation as the one measured in the disk. Launhardt et al. (2009) perform an empirical, parametric modeling of the disk and outflow interferometric data, also using constraints from the spectral energy distribution and near-infrared maps. They find that a rotating outflow is consistent with the observations (see their Figs. 5 and 6), even if the exact shape of the rotation velocity profile across the outflow is not well constrained. They derive a mass and total angular momentum of the outflow two orders of magnitude smaller than the mass and angular momentum of the disk, and a specific angular momentum in the outflow similar to the one in the disk. They conclude that it will take about 1 Myr for the outflow to dissipate the mass and angular momentum of the disk, which is comparable to (although somewhat shorter than) the statistical dispersion timescale of disks in the Class II phase. In the framework of the magnetocentrifugal paradigm, the measurements imply a launching radius AU, the uncertainty being related to the inclination (Cabrit 2009). Although the interpretation in terms of rotating outflow seems plausible, Launhardt et al. (2009) do not exclude alternative interpretations, such as the presence of two unresolved outflows or jet precession.
6.6 Statistics
If the interpretation of the velocity gradients across the jets in terms of rotation is correct and if the magnetocentrifugal paradigm is the right one, then the current measurements are all consistent with the extended disk-wind model (see Fig. 3 of Ferreira et al. 2006 and Fig. 5 of Cabrit 2009, and the discussions therein). The ratios of mass ejection to mass accretion rates inferred from the analysis are –0.3 (Ferreira et al. 2006). They are consistent with the ratios directly measured for Class II sources (–0.2, Cabrit 2007).
| Jet/ | YSO | Obs. | b | Bipolar | Jet/ | Ref.e | |
|---|---|---|---|---|---|---|---|
| outflow | class | range | modea | lobesc | diskd | ||
| DG Tau | II | VIS | HST | Y | – | agreem. | 1, 2 |
| VIS | HST | Y | – | agreem. | 3 | ||
| NUV | HST | Y | – | agreem. | 3 | ||
| RW Aur | II | VIS | HST | Y | agreem. | disagr. | 4, 5 |
| VIS | HST | Y | agreem. | disagr. | 6 | ||
| NUV | HST | Y/N | ? | agreem. | 7 | ||
| TH 28 | II | VIS | HST | Y | agreem. | – | 6 |
| NUV | HST | Y | agreem. | – | 3 | ||
| CW Tau | II | VIS | HST | Y | – | agreem. | 3 |
| HH 30 | II | VIS | HST | ? | – | inconcl. | 6, 8 |
| mm | PdBI | N | – | inconcl. | 8 | ||
| CB26 | I | mm(CO) | PdBI | Y | agreem. | agreem. | 9 |
| HH 26 | I | NIR | VLT | Y | – | – | 10 |
| HH 72 | I | NIR | VLT | Y | – | – | 10 |
| HH 111 | I | NIR | GEMINI | N | – | disagr. | 11 |
| HH 34 | I | NIR | GEMINI | U | – | – | 11 |
| HH 212 | 0 | NIR | UKIRT | Y | disagr. | agreem. | 12, 13 |
| NIR | GEMINI | Y | compat. | agreem. | 11 | ||
| mm(SiO) | PdBI | Y | disagr. | disagr. | 14 | ||
| mm(SiO) | SMA | Y | agreem. | agreem. | 15 | ||
| HH 211 | 0 | mm(SiO) | SMA | Y | agreem. | agreem. | 16 |
| IRAS 4A2 | 0 | mm(SiO) | VLA | Y | agreem. | agreem. | 17 |
Notes: adapted from Table 1 of Bacciotti (2009). a Observing mode. “” and “” mean observations with a slit parallel or perpendicular to the jet axis. b “Y”/”N” mean that a velocity gradient is/is not detected. “U” means that the emission was unresolved. c “agreem.”/”disagr.” means that a velocity gradient is found in both lobes with the same/opposite orientation. A dash means that only one lobe was observed. d “agreem.”/”disagr.” means that the jet/outflow and the disk are found to rotate in the same/opposite direction. A dash means that the direction of the disk rotation is not known. e References: 1: Bacciotti et al. (2002), 2: Testi et al. (2002), 3: Coffey et al. (2007), 4: Woitas et al. (2005), 5: Cabrit et al. (2006), 6: Coffey et al. (2004), 7: Coffey et al. (2012), 8: Pety et al. (2006), 9: Launhardt et al. (2009), 10: Chrysostomou et al. (2008), 11: Coffey et al. (2011), 12: Davis et al. (2000), 13: Wiseman et al. (2001), 14: Codella et al. (2007), 15: Lee et al. (2008), 16: Lee et al. (2007), 17: Choi et al. (2011).
A summary of most measurements of rotation in jets or outflows is presented in Table 2 (adapted from Table 1 of Bacciotti 2009). Out of 13 Class 0, I, and II sources which were observed, 10 show a velocity gradient perpendicular to the jet/outflow axis. For 5 of them, the orientation of the velocity gradient is consistent with the disk rotation, which makes the interpretation in terms of jet rotation very plausible. However, in 4 cases, there is a disagreement either between the jet/outflow and disk directions of rotation (RW Aur, HH 212), or between the two jet/outflow lobes (HH 212), or no velocity gradient is found while the high inclination of the system to the line of sight () should have been favorable for a detection (HH 30, HH 111). These cases cast some doubts about the rotation interpretation. The detection of jet/outflow rotation is therefore not yet fully established.
6.7 Alternative interpretations
Several alternative interpretations instead of rotation have been proposed to explain the velocity gradients across jets/outflows. Beyond the Alfvén surface, a few AU above the disk surface, a jet may undergo various kind of instabilities which can produce differential velocities on the order of the sound speed ( km s-1), similar to the velocity shifts measured across the jets and interpreted as rotation (Bacciotti 2009). It is however likely that such instabilities would produce random or periodic velocity gradients as a function of distance from the center, and not a regular pattern as is observed in a few sources, with the same orientation in both lobes (e.g. TH 28, CB26, NGC1333 IRAS 4A2).
The effect of jet precession was investigated numerically by Cerqueira et al. (2006). They performed 3D simulations of a non-magnetic jet with variabilities in ejection direction (precession) and jet velocity (intermittence), and with or without rotation. An atomic and ionic network was included in order to compute line profiles. They found that only precession (with intermittence) or only rotation produce very similar velocity shifts, implying that such velocity shifts do not necessarily trace rotation.
Soker (2005) proposed a phenomenological model of jet interaction with a warped disk to explain the velocity shifts seen across jets. In this model, the jet interacts with the ambient gas above the disk surface and is more slowed down on the warped side of the disk than on the opposite side. In this way, one side of the jet is slower than the other, which produces a velocity shift between both sides, not due to rotation. In this model, the velocity shifts would not be seen for inclinations close to 90∘, i.e. a jet propagation in the plane of the sky. This would explain why no velocity shift is seen in the jets of HH 30 or HH 111.
Finally, if the ambient medium is not uniformly distributed, its interaction with the flow could create asymmetries in the propagation of the jet, which would in turn produce velocity shifts between both sides of the jet (Bacciotti 2009). However, persistent velocity patterns with increasing distance from the star could a priori not be produced in this way.
6.8 Summary
The following requirements are needed to convincingly detect rotation in jets or outflows. First of all, the kinematic signature, a velocity gradient perpendicular to the jet axis, has to be consistent all along the jet length. Second, the signature should be consistent between both lobes and with the disk rotation. Finally, the velocity profile should be spectrally resolved. In light of this, the detection of jet rotation is statistically not yet secure. Doubts remain because some cases present inconsistencies between the putative directions of rotation of the disk and the jet. In addition, the absence of velocity shifts in nearly edge-on systems such as HH 30 or HH 111 is puzzling since they should be the most favorable systems for the detection of jet rotation. Alternative interpretations – jet instabilities, precession coupled with modulation of jet ejection, interaction of the jet with a warped disk, asymmetric shocking – let open the question whether the measured velocity shifts really probe jet rotation or not.
Nevertheless, if the interpretation in terms of rotation is valid, then the current constraints on the poloidal and azimuthal velocities are consistent with extended disk-wind models with an external launching radius of a few AU. The Class II jets would seem to account for a large fraction (60–70%) of the loss rate of angular momentum in disk that is required at the launching radius to enable accretion at that radius.
7 Conclusions
7.1 Reliability of rotation signatures
The previous sections introduced the methods used to probe rotation in the different phases of star formation. On large scales ( pc), the velocity gradients measured in molecular clouds imply a specific angular momentum scaling as if they are interpreted in terms of rotation, possibly meaning that the contraction of molecular clouds occurs with a loss of angular momentum. However, this relation may simply be related to the scaling properties of turbulence, suggesting that the velocity gradients trace turbulence vorticity rather than pure, well-ordered rotation. On the smaller scales of dense cores ( pc), the correlation is similar, but solid-body rotation seems to be rare, and the velocity structure of dense cores in protoclusters is relatively complex. At a later stage, the velocity gradients found in protostellar envelopes are often not orthogonal to the outflow axis and the rotation signature may be ambiguous if the envelopes are prolate rather than oblate or spherical. However, there are a few “well-behaved” cases for which the signature of rotation is relatively robust. On small scales ( AU), the existence of rotationally-supported disks in the Class 0 phase is observationally not established yet. In the Class I phase, rotationally-supported disks have been claimed to be detected but there is a size issue compared to the Class II disks and the former could be “pseudo-disks”. The most robust detections of rotation have been made for the Class II phase, where the kinematic structure of the detected compact structures leaves little doubt that they are rotationally-supported disks, i.e. structures in Keplerian rotation. The ubiquitous jets found at all stages of star formation from the Class 0 to the Class II phase are expected to rotate if the current paradigm of magnetocentrifugal launching holds. Several detections of jet rotation have been claimed, but they are statistically not secure yet. If the interpretation of the measured velocity gradients in terms of rotation is valid, then these detections imply a high efficiency of angular momentum removal from the disk by the jet at a distance of a few AU from the protostar.
7.2 Evolution of angular momentum
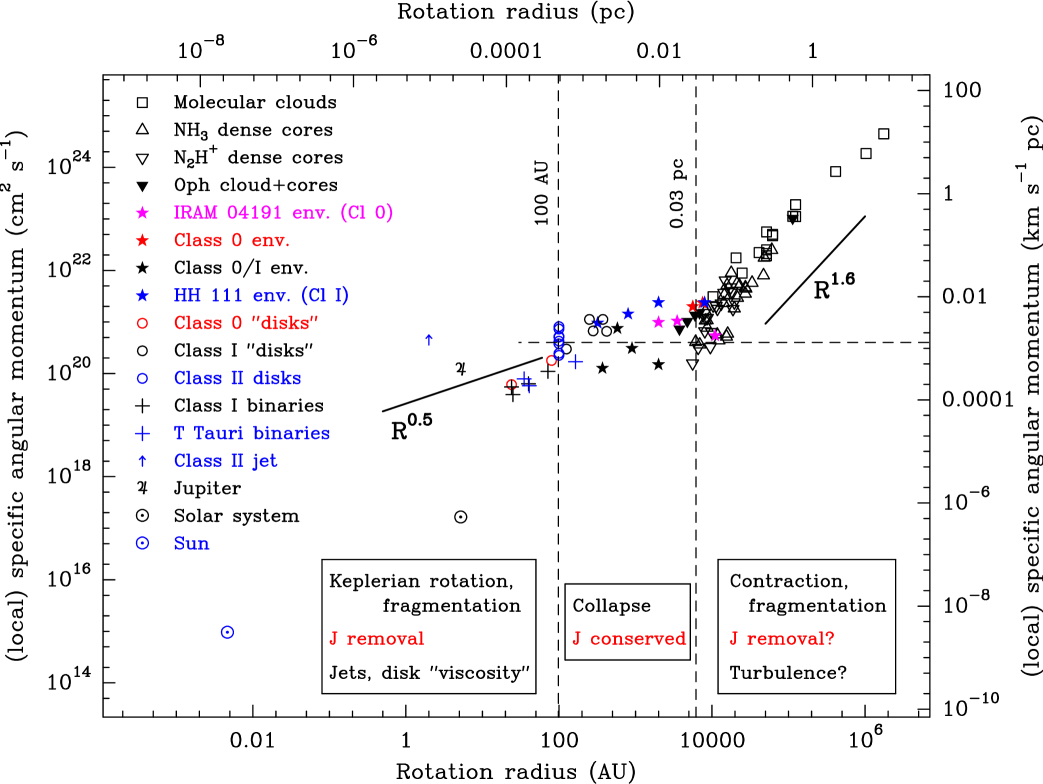
| Category | Symbol | a | Corr.b | Ref.c |
|---|---|---|---|---|
| Molecular clouds and dense cores | ||||
| Molecular clouds | open square | local | no | 1 |
| NH3 dense cores | open triangle (up) | local | no | 2 |
| N2H+ dense cores | open triangle (down) | local | no | 3 |
| Ophiuchus cloud/cores | filled triangle | local | no | 4 |
| Protostellar envelopes | ||||
| IRAM 04191 env. (Cl. 0) | purple star symbol | local | yes | 5–6 |
| Class 0 envelopes | red star symbol | local | no | 7 |
| Class 0 and I envelopes | black star symbol | local | yes | 8 |
| HH 111 env. (Cl. I) | blue star symbol | local | yes | 9 |
| Circumstellar disks | ||||
| Class 0 “disks” | red circle | local | yes | 10–11 |
| Class I “disks” | black circle | local | yes | 12–15 |
| Class II disks | blue circle | local | yes | 16 |
| Jets | ||||
| Class II jet | blue arrow | local | yes | 17 |
| Young binaries | ||||
| Class I binaries | black plus symbol | mean | no | 7, 18 |
| T Tauri binaries | blue plus symbol | mean | no | 7, 18 |
| Solar system | ||||
| Jupiter | local | yes | 19 | |
| Solar system | black | mean | yes | 19 |
| Sun | blue | mean | yes | 20 |
Notes: a Local () or mean () specific angular momentum. b Flag indicating if the correction for inclination was applied. c References: 1: Goldsmith & Arquilla (1985), 2: Goodman et al. (1993), 3: Caselli et al. (2002), 4: Belloche (2002), 5: Belloche et al. (2002), 6: Belloche & André (2004a), 7: Chen et al. (2007), 8: Ohashi et al. (1997), 9: Lee (2010), 10: Choi et al. (2010), 11: Tobin et al. (2012b), 12: Brinch et al. (2007), 13: Lommen et al. (2008), 14: Jørgensen et al. (2009), 15: Takakuwa et al. (2012), 16: Simon et al. (2000), 17: Bacciotti et al. (2002), 18: Chen (2013, priv. comm.), 19: Allen (1973), 20: Pinto et al. (2011).
As a summary of this review, Fig. 8 shows the distribution of specific angular momentum as a function of radius for different evolutionary stages – from molecular clouds to the Sun – or different scales of a star forming region – e.g., protostellar envelope, circumstellar disk, jet. References are listed in Table 3. This figure is partly based on diagrams published by Ohashi et al. (1997), Belloche et al. (2002), and Chen et al. (2007). There are several caveats to this plot. First of all, for most categories of objects, the angular momentum was derived assuming that velocity gradients do trace rotation, which, as was seen in the previous sections, may not always be true. Second, a correction for inclination was applied for most categories but not all (see Table 3). Third, the plot is a mixture of an evolutionary diagram – where the radius can be viewed as probing the contraction state of an object – and a snapshot of the structure of several objects – for which the diagram displays the angular momentum profile at a given time. Finally, the sample is certainly not complete and, in particular, upper limits for objects where no rotation was detected – in some cases maybe because of an unfavorable inclination, though – are not shown.
Despite these caveats, the overall shape of the distribution of specific angular momentum as a function of radius is likely real. Three regimes can be distinguished. On large scales, the angular momentum of molecular clouds and dense cores appears to correlate well with the radius. The specific angular momentum is reduced by nearly two orders of magnitude over two orders of magnitude in radius. On the one hand, as summarized in Sect. 3.7, this loss of angular momentum could be due to magnetic braking or gravitational torques, both transfering angular momentum to the ambient medium, or fragmentation – part of the angular momentum of the fragmenting structure being transfered into the orbital motion of its fragments. On the other hand, the correlation between “angular momentum” (derived from velocity gradients) and radius may not be directly related to rotation but rather to the properties of interstellar turbulence and the velocity gradients may trace the behaviour of turbulence vorticity. More details about the physical processes at work during this phase can be found in the introductory chapter of Hennebelle et al. in this volume.
The second regime concerns the scales between 100 AU and 0.03 pc (1.5 orders of magnitude), which correspond to the scales over which a protostellar envelope is dynamically collapsing. In this regime, as already summarized in Sect. 4.6, the specific angular momentum seems to be relatively constant, as was first noticed by Ohashi et al. (1997). This suggests that processes such as magnetic braking or fragmentation are relatively inefficient in reducing the specific angular momentum over this range of scales during the protostellar collapse. Note that Yen et al. (2011) discuss a possible evolution in time of the angular momentum plateau in this regime.
Third, the few datapoints shown below 100 AU in Fig. 8 as well as the resolved structure of Class II disks (see Sect. 5.5) suggest that Keplerian rotation dominates the kinematics on these small scales, which implies that efficient mechanisms removing a large fraction of the angular momentum from the inner parts are at work to allow accretion to proceed. Processes contributing to the outward transfer of angular momentum within circumstellar disks are discussed by S. Fromang in this volume. In addition, the tentative detection of rotation in jets, if confirmed, indicates that they do extract from circumstellar disks a significant fraction of the angular momentum in the (small) launching region (see also the review of J. Ferreira in this volume). Fragmentation and the formation of binaries on these small scales can also significantly help solving the angular momentum problem by storing a large fraction of the angular momentum into the orbital motions of the stars. Systems forming single stars, like our solar system, do however not benefit from this mechanism.
Finally, if we extrapolate the average level of specific angular momentum at 100 AU in circumstellar disks down to the radius of the Sun with a power-law consistent with Keplerian rotation (), then we obtain a value still three orders of magnitude higher than the specific angular momentum of the Sun. Processes that can reduce the specific angular momentum of a young star during its evolution (star-disk interactions, stellar winds) are addressed by J. Bouvier and J. Ferreira in this volume.
7.3 Will ALMA help us?
ALMA is approaching its completion. The early results obtained in Cycle 0 with about one third of the final number of antennae are already impressive and very promising for the future operation with the full array. With its high angular and spectral resolutions, ALMA will be a prime instrument to study the kinematics of star forming regions at very small scales with molecular line observations.
According to Schieven (2012), the finest angular resolution obtained at the highest frequency ( GHz) will be about 0.005′′ with the full array in its most extended configuration, i.e. 0.7 AU at 140 pc. The spectral line sensitivity for these extreme conditions – K in 1 min at a spectral resolution of 0.3 km/s, or K in 10 h – will not be sufficient to detect thermalized (non-masing) transitions, but lower-frequency observations are still promising: for instance, a sensitivity of 330 K for a spectral resolution of 2 km s-1 and an angular resolution of 0.03′′ – 4 AU at 140 pc – should be achievable at 150 GHz in 1 min, which translates into 13 K in 10 h. The capabilities of ALMA should thus allow to verify and firmly establish the presence of rotation in jets as well as fully resolve rotation profiles of disks around Class 0 and I sources and thereby significantly contribute to our understanding of the formation and evolution of circumstellar disks.
Acknowledgments: I am grateful to Sylvie Cabrit for enlightening discussions about rotation in jets. I thank Sean Andrews, Xuepeng Chen, Dan Clemens, Sami Dib, Stephane Guilloteau, Ralf Launhardt, Christopher McKee, and Markus Nielbock for discussions and/or for providing additional information concerning their published work. I also thank Sylvie Cabrit and Patrick Hennebelle for their careful reading of the manuscript. Finally, I warmly thank Corinne Charbonnel and Patrick Hennebelle for inviting me to the lively and very instructive Evry Schatzman summer school in the French alps where I gave this lecture.
References
- Allen et al. (2003) Allen, A., Li, Z.-Y., & Shu, F. H. 2003, ApJ, 599, 363
- Allen (1973) Allen, C. W. 1973, Astrophysical quantities, London: University of London, Athlone Press, 3rd ed.
- Alves et al. (2001) Alves, J. F., Lada, C. J., & Lada, E. A. 2001, Nature, 409, 159
- Anderson et al. (2003) Anderson, J. M., Li, Z.-Y., Krasnopolsky, R., & Blandford, R. D. 2003, ApJ, 590, L107
- André et al. (1993) André, Ph., Ward-Thompson, D., & Barsony, M. 1993, ApJ, 406, 122
- André et al. (1999) André, Ph., Motte, F., & Bacmann, A. 1999, ApJ, 513, L57
- André et al. (2000) André, Ph., Ward-Thompson, D., & Barsony, M. 2000, Protostars and Planets IV, 59
- André et al. (2007) André, Ph., Belloche, A., Motte, F., & Peretto, N. 2007, A&A, 472, 519
- Andrews et al. (2009) Andrews, S. M., Wilner, D. J., Hughes, A. M., Qi, C., & Dullemond, C. P. 2009, ApJ, 700, 1502
- Andrews et al. (2010) Andrews, S. M., Wilner, D. J., Hughes, A. M., Qi, C., & Dullemond, C. P. 2010, ApJ, 723, 1241
- Armstrong et al. (2007) Armstrong, J. C., Larson, S. L., & Zollinger, R. R. 2007, arXiv:0708.1771v2
- Arquilla & Goldsmith (1985) Arquilla, R., & Goldsmith, P. F. 1985, ApJ, 297, 436
- Arquilla & Goldsmith (1986) Arquilla, R., & Goldsmith, P. F. 1986, ApJ, 303, 356
- Bacciotti et al. (2002) Bacciotti, F., Ray, T. P., Mundt, R., Eislöffel, J., & Solf, J. 2002, ApJ, 576, 222
- Bacciotti (2009) Bacciotti, F. 2009, Protostellar Jets in Context, 231
- Basu & Mouschovias (1995) Basu, S., & Mouschovias, T. C. 1995, ApJ, 452, 386
- Belloche et al. (2002) Belloche, A., André, Ph., Despois, D., & Blinder, S. 2002, A&A, 393, 927
- Belloche (2002) Belloche, A. 2002, Ph.D. Thesis, Université Paris XI, France
- Belloche & André (2004a) Belloche, A., & André, Ph. 2004a, in The Dense Interstellar Medium in Galaxies, Proceedings of the 4th Cologne-Bonn-Zermatt Symposium, Eds. S. Pfalzner, C. Kramer, C. Staubmeier, & A. Heithausen, Springer, 633
- Belloche & André (2004b) Belloche, A., & André, Ph. 2004b, A&A, 419, L35
- Belloche et al. (2006) Belloche, A., Hennebelle, P., & André, Ph. 2006, A&A, 453, 145
- Belloche et al. (2011) Belloche, A., Parise, B., Schuller, F., et al. 2011, A&A, 535, A2
- Beltrán et al. (2011) Beltrán, M. T., Cesaroni, R., Neri, R., & Codella, C. 2011, A&A, 525, A151
- Berget & Durrance (2010) Berget, D. J., & Durrance, S. T. 2010, Journal of the Southeastern Association for Research in Astronomy, 3, 32
- Bodenheimer (1995) Bodenheimer, P. 1995, ARA&A, 33, 199
- Brinch et al. (2007) Brinch, C., Crapsi, A., Jørgensen, J. K., Hogerheijde, M. R., & Hill, T. 2007, A&A, 475, 915
- Burkert & Alves (2009) Burkert, A., & Alves, J. 2009, ApJ, 695, 1308
- Cabrit & Bertout (1990) Cabrit, S., & Bertout, C. 1990, ApJ, 348, 530
- Cabrit et al. (1990) Cabrit, S., Edwards, S., Strom, S. E., & Strom, K. M. 1990, ApJ, 354, 687
- Cabrit (2002) Cabrit, S. 2002, EAS Publications Series, 3, 147
- Cabrit et al. (2006) Cabrit, S., Pety, J., Pesenti, N., & Dougados, C. 2006, A&A, 452, 897
- Cabrit (2007) Cabrit, S. 2007, in Star-Disk Interaction in Young Stars, Proceedings of the International Astronomical Union, IAU Symposium, 243, 203
- Cabrit (2009) Cabrit, S. 2009, Protostellar Jets in Context, 247
- Caselli et al. (2002) Caselli, P., Benson, P. J., Myers, P. C., & Tafalla, M. 2002, ApJ, 572, 238
- Cassen & Moosman (1981) Cassen, P., & Moosman, A. 1981, Icarus, 48, 353
- Cerqueira et al. (2006) Cerqueira, A. H., Velázquez, P. F., Raga, A. C., Vasconcelos, M. J., & de Colle, F. 2006, A&A, 448, 231
- Cesaroni et al. (2007) Cesaroni, R., Galli, D., Lodato, G., Walmsley, C. M., & Zhang, Q. 2007, Protostars and Planets V, 197
- Chen et al. (2007) Chen, X., Launhardt, R., & Henning, T. 2007, ApJ, 669, 1058
- Chiang et al. (2008) Chiang, H.-F., Looney, L. W., Tassis, K., Mundy, L. G., & Mouschovias, T. C. 2008, ApJ, 680, 474
- Choi et al. (2006) Choi, M., Hodapp, K. W., Hayashi, M., et al. 2006, ApJ, 646, 1050
- Choi et al. (2010) Choi, M., Tatematsu, K., & Kang, M. 2010, ApJ, 723, L34
- Choi et al. (2011) Choi, M., Kang, M., & Tatematsu, K. 2011, ApJ, 728, L34
- Chrysostomou et al. (2008) Chrysostomou, A., Bacciotti, F., Nisini, B., et al. 2008, A&A, 482, 575
- Codella et al. (2007) Codella, C., Cabrit, S., Gueth, F., et al. 2007, A&A, 462, L53
- Coffey et al. (2004) Coffey, D., Bacciotti, F., Woitas, J., Ray, T. P., & Eislöffel, J. 2004, ApJ, 604, 758
- Coffey et al. (2007) Coffey, D., Bacciotti, F., Ray, T. P., Eislöffel, J., & Woitas, J. 2007, ApJ, 663, 350
- Coffey et al. (2009) Coffey, D., Bacciotti, F., Chrysostomou, A., Nisini, B., & Davis, C. 2009, Protostellar Jets in Context, 241
- Coffey et al. (2011) Coffey, D., Bacciotti, F., Chrysostomou, A., Nisini, B., & Davis, C. 2011, A&A, 526, A40
- Coffey et al. (2012) Coffey, D., Rigliaco, E., Bacciotti, F., Ray, T. P., & Eislöffel, J. 2012, ApJ, 749, 139
- Curtis & Richer (2011) Curtis, E. I., & Richer, J. S. 2011, MNRAS, 410, 75
- Dapp & Basu (2010) Dapp, W. B., & Basu, S. 2010, A&A, 521, L56
- Davis et al. (2000) Davis, C. J., Berndsen, A., Smith, M. D., Chrysostomou, A., & Hobson, J. 2000, MNRAS, 314, 241
- Dib et al. (2010) Dib, S., Hennebelle, P., Pineda, J. E., et al. 2010, ApJ, 723, 425
- Di Francesco et al. (2001) Di Francesco, J., Myers, P. C., Wilner, D. J., Ohashi, N., & Mardones, D. 2001, ApJ, 562, 770
- Dunham et al. (2006) Dunham, M. M., Evans, N. J., II, Bourke, T. L., et al. 2006, ApJ, 651, 945
- Dutrey et al. (1994) Dutrey, A., Guilloteau, S., & Simon, M. 1994, A&A, 286, 149
- Enoch et al. (2011) Enoch, M. L., Corder, S., Duchêne, G., et al. 2011, ApJS, 195, 21
- Ferreira et al. (2006) Ferreira, J., Dougados, C., & Cabrit, S. 2006, A&A, 453, 785
- Fleck & Clark (1981) Fleck, R. C., Jr., & Clark, F. O. 1981, ApJ, 245, 898
- Goldsmith & Arquilla (1985) Goldsmith, P. F., & Arquilla, R. 1985, Protostars and Planets II, 137
- Goodman et al. (1993) Goodman, A. A., Benson, P. J., Fuller, G. A., & Myers, P. C. 1993, ApJ, 406, 528
- Girart et al. (2009) Girart, J. M., Rao, R., & Estalella, R. 2009, ApJ, 694, 56
- Guilloteau & Dutrey (1998) Guilloteau, S., & Dutrey, A. 1998, A&A, 339, 467
- Guilloteau et al. (2006) Guilloteau, S., Piétu, V., Dutrey, A., & Guélin, M. 2006, A&A, 448, L5
- Guilloteau et al. (2011) Guilloteau, S., Dutrey, A., Piétu, V., & Boehler, Y. 2011, A&A, 529, A105
- Hartmann et al. (1998) Hartmann, L., Calvet, N., Gullbring, E., & D’Alessio, P. 1998, ApJ, 495, 385
- Hennebelle & Fromang (2008) Hennebelle, P., & Fromang, S. 2008, A&A, 477, 9
- Hennebelle & Ciardi (2009) Hennebelle, P., & Ciardi, A. 2009, A&A, 506, L29
- Hull et al. (2012) Hull, C. L. H., Plambeck, R. L., Bolatto, A. D., et al. 2012, arXiv:1212.0540
- Imara & Blitz (2011) Imara, N., & Blitz, L. 2011, ApJ, 732, 78
- Isella et al. (2009) Isella, A., Carpenter, J. M., & Sargent, A. I. 2009, ApJ, 701, 260
- Joos et al. (2012) Joos, M., Hennebelle, P., & Ciardi, A. 2012, A&A, 543, A128
- Jørgensen et al. (2009) Jørgensen, J. K., van Dishoeck, E. F., Visser, R., et al. 2009, A&A, 507, 861
- Kirk et al. (2009) Kirk, J. M., Crutcher, R. M., & Ward-Thompson, D. 2009, ApJ, 701, 1044
- Knee & Sandell (2000) Knee, L. B. G., & Sandell, G. 2000, A&A, 361, 671
- Königl & Pudritz (2000) Königl, A., & Pudritz, R. E. 2000, Protostars and Planets IV, 759
- Krasnopolsky et al. (2010) Krasnopolsky, R., Li, Z.-Y., & Shang, H. 2010, ApJ, 716, 1541
- Krasnopolsky et al. (2011) Krasnopolsky, R., Li, Z.-Y., & Shang, H. 2011, ApJ, 733, 54
- Lada et al. (2003) Lada, C. J., Bergin, E. A., Alves, J. F., & Huard, T. L. 2003, ApJ, 586, 286
- Launhardt et al. (2009) Launhardt, R., Pavlyuchenkov, Y., Gueth, F., et al. 2009, A&A, 494, 147
- Lee et al. (2005) Lee, C.-F., Ho, P. T. P., & White, S. M. 2005, ApJ, 619, 948
- Lee et al. (2007) Lee, C.-F., Ho, P. T. P., Palau, A., et al. 2007, ApJ, 670, 1188
- Lee et al. (2008) Lee, C.-F., Ho, P. T. P., Bourke, T. L., et al. 2008, ApJ, 685, 1026
- Lee (2010) Lee, C.-F. 2010, ApJ, 725, 712
- Lee (2011) Lee, C.-F. 2011, ApJ, 741, 62
- Li et al. (2012) Li, J., Wang, J., Gu, Q., Zhang, Z.-y., & Zheng, X. 2012, ApJ, 745, 47
- Li et al. (2011) Li, Z.-Y., Krasnopolsky, R., & Shang, H. 2011, ApJ, 738, 180
- Lommen et al. (2008) Lommen, D., Jørgensen, J. K., van Dishoeck, E. F., & Crapsi, A. 2008, A&A, 481, 141
- Looney et al. (2000) Looney, L. W., Mundy, L. G., & Welch, W. J. 2000, ApJ, 529, 477
- Lynden-Bell & Pringle (1974) Lynden-Bell, D., & Pringle, J. E. 1974, MNRAS, 168, 603
- Machida et al. (2008) Machida, M. N., Inutsuka, S.-i., & Matsumoto, T. 2008, ApJ, 676, 1088
- Machida et al. (2011) Machida, M. N., Inutsuka, S.-I., & Matsumoto, T. 2011, PASJ, 63, 555
- Mayor et al. (2011) Mayor, M., Marmier, M., Lovis, C., et al. 2011, arXiv:1109.2497
- Mathieu (2004) Mathieu, R. D. 2004, Stellar Rotation, Proceedings of IAU Symposium No. 215, held 11-15 November, 2002 in Cancun, Yucatan, Mexico. Eds. A. Maeder and P. Eenens, San Francisco: Astronomical Society of the Pacific, p. 113
- Maury et al. (2010) Maury, A. J., André, Ph., Hennebelle, P., et al. 2010, A&A, 512, A40
- McCaughrean et al. (1998) McCaughrean, M. J., Chen, H., Bally, J., et al. 1998, ApJ, 492, L157
- Mellon & Li (2008) Mellon, R. R., & Li, Z.-Y. 2008, ApJ, 681, 1356
- Mellon & Li (2009) Mellon, R. R., & Li, Z.-Y. 2009, ApJ, 698, 922
- Momose et al. (1998) Momose, M., Ohashi, N., Kawabe, R., Nakano, T., & Hayashi, M. 1998, ApJ, 504, 314
- Motte et al. (1998) Motte, F., André, Ph., & Neri, R. 1998, A&A, 336, 150
- Nielbock et al. (2012) Nielbock, M., Launhardt, R., Steinacker, J., et al. 2012, A&A, 547, A11
- Offner et al. (2008) Offner, S. S. R., Klein, R. I., & McKee, C. F. 2008, ApJ, 686, 1174
- Ohashi et al. (1997) Ohashi, N., Hayashi, M., Ho, P. T. P., et al. 1997, ApJ, 488, 317
- Ohashi (1999) Ohashi, N. 1999, Star Formation 1999, 129
- Pagani et al. (2010) Pagani, L., Ristorcelli, I., Boudet, N., et al. 2010, A&A, 512, A3
- Pesenti et al. (2004) Pesenti, N., Dougados, C., Cabrit, S., et al. 2004, A&A, 416, L9
- Pety et al. (2006) Pety, J., Gueth, F., Guilloteau, S., & Dutrey, A. 2006, A&A, 458, 841
- Phillips (1999) Phillips, J. P. 1999, A&AS, 134, 241
- Pinto et al. (2011) Pinto, R. F., Brun, A. S., Jouve, L., & Grappin, R. 2011, ApJ, 737, 72
- Pirogov et al. (2003) Pirogov, L., Zinchenko, I., Caselli, P., Johansson, L. E. B., & Myers, P. C. 2003, A&A, 405, 639
- Reipurth et al. (1999) Reipurth, B., Yu, K. C., Rodríguez, L. F., Heathcote, S., & Bally, J. 1999, A&A, 352, L83
- Schieven (2012) Schieven, G., Observing with ALMA: A Primer for Early Science, ALMA Doc 1.1, ver. 1.1
- Shu et al. (2000) Shu, F. H., Najita, J. R., Shang, H., & Li, Z.-Y. 2000, Protostars and Planets IV, 789
- Shu et al. (2006) Shu, F. H., Galli, D., Lizano, S., & Cai, M. 2006, ApJ, 647, 382
- Simon et al. (2000) Simon, M., Dutrey, A., & Guilloteau, S. 2000, ApJ, 545, 1034
- Smith et al. (2005) Smith, N., Bally, J., Licht, D., & Walawender, J. 2005, AJ, 129, 382
- Soker (2005) Soker, N. 2005, A&A, 435, 125
- Spitzer (1978) Spitzer, L. 1978, Physical processes in the interstellar medium, New York Wiley-Interscience
- Stamatellos & Whitworth (2009) Stamatellos, D., & Whitworth, A. P. 2009, MNRAS, 392, 413
- Takakuwa et al. (2012) Takakuwa, S., Saito, M., Lim, J., et al. 2012, ApJ, 754, 52
- Tassis & Mouschovias (2005) Tassis, K., & Mouschovias, T. C. 2005, ApJ, 618, 783
- Terebey et al. (1984) Terebey, S., Shu, F. H., & Cassen, P. 1984, ApJ, 286, 529
- Testi et al. (2002) Testi, L., Bacciotti, F., Sargent, A. I., Ray, T. P., & Eislöffel, J. 2002, A&A, 394, L31
- Tobin et al. (2010a) Tobin, J. J., Hartmann, L., Looney, L. W., & Chiang, H.-F. 2010a, ApJ, 712, 1010
- Tobin et al. (2010b) Tobin, J. J., Hartmann, L., & Loinard, L. 2010b, ApJ, 722, L12
- Tobin et al. (2011) Tobin, J. J., Hartmann, L., Chiang, H.-F., et al. 2011, ApJ, 740, 45
- Tobin et al. (2012a) Tobin, J. J., Hartmann, L., Bergin, E., et al. 2012a, ApJ, 748, 16
- Tobin et al. (2012b) Tobin, J. J., Hartmann, L., Chiang, H.-F., et al. 2012b, Nature, 492, 83
- Ulrich (1976) Ulrich, R. K. 1976, ApJ, 210, 377
- Walmsley et al. (2004) Walmsley, C. M., Flower, D. R., & Pineau des Forêts, G. 2004, A&A, 418, 1035
- Williams & Cieza (2011) Williams, J. P., & Cieza, L. A. 2011, ARA&A, 49, 67
- Wiseman et al. (2001) Wiseman, J., Wootten, A., Zinnecker, H., & McCaughrean, M. 2001, ApJ, 550, L87
- Woitas et al. (2005) Woitas, J., Bacciotti, F., Ray, T. P., et al. 2005, A&A, 432, 149
- Yen et al. (2011) Yen, H.-W., Takakuwa, S., & Ohashi, N. 2011, ApJ, 742, 57
- Zanni & Ferreira (2013) Zanni, C., & Ferreira, J. 2013, A&A, 550, A99