The ordinary life of the -ray emitting narrow-line Seyfert 1 galaxy PKS 1502036
Abstract
We report on multifrequency observations of the -ray emitting narrow-line Seyfert 1 galaxy PKS 1502036 performed from radio to -rays during 2008 August–2012 November by Fermi-Large Area Telescope (LAT), Swift (X-Ray Telescope and Ultraviolet/Optical Telescope), Owens Valley Radio Observatory, Very Long Baseline Array (VLBA), and Very Large Array. No significant variability has been observed in -rays, with 0.1–100 GeV flux that ranged between (3–7)10-8 ph cm-2 s-1 using 3-month time bins. The photon index of the LAT spectrum ( = 2.60 0.06) and the apparent isotropic -ray luminosity (L = 7.81045 erg s-1) over 51 months are typical of a flat spectrum radio quasar. The radio spectral variability and the one-sided structure, in addition to the observed -ray luminosity, suggest a relativistic jet with a high Doppler factor. In contrast to SBS 0846513, the VLBA at 15 GHz did not observe superluminal motion for PKS 1502036. Despite having the optical characteristics typical of a narrow-line Seyfert 1 galaxy, radio and -ray properties of PKS 1502036 are found to be similar to those of a blazar at the low end of the black hole mass distribution for blazars. This is in agreement with what has been found in the case of the other -ray emitting narrow-line Seyfert 1 SBS 0846513.
keywords:
galaxies: active – galaxies: nuclei – galaxies: Seyfert – galaxies: individual: PKS 1502036 – gamma-rays: general1 Introduction
A small fraction of narrow-line Seyfert 1 (NLSy1) galaxies are known to be radio loud (Komossa et al., 2006). In these cases, the flat radio spectra and flux density variability suggest that several of them could host relativistic jets (e.g. Zhou et al., 2003; Doi et al., 2006). The detection by the Large Area Telescope (LAT) on-board the Fermi satellite of variable -ray emission from some radio-loud NLSy1 galaxies revealed the presence of a possible third class of -ray emitting active galactic nuclei (AGN; Abdo et al., 2009; D’Ammando et al., 2012a) in addition to blazars and radio galaxies, both hosted in giant elliptical galaxies (Blandford Rees, 1978). NLSy1s are usually hosted in spiral galaxies (e.g. Deo et al., 2006) and the presence of a relativistic jet in these sources seems to be in contrast to the paradigm that the formation of relativistic jets could happen in elliptical galaxies only (Böttcher & Dermer, 2002; Marscher, 2010). This discovery poses intriguing questions on the nature of these objects, the formation and development of relativistic jets, the mechanisms of high-energy emission, the AGN Unification model and the evolution of radio-loud AGNs.
PKS 1502036 has been classified as an NLSy1 on basis of its optical characteristics: full width at half-maximum (FWHM) (H) = 1082 113 km s-1, [OIII]/H 1.1, and a strong Fe II bump. For this source, a radio loudness = 1549 was estimated (Yuan et al., 2008), being defined as the ratio between the 1.4 GHz and 4400 Å rest-frame flux densities111It is worth noting that this definition of radio-loudness is related to that presented in Kellermann et al. (1989), R6cm = fν(6 cm)/fν(4400 Å), by means of R=1.9 R.. This is one of the highest radio-loudness parameters among the NLSy1s. With its convex radio spectrum peaking above 5 GHz, PKS 1502036 was selected by Dallacasa et al. (2000) as part of the ‘bright’ high frequency peakers (HFPs) sample of young radio source candidates. However, its polarization properties, the flux density and spectral variability are typical of blazars and it was removed from the young radio source sample (Orienti et al., 2007, 2008). Snapshot very long baseline interferometry (VLBI) observations in the 1990’s showed a compact source (on scales of 20 mas) with inverted spectrum (Dallacasa et al., 1998).
In the -ray energy band PKS 1502036 has been included in both the first and second Fermi-LAT source catalogues (1FGL and 2FGL; Abdo et al., 2010; Nolan et al., 2012). In the past, the source was not detected by the energetic gamma-ray experiment telescope (EGRET) at E 100 MeV (see Hartman et al., 1999).
In this paper, we discuss the characteristics of PKS 1502036, one of the 5 NLSy1 detected by Fermi-LAT with high confidence, determined by means of new and archival radio-to--ray data. The paper is organized as follows. In Section 2, we report the LAT data analysis and results, while in Section 3, we present the result of the Swift observations performed during 2009–2012. Optical data collected by the Catalina Real-Time Transient Survey (CRTS) are reported in Section 4. Radio data collected by the Karl G. Jansky Very Large Array (VLA), the Very Long Baseline Array (VLBA) interferometers, and the 40 m Owens Valley Radio Observatory (OVRO) single-dish telescope are presented and discussed in Section 5. In Section 6, we discuss the properties of the source and draw our conclusions. Throughout the paper, a cold dark matter(-CDM) cosmology with = 71 km s-1 Mpc-1, and is adopted. The corresponding luminosity distance at (i.e. the source redshift) is d Mpc, and 1 arcsec corresponds to a projected distance of 5.415 kpc. In the paper, the quoted uncertainties are given at the 1 level, unless otherwise stated, and the photon indices are parametrized as with = +1 ( is the spectral index).
2 Fermi-LAT Data: Selection and Analysis
The Fermi-LAT is a pair-conversion telescope operating from 20 MeV to 300 GeV. It has a large peak effective area (8000 cm2 for 1 GeV photons), an energy resolution of typically 10%, and a field of view of about 2.4 sr with an angular resolution (68% containment angle) better than 1∘ for energies above 1 GeV. Further details about the Fermi-LAT are given in Atwood et al. (2009).

The LAT data reported in this paper were collected from 2008 August 4 (MJD
54682) to 2012 November 4 (MJD 56235). During this time, the LAT instrument
operated almost entirely in survey mode. The analysis was performed with the ScienceTools software package version v9r27p1. The LAT data
were extracted within a region of interest centred at the location of PKS 1502036. Only events belonging to the ‘Source’ class were used. In addition, a cut on the
zenith angle () was also applied to reduce contamination from
the Earth limb -rays, which are produced by cosmic rays interacting with the upper atmosphere.
The spectral analysis was performed with the instrument response functions P7SOURCE_V6 using an unbinned maximum-likelihood method implemented
in the Science tool gtlike. A Galactic diffuse emission model and isotropic component, which is the sum of
an extragalactic and residual cosmic ray background were used to model the background222http://fermi.gsfc.nasa.gov/ssc/data/access/lat/Background
Models.html. The normalizations of both components in the background model were allowed to vary freely during the spectral fitting.
We evaluated the significance of the -ray signal from the sources by means of the maximum-likelihood test statistic TS = 2log(likelihood) between models with and without a point source at the position of PKS 1502036 (Mattox et al., 1996). The source model used in gtlike includes all the point sources from the 2FGL catalogue that fall within from PKS 1502036. The spectra of these sources were parametrized by power-law (PL) functions, , except for 2FGL J1504.31029 and 2FGL J1512.80906, for which we used a log-parabola (LP), (Landau et al., 1986; Massaro et al., 2004), as in the 2FGL catalogue. A first maximum-likelihood analysis was performed to remove from the model the sources having TS 10 and/or the predicted number of counts based on the fitted model . A second maximum-likelihood analysis was performed on the updated source model. The fitting procedure has been performed with the sources within 10∘ from PKS 1502036 included with the normalization factors and the photon indices left as free parameters. For the sources located between 10∘ and 15∘ from our target, we kept the normalization and the photon index fixed to the values of the 2FGL catalogue.
The -ray point source localization by means of the gtfindsrc tool applied to the -rays extracted during the 51 months of observation (MJD 54682–56235) results in RA = 226.27∘, Dec. = 3.45∘ (J2000), with a 95% error circle radius of 0.07∘, at an angular separation of 0.01∘ from the radio position of PKS 1502036. This implies a strict spatial association with the radio coordinates of the NLSy1 PKS 1502036. Integrating over the entire period considered, the fit yielded a TS = 305 in the 0.1–100 GeV energy range, with an integrated average flux of (4.0 0.4)10-8 photons cm-2 s-1 and a photon index of = 2.60 0.06. The corresponding apparent isotropic -ray luminosity is 7.81045 erg s-1. In order to test for curvature in the -ray spectrum of PKS 1502036, an alternative spectral model to the PL, a LP was used for the fit. We obtain a spectral slope = 2.45 0.11 at the reference energy = 300 MeV, a curvature parameter around the peak = 0.10 0.06, with a TS = 307 and an integrated average flux of (3.7 0.4)10-8 photons cm-2 s-1. We used a likelihood ratio test to check the PL model (null hypothesis) against the LP model (alternative hypothesis). These values may be compared by defining the curvature test statistic TScurve=TSLP–TSPL=2 corresponding to 1.4, meaning that we have no statistical evidence of a curved spectral shape.
Fig. 1 shows the -ray light curve for the period 2008 August 4–2012 November 4 using a PL model and 3-month time bins. For each time bin, the spectral parameters of PKS 1502036 and all sources within 10∘ from it were frozen to the value resulting from the likelihood analysis over the entire period. If TS 10, the value of the fluxes were replaced by the 2 upper limits, calculated using the profile method (see e.g. Nolan et al., 2012). The systematic uncertainty in the flux is energy dependent: it amounts to at 100 MeV, decreasing to at 560 MeV, and increasing again to above 10 GeV (Ackermann et al., 2012b). Despite integrating over three months, the source was not always detected. We test for flux variability calculating the variability index as defined in Nolan et al. (2012). We obtain a TSvar = 25.2 for 16 degrees of freedom, below the value of 32 defined to identify variable sources at a 99% confidence level. Thus, no significant variability was detected in -rays, as reported also in the 2FGL catalogue over the first 24 months of Fermi operations for this source (Nolan et al., 2012). On weekly time-scales, the source was detected with TS 10 only a few times, with a peak flux of (18 6)10-8 photons cm-2 s-1 in the 0.1–100 GeV energy range during 2012 July 7–13.
Leaving the photon index free to vary in the fits for three 3-month periods of highest activity (flux 610-8 photons cm-2 s-1 in the 0.1–100 GeV energy range) and fixed to 548 MeV, as in the 2FGL catalogue, the fits result in photon index values = 2.57 0.16, = 2.44 0.15 and = 2.54 0.18, in chronological order. No conclusive evidence for spectral evolution has been detected. By means of the gtsrcprob tool, we estimated that the highest energy photon emitted by PKS 1502036 (with probability 80% of being associated with the source) was observed on 2009 October 30 at a distance of 0.05∘ from PKS 1502036 with an energy of 19.6 GeV.
| Date (UT) | MJD | Net exposure time | Net count rate | Photon index | Flux 0.3–10 keVa |
|---|---|---|---|---|---|
| (sec) | (10-3 cps) | () | (10-13 erg cm-2 s-1) | ||
| 2009-July-25 | 55037 | 4681 | 7.5 1.3 | ||
| 2012-Apr-25 | 56042 | 4807 | 7.7 1.3 | ||
| 2012-May-25 | 56072 | 4635 | 8.0 1.3 | ||
| 2012-June-25 | 56103 | 5142 | 8.4 1.3 | ||
| 2012-Aug-07/08 | 56146/7 | 4925 | 10.8 1.5 |
aObserved flux
3 Swift Data: Analysis and Results
The Swift satellite (Gehrels et al., 2004) performed six observations of PKS 1502036 between 2009 July and 2012 August. The observations were performed with all three onboard instruments: the X-ray Telescope (XRT; Burrows et al., 2005, 0.2–10.0 keV), the Ultraviolet/Optical Telescope (UVOT; Roming et al., 2005, 170–600 nm) and the Burst Alert Telescope (BAT; Barthelmy et al., 2005, 15–150 keV).
The hard X-ray flux of this source turned out to be below the sensitivity of the BAT instrument for such short exposures and therefore the data from this instrument will not be used. Moreover, the source was not present in the Swift BAT 70-month hard X-ray catalogue (Baumgartner et al., 2013).
The XRT data were processed with standard procedures (xrtpipeline v0.12.6), filtering, and screening criteria by using the HEAsoft package (v6.12). The data were collected in photon counting mode in all the observations. The source count rate was low ( 0.5 counts s-1); thus pile-up correction was not required. The data collected during 2012 August 7 and 8 were summed in order to have enough statistics to obtain a good spectral fit. Source events were extracted from a circular region with a radius of 20 pixels (1 pixel 2.36), while background events were extracted from a circular region with radius of 50 pixels far away from the source region. Ancillary response files were generated with xrtmkarf, and account for different extraction regions, vignetting and point spread function corrections. We used the spectral redistribution matrices v013 in the Calibration data base maintained by HEASARC. Considering the low number of photons collected ( 200 counts) the spectra were rebinned with a minimum of 1 count per bin and we used Cash statistics (Cash, 1979). We have fitted the spectrum with an absorbed power-law using the photoelectric absorption model tbabs (Wilms et al., 2000), with a neutral hydrogen column density fixed to its Galactic value (3.931020 cm-2; Kalberla et al., 2005). The results are reported in Table 1. In the past, the source has not been detected in X-rays during the ROSAT all-sky survey, with an upper limit of 2.110-12 erg cm-2 s-1 in the 0.1–2.4 keV energy range (Yuan et al., 2008). PKS 1502036 seems to have been observed by Swift/XRT in a relatively bright state on 2009 July 25 in the 0.3–10 keV energy range. In addition a possible moderate change of the photon index was observed during 2009–2012 together with an increase of the count rate leading up to 2012 August 7–8, but no conclusive evidence can be drawn on consideration of the large uncertainties.
During the Swift pointings, the UVOT instrument observed PKS 1502036 in all its optical (, and ) and UV (, and ) photometric bands (Poole et al., 2008; Breeveld et al., 2010). We analysed the data using the uvotsource task included in the HEAsoft package. Source counts were extracted from a circular region of 5 arcsec radius centred on the source, while background counts were derived from a circular region of 10 arcsec radius in the source neighbourhood. We combined the images collected on 2012 August 7 and 8 in order to achieve better statistics. The observed magnitudes are reported in Table 2. Upper limits are calculated using the UVOT photometric system when the analysis provided a significance of detection 3.
Magnitudes in optical filters are comparable within the uncertainties between the different Swift observations, and compatible with the values observed in the past (=18.62–18.82; =19.11–19.27; =18.58–18.68; Wills Lynds, 1978). Recently, optical intraday variability with amplitude as large as 10% has been reported for PKS 1502036 by Paliya et al. (2013). No evident infrared intraday variability has been found with Wide-field Infrared Survey Explorer (WISE) data, but a variation of 0.1–0.2 mag corrected for measurement errors during two epochs separated by about 180 d has been reported in Jiang et al. (2012).
| Date (UT) | MJD | ||||||
|---|---|---|---|---|---|---|---|
| 2009-July-25 | 55037 | 18.78 | 19.310.28 | 18.680.23 | 18.570.18 | 18.250.16 | 18.490.12 |
| 2012-Apr-25 | 56042 | 18.650.33 | 19.80 | 18.980.27 | 18.980.22 | 18.850.10 | 18.580.11 |
| 2012-May-25 | 56072 | 18.720.31 | 19.280.22 | 18.740.06 | 18.320.14 | 18.600.17 | 18.350.10 |
| 2012-June-25 | 56103 | 18.76 | 19.120.27 | 18.670.27 | 18.510.08 | 18.250.15 | 18.620.13 |
| 2012-Aug-07/08 | 56146/7 | 19.390.30 | 20.120.28 | 18.900.14 | 18.790.10 | 18.610.08 | 18.650.06 |
4 Catalina Real-Time Transient Survey
The source has been monitored by the CRTS (http://crts.caltech.edu; Drake et al., 2009; Djorgovski et al., 2011), using the 0.68 m Schmidt telescope at Catalina Station, AZ, and an unfiltered CCD. The typical cadence is to obtain four exposures separated by 10 min in a given night; this may be repeated up to four times per lunation, over a period of 6–7 months each year, while the field is observable. Photometry is obtained using the standard Source-Extractor package (Bertin Arnouts, 1996), and roughly calibrated to the band in terms of the magnitude zero-point. During the CRTS monitoring, the source showed a variability amplitude of 1 mag, changing between 18.7 and 17.7 mag.
5 Radio Data: Analysis and Results
5.1 VLA and VLBA data
Multi-epoch and multifrequency observations of PKS 1502036 were carried out with both the VLA and VLBA between 1999 and 2007 as part of the monitoring campaign of the ‘bright’ HFP sample (Dallacasa et al., 2000). Results of the observations performed between 1999 and 2003 were presented in Dallacasa et al. (2000); Tinti et al. (2005); Orienti et al. (2006, 2007). To study the proper motion, we complemented our VLBA observations with the 15 GHz VLBA data from the MOJAVE programme333The MOJAVE data archive is maintained at http://www.physics.purdue.edu/MOJAVE. (Lister et al., 2009) and additional 15 GHz archival VLBA observations. Logs of VLA and VLBA observations are reported in Table 3.
Simultaneous VLA observations were performed in band (with the two intermediate frequencies, IFs, centred at 1.415 and 1.665 GHz), band (with the two IFs centred at 4.565 and 4.935 GHz), band (with the two IFs centred at 8.085 and 8.465 GHz), band (14.940 GHz), and band (22.460 GHz). At each frequency the target source was observed for about 1 min, cycling through frequencies. During each run, the primary calibrator 3C 286 was observed for about 3 min at each frequency. The data reduction was carried out following the standard procedures for the VLA implemented in the National Radio Astronomy Observatory (NRAO) Astronomical Image Processing System (AIPS) package. The flux density at each frequency was measured on the final image produced after a few phase-only self-calibration iterations. In the band, it was generally necessary to image a few confusing sources falling within the primary beam. The target source is unresolved at any frequency even with the VLA A-configuration. During one epoch, strong radio frequency interference at 1.665 GHz was present, and a measurement of the flux density was not possible. Uncertainties on the determination of the absolute flux density scale are dominated by amplitude errors, which are about 3% in , , and bands, about 5% in band, and about 10% in band.
Simultaneous VLBA observations were performed in 2002 January at 15.3
and 22 GHz, and in 2006 July at 1.7 GHz, 2.3 GHz
( band), 5.0 GHz, 8.4 GHz and 15.3
GHz. The correlation was performed at the VLBA hardware correlator
in Socorro and the data reduction was carried out with the NRAO
AIPS package. After the application of system temperatures and
antenna gains, the amplitudes were checked using data on 4C 39.25 (J0927+3902), which was used also as bandpass calibrator. The error in the absolute flux density scale is generally within
3%-10%, being highest in value at the highest frequency.
The final images were obtained after a number of self-calibration
iterations. Amplitude self-calibration was applied only once at the
end of the process, using particular care; the solution interval (30
min) was chosen to be longer than the scan-length to remove residual
systematic errors and fine tune the flux density scale, but not to
force the individual data points to follow the model.
Additional archival data have been considered to improve the time
sampling. A priori amplitude calibration was derived using measurements of
the system temperature and the antenna gains. Uncertainties of the amplitude
calibrations were assumed to be 5%. For MOJAVE data, we imported the fully calibrated uv data sets
(Lister et al., 2009).
| Date (UT) | MJD | Observation code | Array | Bands | Code | Reference |
|---|---|---|---|---|---|---|
| 1999-Sep-25 | 51446 | AD428 | VLA-A | ,,,, | a | 1 |
| 2002-July-03 | 52458 | AT275 | VLA-B | ,,,, | b | 2 |
| 2003-Sep-13 | 52895 | AD488 | VLA-AnB | ,,,, | c | 3 |
| 2007-Apr-14 | 54204 | AO210 | VLA-D | ,,, | d | 4 |
| 2001-Oct-06 | 52188 | BF068 | VLBAaafootnotemark: | e | 4 | |
| 2002-Jan-11 | 52285 | BD077 | VLBA | , | f | 5 |
| 2002-Sep-26 | 52481 | RDV35 | VLBA | g | 4 | |
| 2005-Dec-07 | 53711 | BF075 | VLBAaafootnotemark: | h | 4 | |
| 2006-June-26 | 53912 | BF075 | VLBAaafootnotemark: | i | 4 | |
| 2006-July-22 | 53938 | BO025 | VLBA | ,,,, | l | 4 |
| 2010-Oct-15 | 55484 | BL149 | VLBAbbfootnotemark: | m | 4 | |
| 2010-Oct-25 | 55494 | BL149 | VLBAbbfootnotemark: | n | 4 | |
| 2011-May-06 | 55687 | BL149 | VLBAbbfootnotemark: | o | 4 | |
| 2012-Jan-02 | 55928 | BL178 | VLBAbbfootnotemark: | p | 4 | |
| 2012-Sep-27 | 56197 | BL178 | VLBAbbfootnotemark: | q | 4 |
aarchival VLBA data; bdata from the MOJAVE programme
| Code | |||||||||||||
|---|---|---|---|---|---|---|---|---|---|---|---|---|---|
| (mJy) | (mJy) | (mJy) | (mJy) | (mJy) | (mJy) | (mJy) | (mJy) | (GHz) | (mJy) | ||||
| a | 455 | 547 | 921 | 929 | 901 | 895 | 830 | 738 | 7.70.8 | 940 | 1.7 | 0.2 | 107 |
| b | 413 | 465 | 740 | 741 | 721 | 710 | 665 | 567 | 7.20.7 | 745 | 0.5 | 0.2 | 3 |
| c | 382 | 428 | 608 | 620 | 620 | 610 | 515 | 468 | 6.50.6 | 622 | 0.4 | 0.3 | 122 |
| d | 332 | – | 679 | 692 | 720 | 720 | – | 611 | 8.80.9 | 737 | 0.5 | 0.2 | 38 |
| Code | |||||||||
| (mJy) | (mJy) | (mJy) | (mJy) | (mJy) | (GHz) | (mJy) | |||
| f | – | – | – | 630 | 566 | – | – | – | – |
| g | – | – | – | 800 | – | – | – | – | – |
| l | 365 | 480 | 670 | 701 | 547 | 6.60.7 | 704 | 0.6 | 0.4 |
5.2 OVRO
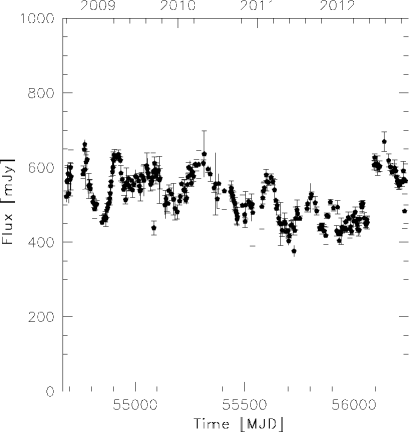
As part of an ongoing blazar monitoring programme, the OVRO 40 m radio telescope has observed PKS 1502036 at 15 GHz regularly since the end of 2007 (Richards et al., 2011). This monitoring programme includes over 1500 known and likely -ray loud blazars above declination . The sources in this programme are observed in total intensity twice per week with a 4 mJy (minimum) and 3% (typical) uncertainty in their flux densities. Observations are performed with a dual-beam (each 2.5 arcmin FWHM) Dicke-switched system using cold sky in the off-source beam as the reference. Additionally, the source is switched between beams to reduce atmospheric variations. The absolute flux density scale is calibrated using observations of 3C 286, adopting the flux density (3.44 Jy) from Baars et al. (1977). This results in about a 5% absolute scale uncertainty, which is not reflected in the plotted errors. As shown in Fig. 2, PKS 1502036 was highly variable at 15 GHz during the OVRO monitoring, with a flux density spanning 376 mJy (at MJD 55726) to 669 mJy (at MJD 56139).
5.3 Radio data: results
5.3.1 The radio spectrum
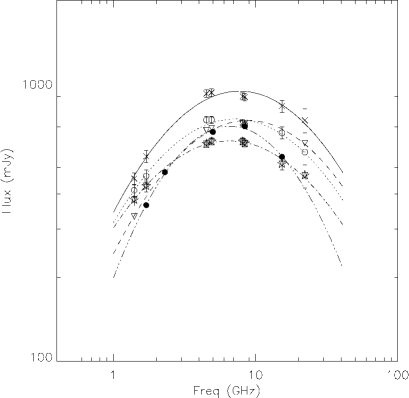
Simultaneous multifrequency VLA observations carried out at various epochs showed substantial spectral and flux density variability. To determine the change in the spectral peak, we follow the approach by Orienti et al. (2010) and we fit the simultaneous radio spectrum at each epoch with a purely analytical function:
| (1) |
where S is the flux density, the frequency, and a, b and c are numeric parameters without any direct physical meaning. The best fits to the spectra are shown in Fig. 3, and the derived peak frequencies at the various epochs are reported in Tables 4 and 5. Statistical errors derived from the fit are not representative of the real uncertainty on the estimate of the peak frequency. For this reason, we prefer to assume a conservative uncertainty on the peak frequency of 10%. In addition, we computed the spectral index in the optically thick () and thin part () of the spectrum. Both the spectral shape and the spectral peak change randomly among the various observing epochs, similar to what is found in blazars (e.g. Torniainen et al., 2007) as well as in radio-loud NLSy1s (e.g. Yuan et al., 2008; D’Ammando et al., 2012a).
Following the approach of Orienti et al. (2007), we estimated the spectral variability by means of the variability index:
| (2) |
where is the flux density at the th frequency measured at one epoch, is the mean value of the flux density computed by averaging the flux density at the th frequency measured at all the available epochs, is the root mean square (rms) on and is the number of sampled frequencies. The variability index computed at the different epochs ranges between 3 and 122, indicating that this source is highly variable (Table 4). We prefer to compute the variability index for each epoch instead of considering all the epochs together in order to potentially detect small outbursts.
5.3.2 Radio structure
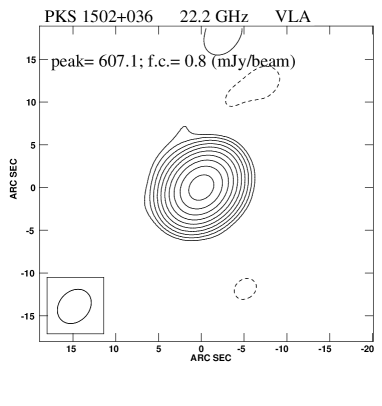
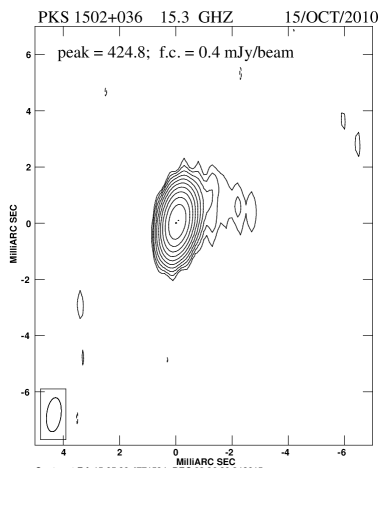
PKS 1502036 is unresolved on arcsecond scales typical of the VLA (Fig. 4). However, when imaged with the parsec scale resolution provided by VLBA observations, its radio structure is marginally resolved and a second component seems to emerge from the core. In the VLBA images at 15 GHz, the radio structure is clearly extended, suggesting a core-jet-like morphology (Figs 5, 6 and 7). The radio emission is dominated by the core component, which is unresolved in the 15 GHz image with an angular size 0.4 mas. The jet-like feature accounts for about 4% of the total flux density in the observation presented here, and it extends to about 3 mas (Fig. 7). Since the VLBA flux density is in good agreement with the nearly contemporaneous measurements by the OVRO 40 m single dish, we can exclude significant emission from extended, low surface brightness features.
To investigate possible changes in the radio structure, we modelled the performed visibility-based model fitting using the DIFMAP software. The radio structure consists of a bright compact core plus weak extended emissions westward and is well fitted with a point source (core) plus two (circular) Gaussian components (‘C1’ and ‘C2’); we could not identify the third component for the data of 2006 March 20 due to limited dynamic range. The results of image analyses are listed in Table 6. The error in total flux density was determined from the uncertainties of the amplitude calibration and image rms noise. The error in the measured separation between the core and the jet components was determined from the root-sum-square of the uncertainties of the position measurements for C1 (or C2) and the core. The uncertainty in the relative positions is estimated from
| (3) |
where is the major axis of the deconvolved component, is its peak
flux density and rms is the 1 noise level measured on the
image plane (Polatidis & Conway, 2003). In case the errors estimated by
equation (3) are unreliably small,
we assume a more conservative value for that is 10
of the FWHM of the beam.
In contrast to what is found in the radio-loud NLSy1 SBS 0846+513, where an
apparent superluminal motion has been detected (, D’Ammando et al., 2012b), no significant proper motion is detected for
the jet components of PKS 1502036 (Fig. 8).
| Date (UT) | MJD | Restoring beam | Image noise | VLBA total flux | C1 position | C2 position |
|---|---|---|---|---|---|---|
| (mas mas) | (mJy/beam) | (mJy) | (mas) | (mas) | ||
| 2001-Oct-06 | 52188 | 2.2 | ||||
| 2002-Jan-11 | 52285 | 5.2 | ||||
| 2006-Mar-20 | 53814 | 2.0 | – | |||
| 2006-June-27 | 53913 | 1.1 | ||||
| 2006-July-21 | 53937 | 0.8 | ||||
| 2010-Oct-15 | 55484 | 0.2 | ||||
| 2010-Oct-25 | 55494 | 0.2 | ||||
| 2011-May-26 | 55707 | 0.3 | ||||
| 2012-Jan-02 | 55928 | 0.2 | ||||
| 2012-Sep-27 | 56197 | 0.3 |


6 Discussion and conclusions
The detection of four radio-loud NLSy1s in -rays during the first year of Fermi-LAT operation (Abdo et al., 2009) has stimulated the interest in this class of AGN. Currently the search for new -ray emitting NLSy1s has led to only one new source detected at high significance (D’Ammando et al., 2012a). So far most of the attention has been directed towards the two NLSy1s that showed -ray flaring activity, PMN J09480022 and SBS 0846513 (Foschini et al., 2011; D’Ammando et al., 2012a).
PKS 1502036 showed no significant -ray variability during 2008 August 4–2012 November 4, with the 0.1–100 GeV flux ranging between (3–7)10-8 photons cm-2 s-1 using 3-month time bins. The average LAT spectrum accumulated over 51 months is well described by a power-law with a photon index of = 2.60 0.06, which is similar to the mean value observed for flat spectrum radio quasars (FSRQs) during the first two years of Fermi-LAT operation ( = 2.42 0.17; Ackermann et al., 2012a).
In the same way, the average apparent isotropic -ray luminosity of PKS 1502036 is 7.81045 erg s-1 in the 0.1–100 GeV range, a typical value for a FSRQ (e.g. Grandi & Torresi, 2012), and it is in agreement with what was found for SBS 0846513 and PMN J09480022 (see discussion in D’Ammando et al., 2012a). This suggests the presence of a relativistic jet with Doppler factors () as large as in blazars. Modelling of the spectral energy distribution (SED) of the radio-loud NLSy1s detected by Fermi-LAT indicates Doppler factors larger than 10 (Abdo et al., 2009; D’Ammando et al., 2012a), and in particular for PKS 1502036. However, the study of the proper motion could not detect any significant motion for this source, while the radio spectral variability and the one-sided structure further require the presence of boosting effects in a relativistic jet.
The 15 GHz light curve (Sec. 5.2) is highly variable. In particular, two outburst episodes are clearly present: the first peaks at MJD 54923, and the second peaks at MJD 56139. These outbursts seem to take place when a flux enhancement is also observed in -rays. Unfortunately, the statistics in -rays are not adequate to allow a study of the variability on time-scales short enough to be related to the radio monitoring, while in the optical and UV bands the time sampling was too poor. For this reason, we estimate the variability time-scale on the basis of the radio data, similarly to Valtoja et al. (1999). For , we assume the time interval of the flux density variation to be between the minimum and maximum flux density of a single outburst . This assumption implies that the minimum flux density corresponds to a stationary underlying component and the variation is due to a transient component. Taking into consideration the time dilation due to the cosmological redshift we find that the intrinsic time lag is , while the intrinsic flux density variation at the observed frequency is . The brightness temperature at a given frequency is
| (4) |
where is the Boltzmann constant, is the solid angle of the emitting region, and is the speed of light. Using the causality principle, we can determine the angular size of the region responsible for the outburst
| (5) |
Knowing that the solid angle is
| (6) |
we derive the rest-frame brightness temperature from
| (7) |
During the two outburst episodes we have flux density variability 185 and 216 mJy, respectively, while 75 and 85 d, respectively. If in equation (7) we consider these values, and we assume , i.e. the average value obtained by fitting the optically thin spectrum (Tables 4 and 5), we obtain T 2.51013 K, which exceeds the value derived for the Compton catastrophe. Assuming that such a high value is due to Doppler boosting, we can estimate the variability Doppler factor , by means of
| (8) |
where is the intrinsic brightness temperature. Assuming a typical value = 51010 K, as derived by e.g. Readhead (1994); Hovatta et al. (2009); Lähteenmäki & Valtaoja (1999), we obtain 6.6.
Another way to derive a lower limit to the Doppler factor is by means of the jet/counter-jet brightnesses ratio. Assuming that both the jet and counter-jet have the same intrinsic power, the different brightness observed can be related to Doppler boosting by means of
| (9) |
where and are the jet and counter-jet brightness, respectively, is the viewing angle, is the bulk velocity in terms of the speed of light. We prefer to compare the surface brightness instead of the flux density because the jet has a smooth structure without clear knots. We measured the jet brightness as 20 mJy/beam in the 15 GHz image. In the case of the counter-jet, which is not visible, we assumed an upper limit for the surface brightness that corresponds to 0.15 mJy/beam, i.e. 1 noise level measured on the image. From the brightness ratio estimated from equation (9) we obtain cos 0.8, implying that the minimum velocity is (corresponding to a minimum bulk Lorentz factor = 2.8) and a maximum viewing angle . From the minimum values derived, we can estimate a lower limit to the Doppler factor by means of
| (10) |
and we obtain 1.7. We remark that the Doppler factors estimated by means of variability and jet/counter-jet brightness ratio are lower limits. The Doppler factor obtained in Abdo et al. (2009) by modelling the SED is much larger, = 18. The discrepancy may be a consequence of the different emitting regions. The radio variability is likely produced in the core component instead of along the jet. Furthermore, the -ray emission can be produced in a very compact region, as suggested by the very short variability time-scale observed in some FSRQs (e.g. Tavecchio et al., 2010). Such a small region is usually self-absorbed at the typical radio frequencies (cm and mm wavelengths). Indeed, the fit used to model the SED in Abdo et al. (2009) does not take into consideration the radio data. On the other hand, the region responsible for the radio emission is related to regions of the jets that are further away from the central AGN, where the opacity is less severe.

A black hole mass of 4106 M⊙ was estimated by Yuan et al. (2008) for PKS 1502036 on the basis of the H broad line. On the other hand, Abdo et al. (2009) derived a black hole mass of 2107 M⊙ by means of the SED modelling of the source. As in the case of SBS 0846513, radio and -ray properties of PKS 1502036 seem to show the characteristics of a (possibly young) blazar at the low end of the black hole mass distribution. A core-jet structure has been resolved at 15 GHz in VLBA images of PKS 1502036. The main difference with respect to SBS 0846513 seems to be a fainter jet-like structure and no observed apparent superluminal motion.
In Fig. 9, we compare the -ray light curve collected by Fermi-LAT during 2008 August–2012 November to the X-ray (0.3–10 keV), UV ( filter), optical ( and filters) and radio (15 GHz) light curves collected by Swift, CRTS and OVRO. No significant flaring activity was detected in -rays. The lack of significant -ray variability is not surprising taking into account that only 40% of the AGN in the second LAT AGN Catalogue (2LAC) clean sample has shown a clear variability (Ackermann et al., 2012a). The continuous monitoring of the -ray sky provided by Fermi-LAT will allow us to catch, if it happens, a flaring activity from PKS 1502036. Interestingly a slight increase from radio to UV was observed at the end of 2012 June during a period of relatively high -ray flux. Similarly, the maximum flux density in band was observed when the -ray emission was increasing. However, the sparse coverage in optical-to-X-rays does not allow us to obtain conclusive evidence. A regular monitoring of this source, as well as the other -ray emitting NLSy1s, from radio to -rays will be fundamental for continuing to investigate the nature and the emission mechanisms of these objects. This will be crucial for revealing differences and similarities between -ray NLSy1s and blazars.
Acknowledgements
The Fermi-LAT Collaboration acknowledges generous ongoing support from a number of agencies and institutes that have supported both the development and the operation of the LAT as well as scientific data analysis. These include the National Aeronautics and Space Administration and the Department of Energy in the United States, the Commissariat à l’Energie Atomique and the Centre National de la Recherche Scientifique / Institut National de Physique Nucléaire et de Physique des Particules in France, the Agenzia Spaziale Italiana and the Istituto Nazionale di Fisica Nucleare in Italy, the Ministry of Education, Culture, Sports, Science and Technology (MEXT), High Energy Accelerator Research Organization (KEK) and Japan Aerospace Exploration Agency (JAXA) in Japan, and the K. A. Wallenberg Foundation, the Swedish Research Council and the Swedish National Space Board in Sweden. Additional support for science analysis during the operations phase is gratefully acknowledged from the Istituto Nazionale di Astrofisica in Italy and the Centre National d’Études Spatiales in France. Part of this work was done with the contribution of the Italian Ministry of Foreign Affairs and Research for the collaboration project between Italy and Japan. We thank the Swift team for making these observations possible, the duty scientists, and science planners. The OVRO 40 m monitoring programme is supported in part by NASA grants NNX08AW31G and NNX11A043G, and NSF grants AST-0808050 and AST-1109911. The CSS survey is funded by the National Aeronautics and Space Administration under Grant No. NNG05GF22G issued through the Science Mission Directorate Near-Earth Objects Observations Programme. The CRTS survey is supported by the U.S. National Science Foundation under grants AST-0909182. The VLA and VLBA are operated by the National Radio Astronomy Observatory. The NRAO is a facility of the National Science Foundation operated under cooperative agreement by Associated Universities, Inc. F. D., M. O., M. G. acknowledge financial contribution from grant PRIN-INAF-2011. We thank the referee, Dr. Dirk Grupe, and F. Schinzel for helpful comments and suggestions.
References
- Abdo et al. (2009) Abdo, A. A., et al. 2009, ApJ, 707, L142
- Abdo et al. (2010) Abdo, A. A., et al. 2010, ApJS, 188, 405
- Ackermann et al. (2012a) Ackermann, M., et al. 2012a, ApJ, 743, 171
- Ackermann et al. (2012b) Ackermann, M., et al. 2012b, ApJ, 747, 104
- Atwood et al. (2009) Atwood, W. B., et al. 2009, ApJ, 697, 1071
- Baars et al. (1977) Baars, W. M., Genzel, R., Pauliny-Toth, I. I. K., Witzel, A. 1977, AA, 61, 99
- Barthelmy et al. (2005) Barthelmy, S. D., et al. 2005, Space Sci. Rev., 120, 143
- Baumgartner et al. (2013) Baumgartner, W. H., Tueller, J., Markwardt, C. B., Skinner, G. K., Barthelmy, S., Mushotzky, R. F., Evans, P., Gehrels, N. 2013, ApJS preprint (arXiv:1212.3336)
- Bertin Arnouts (1996) Bertin, E., Arnouts, S. 1996, A&AS, 117, 393
- Blandford Rees (1978) Blandford, R. D., & Rees, M. J. 1978, in Pittsburgh Conference on BL Lac Objects, ed A. M. Wolfe, University Pittsburgh Press, 328
- Böttcher & Dermer (2002) Böttcher, M., & Dermer, C. D. 2002, ApJ, 564, 86
- Breeveld et al. (2010) Breeveld, A. A., et al. 2010, MNRAS, 406, 1687
- Burrows et al. (2005) Burrows, D. N., et al. 2005, Space Sci. Rev., 120, 165
- Cash (1979) Cash, W. 1979, ApJ, 228, 939
- D’Ammando et al. (2012a) D’Ammando, F., et al . 2012a, MNRAS, 426, 317
- D’Ammando et al. (2012b) D’Ammando, F., Orienti, M., Finke, J. 2012b, 5th International Meeting on High Energy Gamma-Ray Astronomy, ed. F. A. Aharonian, W. Hofmann, F. M. Rieger, AIP Conf. Ser. Vol. 1505, Am. Inst. Phys., New York, p. 570
- Dallacasa et al. (2000) Dallacasa, D., Stanghellini, C., Centonza, M., Fanti, R. 2000, A&A, 363, 887
- Dallacasa et al. (1998) Dallacasa, D., Bondi, M., Alef, W., Mantovani, F. 1998, AAS, 129, 219
- Deo et al. (2006) Deo, R. P., Crenshow, D. M., Kraemer, S. B. 2006, AJ, 132, 321
- Djorgovski et al. (2011) Djorgovski, S.G., et al. 2011, in The First Year of MAXI: Monitoring Variable X-ray Sources, eds. T. Mihara & N. Kawai. JAXA Special Publication, Tokyo (arXiv:1102.5004)
- Doi et al. (2006) Doi, A., Nagai, H., Asada, K., Kameno, S., Wajima, K., & Inoue, M. 2006, PASJ, 58, 829
- Drake et al. (2009) Drake, A. J., et al. 2009, ApJ, 696, 870
- Foschini et al. (2011) Foschini, L., et al. 2011, MNRAS, 413, 1671
- Gehrels et al. (2004) Gehrels, N., et al. 2004, ApJ, 611, 1005
- Grandi & Torresi (2012) Grandi, P., & Torresi, E. 2012, Proceedings 2001 Fermi & Jansky: Our Evolving Understanding of AGN, St. Michaels, MD, Nov. 10-12 - eConf C1111101 (arXiv:1205.1686)
- Hartman et al. (1999) Hartman, R. C., et al. 1999, ApJS 123, 79
- Hovatta et al. (2009) Hovatta, T., Valtaoja, E., Tornikoski, M., Lähteenmäki, A. 2009, A&A, 494, 527
- Kalberla et al. (2005) Kalberla, P. M. W., Burton, W. B., Hartmann, D., Arnal, E. M., Bajaja, E., Morras, R., Pöppel, W. G. L 2005, AA, 440, 775
- Kellermann et al. (1989) Kellermann, K. I., Sramek, R., Schmidt, M., Shaffer, D. B., Green, R. 1989, AJ, 98, 1195
- Komossa et al. (2006) Komossa, S., Voges, W. Xu, D., Mathur, S., Adorf, H.-M., Lemson, G., Duschl, W. J., Grupe, D. 2006, AJ, 132, 531
- Jiang et al. (2012) Jiang, N., et al. 2012, ApJ, 759, L31
- Lähteenmäki & Valtaoja (1999) Lähteenmäki, A., & Valtaoja, E. 1999, ApJ, 521, 493
- Landau et al. (1986) Landau, R., et al. 1986, ApJ, 308, 78
- Lister et al. (2009) Lister, M. L., et al. 2009, AJ, 137, 3718
- Marscher (2010) Marscher, A. 2010, in Lecture Notes in Physics 794, ed. T. Belloni (Berlin:Springer), 173
- Massaro et al. (2004) Massaro, E., Perri, M., Giommi, P., Nesci, R. 2004, AA, 413, 489
- Mattox et al. (1996) Mattox, J. R., et al. 1996, ApJ, 461, 396
- Nolan et al. (2012) Nolan, P., et al. 2012, ApJS, 199, 31
- Orienti et al. (2006) Orienti, M., Dallacasa, D., Tinti, S., Stanghellini, C. 2006, A&A, 450, 959
- Orienti et al. (2007) Orienti, M., Dallacasa, D., Stanghellini, C. 2007, A&A, 475, 813
- Orienti et al. (2008) Orienti, M., Dallacasa, D. 2008, A&A, 479, 409
- Orienti et al. (2010) Orienti, M., Dallacasa, D., Stanghellini, C. 2010, MNRAS, 408, 1075
- Paliya et al. (2013) Paliya, V. S., Stalin, C. S., Kumar, B., Kumar, B., Bhatt, V. K., Pandey, S. B., Yadav, R. K. S. 2013, MNRAS, 428, 2450
- Polatidis & Conway (2003) Polatidis, A. G., & Conway, J. E. 2003, Publ. Astron. Soc. Aust., 20, 69
- Poole et al. (2008) Poole, T. S., et al. 2008, MNRAS, 383, 627
- Readhead (1994) Readhead, A. C. S. 1994, ApJ, 426, 51
- Richards et al. (2011) Richards, J. L., et al. 2011, ApJS, 194, 29
- Roming et al. (2005) Roming, P. W. A., et al. 2005, Space Sci. Rev., 120, 95
- Tavecchio et al. (2010) Tavecchio, F., Ghisellini, G., Bonnoli, G., Ghirlanda, G. 2010, MNRAS, 405, 94
- Tinti et al. (2005) Tinti, S., Dallacasa, D., De Zotti, G., Stanghellini, C., Celotti, A. 2005, A&A, 432, 31
- Torniainen et al. (2007) Torniainen, I., Tornikoski, M., Lähteenmäki, A., Aller, M. F., Aller, H. D., Mingaliev, M. G. 2007, A&A, 469.451
- Valtoja et al. (1999) Valtaoja, E., Lähteenmäki, A., Teräsranta, H., Lainela, M. 1999, ApJS, 120, 95
- Wills Lynds (1978) Wills, D., Lynds, R. 1978, ApJS, 36, 317
- Wilms et al. (2000) Wilms, J., Allen, A., McCray, R. 2000, ApJ, 542, 914
- Yuan et al. (2008) Yuan, W., et al. 2008, ApJ, 685, 801
- Zhou et al. (2003) Zhou, H.-Y., Wang, T.-G., Dong, X.-B., Zhou, Y.-Y., Li, C. 2003, ApJ, 584, 147