Magnetically Confined Interstellar Hot Plasma
in the Nuclear Bulge of our Galaxy
Abstract
The origin of the Galactic center diffuse X-ray emission (GCDX) is still under intense investigation. In particular, the interpretation of the hot ( keV) component of the GCDX, characterised by the strong Fe 6.7 keV line emission, has been contentious. If the hot component originates from a truly diffuse interstellar plasma, not a collection of unresolved point sources, such plasma cannot be gravitationally bound, and its regeneration would require a huge amount of energy. Here we show that the spatial distribution of the GCDX does not correlate with the number density distribution of an old stellar population traced by near-infrared light, strongly suggesting a significant contribution of the diffuse interstellar plasma. Contributions of the old stellar population to the GCDX are implied to be % and % in the Nuclear stellar disk and Nuclear star cluster, respectively. For the Nuclear stellar disk, a scale height of is obtained for the first time from the stellar number density profiles. We also show the results of the extended near-infrared polarimetric observations in the central region of our Galaxy, and confirm that the GCDX region is permeated by a large scale, toroidal magnetic field as previously claimed. Together with observed magnetic field strengths close to energy equipartition, the hot plasma could be magnetically confined, reducing the amount of energy required to sustain it.
1 INTRODUCTION
In the late 80s, a Japanese X-ray satellite GINGA revealed the presence of a diffuse and rather uniform 6.7 keV emission from highly ionized, Helium-like ions of iron at the direction of the Galactic center (GC; Koyama et al., 1989). The line emission and associated continuum component, called the Galactic center diffuse X-ray emission (GCDX), resembles the Galactic ridge diffuse X-ray emission (GRXE; e.g., Cooke et al., 1969; Koyama et al., 1986) extending more than along the Galactic plane. For the GRXE, more than of the diffuse emission has been claimed to be resolved into point sources (Revnivtsev et al., 2009), suggesting faint X-ray point sources in origin.
On the other hand, the origin of the GCDX, in particular its very hot component with a temperature of keV, is more puzzling. So far only 10 - 40 % of the GCDX has been claimed to be resolved into faint point sources even with the Chandra satellite (Muno et al., 2004; Revnivtsev et al., 2007). The plasma temperature, represented by flux ratios of iron emission lines, is systematically higher for the GCDX than for the GRXE (Yamauchi et al., 2009), indicating their different origins.
Two main ideas have been suggested to account for it : a truly diffuse plasma that bathes the emitting region (e.g., Koyama et al., 1989); and a superposition of a large number of unresolved point sources as the GRXE is (e.g., Wang et al., 2002). In the later case, candidates are old stellar binary systems such as cataclysmic variables (CVs) and coronally active binaries (ABs; Sazonov et al., 2006). So if the hot component originates in the discrete sources, its spatial distribution should be very similar to that derived by old stars observable in infrared wavelengths. For this purpose, a stellar mass distribution model constructed from infrared surface brightness maps (Launhardt et al., 2002) has been used (Muno et al., 2009; Uchiyama et al., 2011; Heard & Warwick, 2013). However, such maps could be subject to the influence of bright stars. The angular resolution in these maps was only 07, so that the stellar density profile in the direction orthogonal to the Galactic plane had to be inferred from proxies (dust emission, radio emission from molecular clouds). In addition, uncertainties of the mass model seem to be as high as a factor of two (Launhardt et al., 2002).
We have constructed a stellar number density map of the GC region from new near-infrared (NIR) observations with more than 1,000 times higher spatial resolution (Yasui et al. in preparation), which enables us to directly compare the stellar distribution with GCDX. In this letter, we summarize the NIR imaging observations and their results, and provide additional evidence for the hypothesis that the GCDX arises from a truly diffuse hot plasma. We also show results of our recent polarimetric observations. The results provide strong evidence for a large-scale toroidal magnetic field configuration which could confine the hot plasma magnetically.
2 Observations and Data Analysis
The central region of our Galaxy, and (corresponding to 840 pc 280 pc at 8 kpc from the Sun), was observed from 2002 to 2004 using the NIR camera SIRIUS (Nagashima et al., 1999; Nagayama et al., 2003) on the 1.4 m telescope IRSF. SIRIUS provides (1.25 m), (1.63 m), and (2.14 m) images simultaneously. The averages of the 10 limiting magnitudes are and . We do not use the -band data due to severe interstellar extinction. Further details are given in Nishiyama et al. (2006).
The stellar number density map is constructed as follows: At first, an and color magnitude diagram (CMD) is constructed for each sub-field of , and foreground sources with their blue color are removed. The typical color of stars in the GC is , and color cuts to remove the foreground sources are 0.3 - 1.1. We carry out an extinction correction for each star using the observed color, the mean intrinsic color of (considering the limiting magnitudes and the Galactic model by Wainscoat et al., 1992), and an interstellar extinction law, (Nishiyama et al., 2006). Here we obtain an extinction-corrected -band magnitude, , and the amount of interstellar extinction for each star.
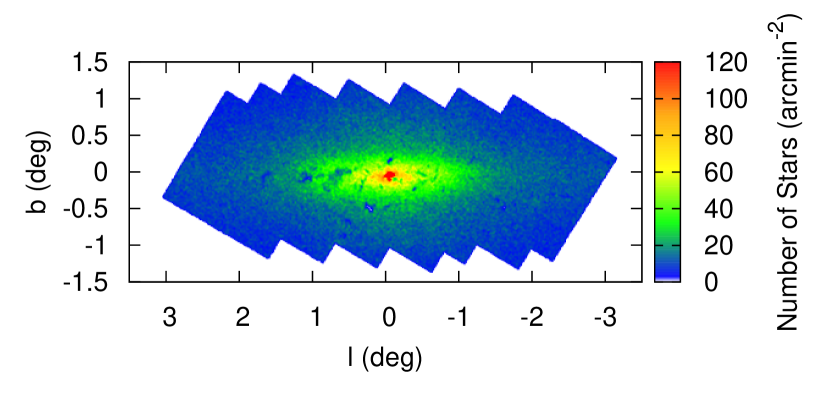
We then construct a stellar number density map using stars with (Fig. 1). For the central field, source confusion is so severe that a different magnitude limit of , and a conversion factor derived by the ratio of the number of stars with and are used. By comparing -band luminosity functions constructed with the extinction-corrected stars and a Galactic model (Wainscoat et al., 1992), these magnitude limits are determined so that completeness at the limits is almost 100 %. We make completeness corrections with recovery rates determined by adding artificial sources in the images, and confirm that the recovery rates are very high, % in average (Hatano et al., 2013). For more detail, see Yasui et al. (in preparation). Also, at the very center (), we have used images obtained with an 8-m telescope VLT and ISAAC (Nishiyama & Schödel, 2013).
To determine a large-scale interstellar MF configuration, we have carried out NIR polarimetric observations using IRSF and a NIR polarimetric imager SIRPOL (Kandori et al., 2006), from 2006 to 2010. We have extended the survey region from (and ; Nishiyama et al., 2010) to , which covers almost the whole region dominated by GCDX. Comparing the polarization between stars distributed further and closer side in the GC, we obtain polarization originating from magnetically aligned dust grains in the GC (for more detail, see Nishiyama et al., 2009, 2010). The polarized angle traces the GC’s MF direction projected onto the sky.
3 Results and Discussion
3.1 Stellar Number Density Profiles
A disk-like structure is seen in the stellar number density map (Fig. 1). This is known as the Nuclear bulge (NB), which consists of the Nuclear stellar disk (NSD) and the Nuclear stellar cluster (NSC; Launhardt et al., 2002). Here our observations clearly reveal morphology of the NB on a large scale, with much higher spatial resolution than previous studies. The NB has a symmetric, disk-like structure with a scale height of (Fig. 2), although several low-density regions are seen. Those are very dense molecular clouds in front of/inside the NB. A true stellar number density is difficult to be derived in these regions, and thus they are not used in the following analysis (see Yasui et al. in preparation).
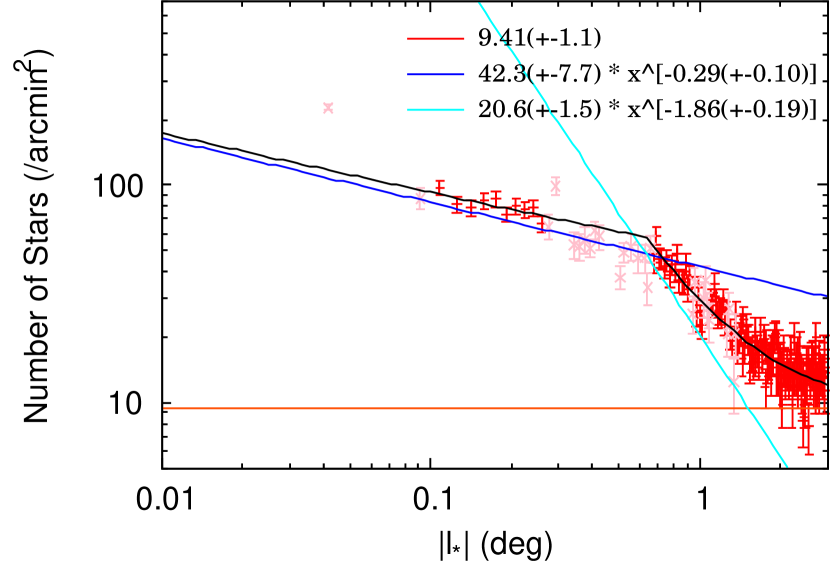
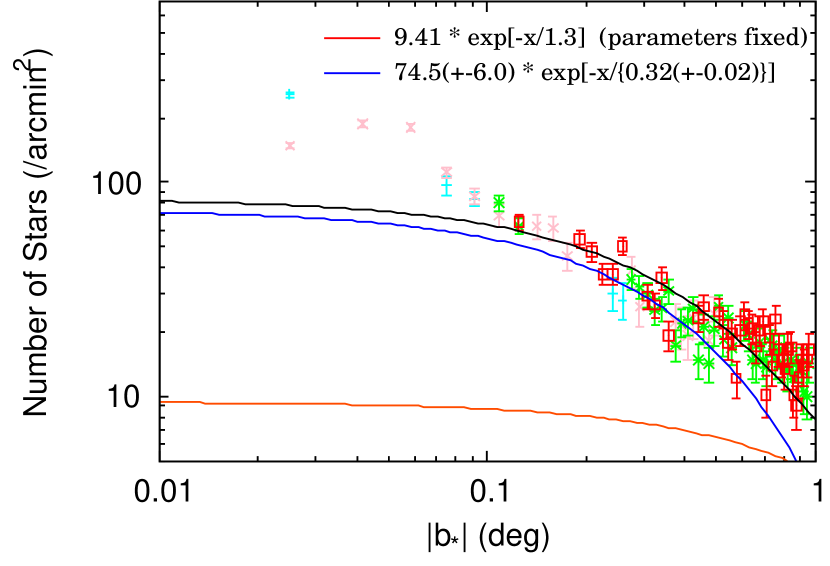
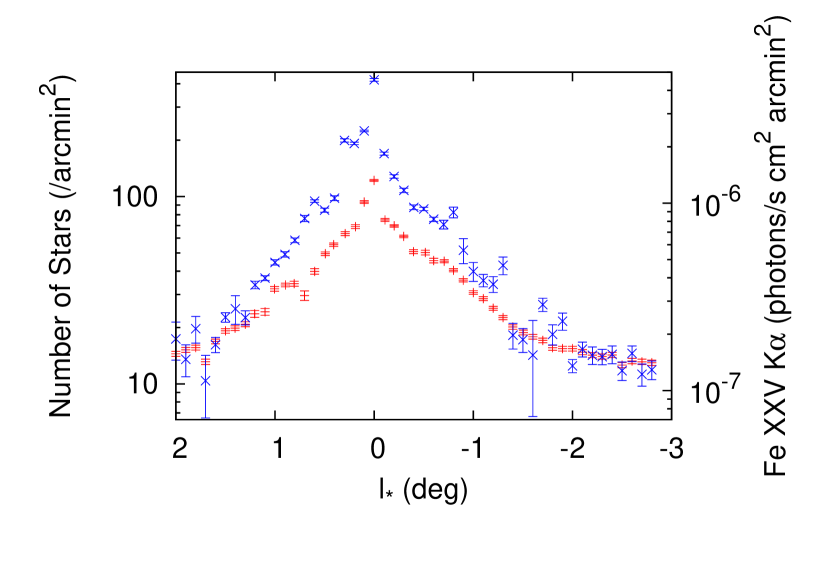
The longitudinal and latitudinal profiles of the 6.7 keV line emission measured by Suzaku (Koyama et al., 2007; Uchiyama et al., 2011) clearly show an excess at the NB region over the stellar number density profiles (Fig. 3). The two profiles are overplotted and scaled to have the same values at , i.e., in a region outside of the NB [ and denote the angular distance from Sgr A* along the Galactic longitude and latitude, respectively, and ]. Fitting the longitudinal profile in the range with a power-law of , where is angular offset from Sgr A*, gives for the stellar number density. This is different both from for the 6.7 keV profile in the same range, and from for the integrated emission of Fe 6.7 and 6.9 keV lines (Heard & Warwick, 2013).
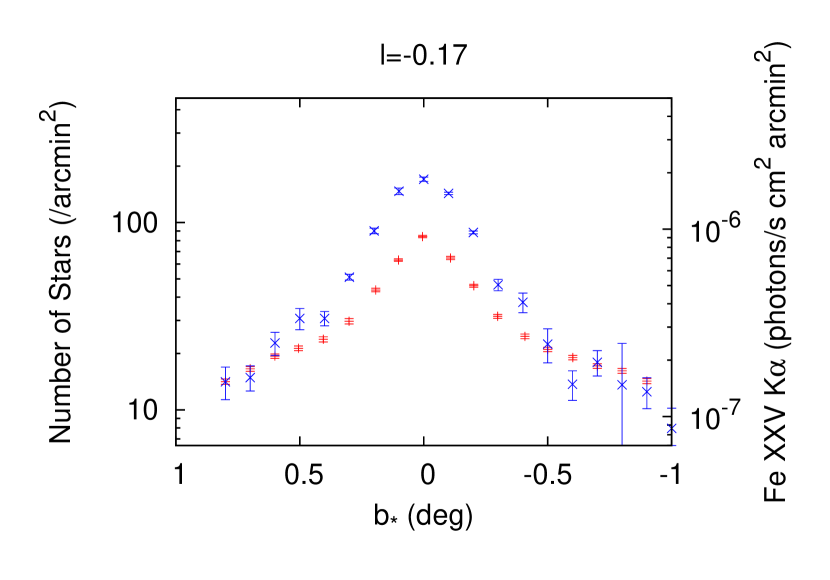
The majority of faint X-ray ( erg s-1) sources which have not been resolved but contribute to the GCDX are most likely to be old binary systems (Sazonov et al., 2006). Using the synthetic CMD computation (Aparicio & Gallart, 2004), and a constant star formation history during 13 Gyr for the NSD (Figer et al., 2004), we have confirmed that about 75 % of the stars with are older than 1 Gyr. So the NIR map and profiles shown here trace the distribution of the old stars, and they are clearly different from those of the 6.7 keV emission.
A contribution from faint discrete sources to the GCDX has been claimed (Wang et al., 2002; Muno et al., 2004; Revnivtsev et al., 2007). To investigate the contribution of the point sources, especially of the old stellar population detectable in our observations, we construct longitudinal and latitudinal profiles for the ratio of the 6.7 keV emission to the stellar number density (Fig. 4). When the profiles are scaled to be unity at , the ratios are and in the NSD and NSC, respectively.


The NB and NSC have a different formation history from the Galactic bulge (GB), and have formed stars over their entire lifetime, indicating more bright stars in the NB and NSC. Here we use the synthetic CMD computation (Aparicio & Gallart, 2004) to estimate the fraction of the total number of stars formed in the computation, , to the number of stars with , . This ratio, , represents the ratio of the theoretically expected total number of stars to the number of stars detected in our observations. The star formation histories used here are: a burst star formation from 10 to 13 Gyr ago for the GB (i.e., outside the NB; Zoccali et al., 2003); a constant star formation rate for 13 Gyr for the NSD (Figer et al., 2004); and the history derived by Pfuhl et al. (2011) for the NSC. When we scale the ratio to be unity for the GB, we obtain . This result means that the densities of the old stellar population in the NSD and NSC are over-predicted by the bright stars. Taking into account this ratio, we have found that the contributions of the old stellar population to the GCDX are and for the NSD and NSC, respectively, in the assumption that the X-ray luminosity function is universal, and that the contribution of point sources to the GRXE is 100 %. The contribution at the NSC is in good agreement with derived by Koyama et al. (2009).
A larger X-ray emissivity per unit stellar mass for the GCDX than the GRXE has been claimed to explain the different distributions of stars and 6.7 keV emission (Revnivtsev et al., 2007; Heard & Warwick, 2013). To change the emissivity, at least one of initial mass function (IMF), binary fraction (BF), or star formation history (SFH) is required to be different in the NB from the GB. In the preceding paragraphs, we have shown that different SFHs cannot explain the different spatial distributions of the stellar number density and 6.7 keV emission. Considering an universal IMF (Bastian et al., 2010) and a possible top-heavy IMF in the GC (Figer et al., 1999), the number of old, low-mass stars (i.e., CVs and ABs) per unit stellar mass never increases, it only decreases. Also, a higher stellar density tends to destroy binaries rather than to form them via a capture process, which seems to play a small role in binary formation (Tohline, 2002). These imply a smaller X-ray emissivity per unit stellar mass by CVs and ABs, rather than a higher emissivity.
3.2 Magnetic Field Configuration
The most puzzling aspects of the GCDX is its high temperature. Since the keV plasma is too hot to be gravitationally bound, it requires a huge energy source without the confinement of the plasma. One idea to address this energetics problem is the confinement of the plasma by magnetic fields (MFs; Makishima, 1994; Tanuma et al., 1999). If a large-scale toroidal MF is developed and sustained, and the MF is strong enough for nearly energy equipartition with the plasma, the GCDX could be almost confined within the NB. However, the large scale MF configuration was thought to be predominantly vertical, suggesting that the magnetic confinement does not work well, although observations of the MF in the NB have been limited to the region in dense molecular clouds (Novak et al., 2000, 2003; Chuss et al., 2003) and very thin, non-thermal radio filaments (Tsuboi et al., 1986; Yusef-Zadeh et al., 1997; Lang et al., 1999). Recent observations have revealed that NIR and wide-field polarimetry offers a promising tool to trace a large-scale MF, and a troidal configuration near the Galactic plane has been claimed in the GC (Nishiyama et al., 2010).
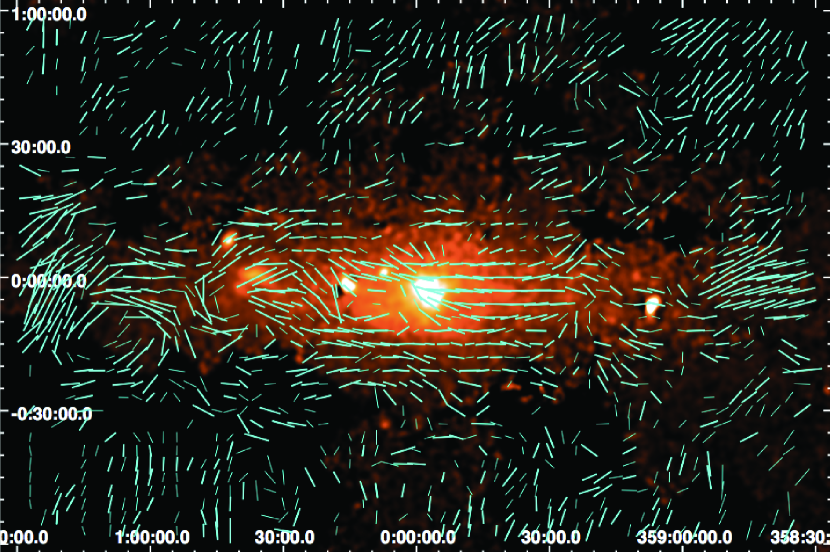
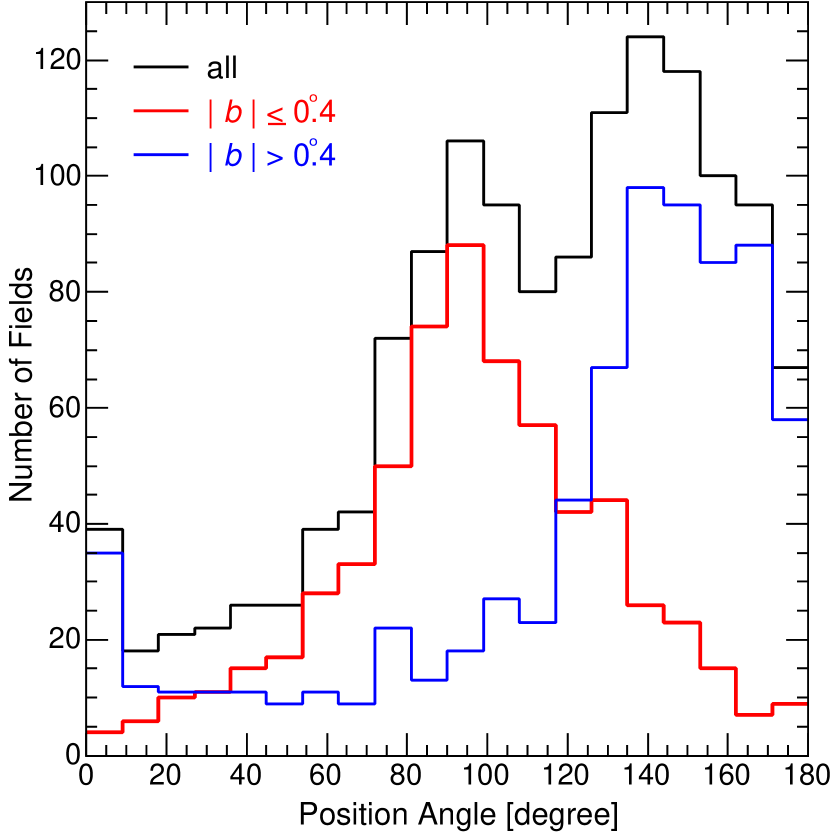
The obtained polarization map (Fig. 5) suggests a large-scale toroidal MF configuration in the NB. The histogram (Fig. 6) of the MF directions at has a clear peak at which is the direction parallel to the Galactic plane. On the other hand, at high Galactic latitude (), the fields are nearly perpendicular to the plane, i.e., poloidal configuration. This suggests a transition of the large-scale configuration, and such a transition can be naturally explained by the time evolution of MFs. An initially predominantly poloidal, larger-scale MF is sheared out in the azimuthal direction by the differential rotation of an accreting gas disk (Uchida et al., 1985). The transition region, , is in good agreement with the scale height of the 6.7 keV emission, (Uchiyama et al., 2013).
The determination of the MF strength is still quite difficult in this region, but it seems to converge to the value of (e.g., Ferrière, 2011; Crocker et al., 2011). At this field strength, the magnetic energy density ( keV cm-3) reaches nearly equipartition with those of diffuse hot plasma (keV cm-3) and gas turbulence (see Fig. 4 in Crocker et al., 2010). This suggests that MFs provide significant pressure support against the diffusion of the hot plasma.
If the plasma were not supported, it would be rushing out of the Galactic plane vertically as a galactic wind. The escape velocity, typically several hundred km s-1, is smaller than the sound speed of the keV hot plasma of km s-1. Assuming the gas flows out from the X-ray emitting region at the sound speed, the escape timescale is yr (Belmont et al., 2005). This requires a huge energy input to sustain the hot plasma; e.g., an unreasonably high supernova rate of yr-1 (Uchiyama et al., 2013, but note that keV plasma is hotter than is observed in supernova remnants). If the plasma is magnetically confined, and there is no other cooling mechanism, the hot plasma only cools by radiation with a timescale of yr (Muno et al., 2004), several orders of magnitude longer than the escape timescale. This would reduce the required energy input by several orders of magnitude and thus relax the energetics problem.
There is no widely accepted mechanism to heat the plasma to keV. If past activities of the supermassive black hole (Koyama et al., 1996) heat ambient interstellar gas, created plasma could be confined magnetically. If a troidal MF is sustained by a differential rotation of a gaseous disk, magnetic reconnection is a possible heating mechanism (Tanuma et al., 1999). Star formation activities and resultant supernovae are also implied to be the origin (Crocker, 2012), while supernova-driven outflows advect materials out of the GC. However, outflows from the GC seems to be magnetized (Carretti et al., 2013), hence the existence of a large-scale troidal field and outflows might not be contradictory.
4 Summary
We have used imaging and polarimetric data sets of the GC region to investigate the origin of the GCDX. We have constructed a stellar number density map, and compared its longitudinal and latitudinal profiles with those of the 6.7 keV emission. We have estimated that the contributions of the old stellar population to the GCDX at the NSD and NSC are % and %, respectively. Our findings support the notion that the GCDX is not only caused by a population of unresolved point sources but must also stem from a hot interstellar plasma component. Polarimetric observations reveal a large scale toroidal magnetic field configuration which allows a magnetic confinement of the hot plasma.
References
- Aparicio & Gallart (2004) Aparicio, A., & Gallart, C. 2004, AJ, 128, 1465
- Bastian et al. (2010) Bastian, N., Covey, K. R., & Meyer, M. R. 2010, ARA&A, 48, 339
- Belmont et al. (2005) Belmont, R., Tagger, M., Muno, M., Morris, M., & Cowley, S. 2005, ApJ, 631, L53
- Carretti et al. (2013) Carretti, E., Crocker, R. M., Staveley-Smith, L., et al. 2013, Nature, 493, 66
- Chuss et al. (2003) Chuss, D. T., Davidson, J. A., Dotson, J. L., et al. 2003, ApJ, 599, 1116
- Cooke et al. (1969) Cooke, B. A., Griffiths, R. E., & Pounds, K. A. 1969, Nature, 224, 134
- Crocker (2012) Crocker, R. M. 2012, MNRAS, 423, 3512
- Crocker et al. (2011) Crocker, R. M., Jones, D. I., Aharonian, F., et al. 2011, MNRAS, 413, 763
- Crocker et al. (2010) Crocker, R. M., Jones, D. I., Melia, F., Ott, J., & Protheroe, R. J. 2010, Nature, 463, 65
- Ferrière (2011) Ferrière, K. 2011, in Astronomical Society of the Pacific Conference Series, Vol. 439, The Galactic Center: a Window to the Nuclear Environment of Disk Galaxies, ed. M. R. Morris, Q. D. Wang, & F. Yuan, 39
- Figer et al. (1999) Figer, D. F., Kim, S. S., Morris, M., et al. 1999, ApJ, 525, 750
- Figer et al. (2004) Figer, D. F., Rich, R. M., Kim, S. S., Morris, M., & Serabyn, E. 2004, ApJ, 601, 319
- Hatano et al. (2013) Hatano, H., Nishiyama, S., Kurita, M., et al. 2013, AJ, 145, 105
- Heard & Warwick (2013) Heard, V., & Warwick, R. S. 2013, MNRAS, 428, 3462
- Kandori et al. (2006) Kandori, R., Kusakabe, N., Tamura, M., et al. 2006, in Society of Photo-Optical Instrumentation Engineers (SPIE) Conference Series, Vol. 6269, Society of Photo-Optical Instrumentation Engineers (SPIE) Conference Series
- Koyama et al. (1989) Koyama, K., Awaki, H., Kunieda, H., Takano, S., & Tawara, Y. 1989, Nature, 339, 603
- Koyama et al. (1996) Koyama, K., Maeda, Y., Sonobe, T., et al. 1996, PASJ, 48, 249
- Koyama et al. (1986) Koyama, K., Makishima, K., Tanaka, Y., & Tsunemi, H. 1986, PASJ, 38, 121
- Koyama et al. (2009) Koyama, K., Takikawa, Y., Hyodo, Y., et al. 2009, PASJ, 61, 255
- Koyama et al. (2007) Koyama, K., Hyodo, Y., Inui, T., et al. 2007, PASJ, 59, 245
- Lang et al. (1999) Lang, C. C., Morris, M., & Echevarria, L. 1999, ApJ, 526, 727
- Launhardt et al. (2002) Launhardt, R., Zylka, R., & Mezger, P. G. 2002, A&A, 384, 112
- Makishima (1994) Makishima, K. 1994, in New Horizon of X-Ray Astronomy. First Results from ASCA, ed. F. Makino & T. Ohashi, 171
- Muno et al. (2004) Muno, M. P., Baganoff, F. K., Bautz, M. W., et al. 2004, ApJ, 613, 326
- Muno et al. (2009) Muno, M. P., Bauer, F. E., Baganoff, F. K., et al. 2009, ApJS, 181, 110
- Nagashima et al. (1999) Nagashima, C., Nagayama, T., Nakajima, Y., et al. 1999, in Star Formation 1999, ed. T. Nakamoto, 397–398
- Nagayama et al. (2003) Nagayama, T., Nagashima, C., Nakajima, Y., et al. 2003, in Society of Photo-Optical Instrumentation Engineers (SPIE) Conference Series, Vol. 4841, Society of Photo-Optical Instrumentation Engineers (SPIE) Conference Series, ed. M. Iye & A. F. M. Moorwood, 459–464
- Nishiyama & Schödel (2013) Nishiyama, S., & Schödel, R. 2013, A&A, 549, A57
- Nishiyama et al. (2006) Nishiyama, S., Nagata, T., Kusakabe, N., et al. 2006, ApJ, 638, 839
- Nishiyama et al. (2009) Nishiyama, S., Tamura, M., Hatano, H., et al. 2009, ApJ, 690, 1648
- Nishiyama et al. (2010) Nishiyama, S., Hatano, H., Tamura, M., et al. 2010, ApJ, 722, L23
- Nobukawa et al. (2012) Nobukawa, M., Ryu, S. G., Nakashima, S., et al. 2012, in American Institute of Physics Conference Series, Vol. 1427, American Institute of Physics Conference Series, ed. R. Petre, K. Mitsuda, & L. Angelini, 209–216
- Novak et al. (2000) Novak, G., Dotson, J. L., Dowell, C. D., et al. 2000, ApJ, 529, 241
- Novak et al. (2003) Novak, G., Chuss, D. T., Renbarger, T., et al. 2003, ApJ, 583, L83
- Pfuhl et al. (2011) Pfuhl, O., Fritz, T. K., Zilka, M., et al. 2011, ApJ, 741, 108
- Revnivtsev et al. (2009) Revnivtsev, M., Sazonov, S., Churazov, E., et al. 2009, Nature, 458, 1142
- Revnivtsev et al. (2007) Revnivtsev, M., Vikhlinin, A., & Sazonov, S. 2007, A&A, 473, 857
- Sazonov et al. (2006) Sazonov, S., Revnivtsev, M., Gilfanov, M., Churazov, E., & Sunyaev, R. 2006, A&A, 450, 117
- Tanuma et al. (1999) Tanuma, S., Yokoyama, T., Kudoh, T., et al. 1999, PASJ, 51, 161
- Tohline (2002) Tohline, J. E. 2002, ARA&A, 40, 349
- Tsuboi et al. (1986) Tsuboi, M., Inoue, M., Handa, T., et al. 1986, AJ, 92, 818
- Uchida et al. (1985) Uchida, Y., Sofue, Y., & Shibata, K. 1985, Nature, 317, 699
- Uchiyama et al. (2011) Uchiyama, H., Nobukawa, M., Tsuru, T., Koyama, K., & Matsumoto, H. 2011, PASJ, 63, 903
- Uchiyama et al. (2013) Uchiyama, H., Nobukawa, M., Tsuru, T. G., & Koyama, K. 2013, PASJ, 65, 19
- Wainscoat et al. (1992) Wainscoat, R. J., Cohen, M., Volk, K., Walker, H. J., & Schwartz, D. E. 1992, ApJS, 83, 111
- Wang et al. (2002) Wang, Q. D., Gotthelf, E. V., & Lang, C. C. 2002, Nature, 415, 148
- Yamauchi et al. (2009) Yamauchi, S., Ebisawa, K., Tanaka, Y., et al. 2009, PASJ, 61, 225
- Yusef-Zadeh et al. (1997) Yusef-Zadeh, F., Wardle, M., & Parastaran, P. 1997, ApJ, 475, L119
- Zoccali et al. (2003) Zoccali, M., Renzini, A., Ortolani, S., et al. 2003, A&A, 399, 931