The Influence of Motion and Stress on Optical Fibers
Abstract
We report on extensive testing carried out on the optical fibers for the VIRUS instrument. The primary result of this work explores how 10+ years of simulated wear on a VIRUS fiber bundle affects both transmission and focal ratio degradation (FRD) of the optical fibers. During the accelerated lifetime tests we continuously monitored the fibers for signs of FRD. We find that transient FRD events were common during the portions of the tests when motion was at telescope slew rates, but dropped to negligible levels during rates of motion typical for science observation. Tests of fiber transmission and FRD conducted both before and after the lifetime tests reveal that while transmission values do not change over the 10+ years of simulated wear, a clear increase in FRD is seen in all 18 fibers tested. This increase in FRD is likely due to microfractures that develop over time from repeated flexure of the fiber bundle, and stands in contrast to the transient FRD events that stem from localized stress and subsequent modal diffusion of light within the fibers. There was no measurable wavelength dependence on the increase in FRD over 350 nm to 600 nm. We also report on bend radius tests conducted on individual fibers and find the 266 m VIRUS fibers to be immune to bending-induced FRD at bend radii of R cm. Below this bend radius FRD increases slightly with decreasing radius. Lastly, we give details of a degradation seen in the fiber bundle currently deployed on the Mitchell Spectrograph (formally VIRUS-P) at McDonald Observatory. The degradation is shown to be caused by a localized shear in a select number of optical fibers that leads to an explosive form of FRD. In a few fibers, the overall transmission loss through the instrument can exceed 80%. These results are important for the VIRUS instrument, and for both current and proposed instruments that make use of optical fibers, particularly when the fibers are in continual motion during an observation, or experience repeated mechanical stress during their deployment.
Subject headings:
Optical Fibers, Focal Ratio Degradation, VIRUS, VIRUS-P, Mitchell Spectrograph, HETDEX1. INTRODUCTION
First proposed for use in astronomical instrumentation by Angel et al. (1977) optical fibers have revolutionized the field over the past 3 decades. This revolution has come about due to the flexibility optical fibers offer in re-routing the light from thetelescope focal plane to a more convenient location. The gain for this technological advance is clear as issues of instrument weight, size, stability, and temperature control are made largely obsolete. However, this advantage comes at a cost as fibers constitute an added element in the instrument’s optical path. Moreover, optical fibers are not entirely stable light guides, and while their characteristics have been studied in a comprehensive and systematic way by several groups (Ramsey, 1988; Schmoll et al., 2003; Crause et al., 2008; Poppett & Allington-Smith, 2010b), little work has been focused on their behavior during periods of motion and accumulated stress, with notable and valuable exceptions (Craig et al., 1988; Clayton, 1989; Avila, 1998; Bryant et al., 2010; Haynes et al., 2011; Bryant et al., 2011). As both current (Bershady et al., 2004; Kelz et al., 2004; Smith et al., 2004; Roth et al., 2005; Kelz et al., 2006b; Tuttle et al., 2008; Wilson et al., 2010) and proposed instrumentation (Navarro et al., 2010; Saunders et al., 2010) is making heavy use of optical fibers, with many instruments requiring repeated motion of the fiber optics, a clear understanding of their properties under these conditions is needed.
Transmission and focal ratio degradation (FRD) are the two properties of optical fibers that are generally of most interest for astronomical instrumentation. Unlike transmission values, which are now routinely supplied by the fiber vendor and, over a wide wavelength range, are generally repeatable in the lab, FRD measurements are typically left to the individual groups responsible for the instrument. This is in large part due to two related issues in quantifying FRD. One, due to the low levels of light involved in measuring FRD, and the significant potential for systematic errors introduced by the experimental set-up, accurate measurements of FRD are challenging. Two, there is not one single source of FRD, but rather several affects of fiber polishing, mounting, and on-telescope application that drive the various causes of a divergent output light cone that we generally refer to under the generic term of FRD.(Haynes et al., 2011) However, despite these challenges, several groups have quantified FRD via a number of different techniques. (Ramsey, 1988; Craig et al., 1988; Schmoll et al., 1998; Avila, 1998; Carrasco & Parry, 1994; Schmoll et al., 2003; Crause et al., 2008; Murphy et al., 2008; Haynes et al., 2008; Brunner et al., 2010; Poppett & Allington-Smith, 2010a)
FRD is typically defined as any increase in the output angle (i.e output f-ratio, hereafter f/out) of light when compared to the input angle. In an ideal fiber, the input f/ratio (f/in) will be preserved through the fiber, with no rays being scattered to larger output angles. In this case, f/in = f/out and the fiber does not suffer from FRD. For this work we broaden the definition of FRD to include the scattering of rays to lower angles as well as higher ones. Another way to express this modified definition of FRD is by saying that no FRD corresponds to no radial scattering of the light injected into a fiber. We employ this modified definition of FRD because VIRUS uses a Schmidt camera design (Hill et al., 2010). With such a camera design, light thrown into the central obscuration (see Figure 2) can land on the back of the CCD, leading to both loss of overall transmission and the possibility of scattered light. Note that while there are multiple sources of FRD seen in our various tests, we leave the majority of the discussion of the sources of FRD for §6, and focus on its quantifiable effects. Therefore we will use the generic term “FRD” throughout this work to mean any affect that leads to radial scattering of light within a fiber.
In this work we report on tests performed on both individual fibers and fiber bundles for use in the Visible Integral-field Replicable Unit Spectrograph (VIRUS) (Hill et al., 2010). VIRUS is a fiber-fed spectrograph currently under construction to carry out the Hobby Eberly Telescope Dark Energy eXperiment (HETDEX) (Hill et al., 2008). Composed of 75 integral field units (IFU), each m long and made of 448 optical fibers, (Kelz et al., 2006a) VIRUS will employ the use of fiber optics in astronomical instrumentation on a unprecedented scale. As the Hobby-Eberly Telescope (HET) tracker is in continual motion during a science observation, a clear understanding of both the behavior of fibers while in motion, and the effect several years of motion have on the fiber properties, is essential.
The outline of this paper is as follows. In §2 we provide an overview of our experimental set-ups and method of analysis of FRD. Bend radius tests conducted on 3 different fiber types are detailed in §3. Our main results are found in §4, where we describe the lifetime fiber tests carried out on a single VIRUS fiber bundle, and the changes we observed over the course of the tests. Then, in §5, we report on a specific case for the current science IFU (often referred to as a “fiber bundle” throughout this work) in use on the Mitchell Spectrograph (formally VIRUS-P) (MacQueen et al., 2008) where FRD in 18 fibers has increased over time, in some cases substantially. In certain fibers the increase in FRD is extreme, leading to a % drop in overall fiber transmission. In §6 we discuss the implications each of these results has for the VIRUS instrument and other projects which employ fibers, particularly if the fibers are mobile or experience repeated motions or localized stress during their deployment.
2. TESTING METHODS
 |


|
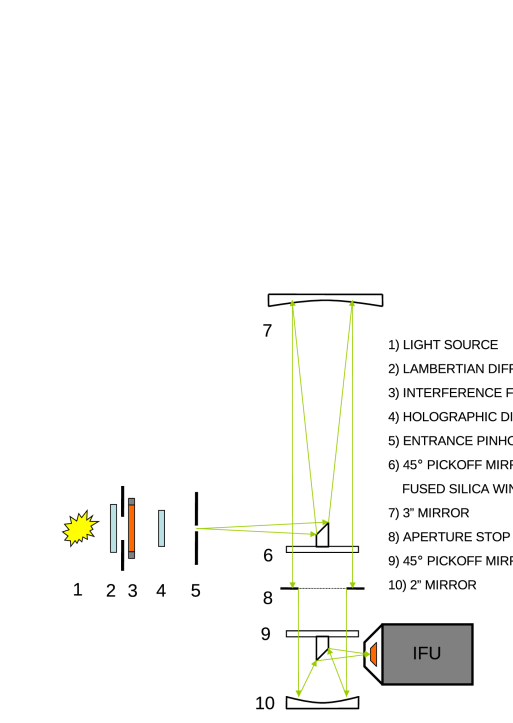
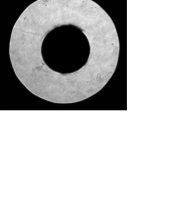
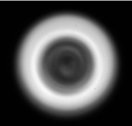
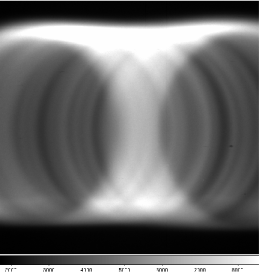
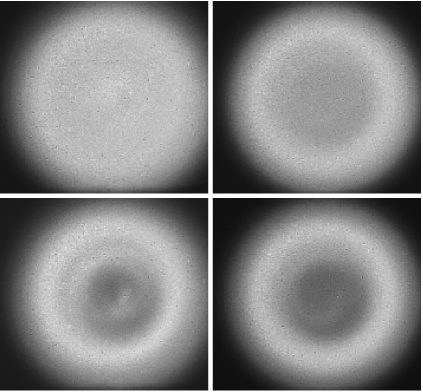
Our primary tests of transmission and FRD follow the method laid out in Murphy et al. (2008) (hereafter M08). We provide an overview of our test set-up and method for measuring transmission and FRD here, leaving the interested reader to reference M08 for further details. Since the work presented in M08 was conducted, the test bench has been automated. During this modification process we improved the diffusion of the input light source and removed the one lens (element #5 in Figure 3 of M08) as other improvements to the test bench made this focusing lens unnecessary. The layout of the rest of the test bench remains unchanged from M08, and is shown in Figure 1. Two 45-degree pickoff mirrors (elements #6 and #9) create a shadow at f/8 that mimics the secondary of a typical telescope. In Figure 2 we show far-field images and cross-sectional profiles of the spot that the test bench creates at its focus (left 2 images) and the output after the light has passed the length of a fiber (right 2 images). The central obscuration created by the pickoff mirrors has proven incredibly informative in our analysis of FRD as it allows us to explore FRD effects that radially scatter light into the central obscuration. An iris placed in the collimated light path (element #8) is used to set the f/in of the test bench. A cone-style FRD analysis and transmission measurement are conducted at 9 discrete wavelengths ( nm FWHM) between 350 nm and 600 nm. This method involves using the second mirror (element #10) to focus the collimated light from the test bench onto the end of an individual fiber. The fiber is placed at the focus of the second mirror and therefore sees a cone of light input at f/3.65. This light is very similar to the light seen by the fibers on the telescope.
 |
The first two frames in Figure 2 show a typical far-field image and cross-sectional profile of the “input” spot (i.e. the cone of light the test bench creates and that is coupled into an optical fiber). The input spot is used to both confirm the input f-ratio of the fiber test bench and provide a “baseline” flux for the transmission measurements. The light source is very stable (% variation over several hours) and therefore provides the reference point for our transmission measurements. The right two frames in Figure 2 show a far-field image and cross-sectional profile for the “output” spot (i.e. the light after it has passed the length of an optical fiber). The central obscuration, simulating the secondary mirror of a typical telescope, is clear in all the output images, with some amount of FRD throwing light both into the central obscuration and the outer halo. By stepping the camera over 7 small (4 mm), well controlled increments along the optical axis of the fiber, and capturing images of the far-field at each camera step, we can map out the output light cone. At each camera position we take a series of exposures and darks for each of the 9 interference filters. These frames, once referenced to the corresponding baseline frame, provide 7 measurements of the transmission (one from each camera position) at each of our 9 bandpasses.
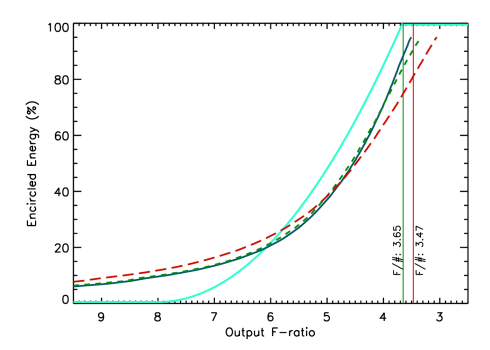
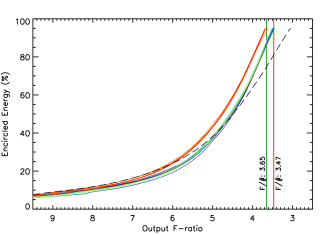
In order to quantify the effect of FRD over the entire fiber profile we consider the f/out at a wide range of EE, rather than quoting a single value (e.g. 95% EE). The measure of FRD for a single fiber is accomplished by determining the radius, in pixels, for a range of encircled energy (EE) values from 5% to 95%, in 1% increments, for each of the 7 camera positions and 9 wavelengths. A line is fit through the 7 radius values at each EE value. This set of lines then defines the output angle of the light from a single fiber for the 90 different EE values we’ve measured. By knowing the camera step size and physical CCD pixel size we can determine the f/out, in absolute terms, and thus the FRD of the fiber. Figure 3 shows an example of this analysis for three fibers in the fiber bundle used for the lifetime tests (see §4), and plots EE against f/out for three fibers exhibiting various degrees of FRD. The input f-ratio (f/3.65) is shown as a vertical line. The light teal line represents what a fiber experiencing no FRD would look like. The solid blue line shows a fiber with good FRD characteristics; there is a low level of light thrown into the center (as exhibited by the lower values of EE at higher f/out), and less light thrown outwards (as seen in the steepness of the increase in EE at lower f/out). The short-dash green fiber shows a slight worsening of FRD, primarily in the outer halo. The long-dash red fiber shows significant FRD, with elevated levels of light both in the central obscuration and the outer halo. Figure 3 reveals an interesting effect of a well-studied phenomena of optical fibers. Rays incident on a fiber at higher f/in suffer from higher FRD (e.g. Ramsey (1988); Poppett & Allington-Smith (2010b)). As the rays near the central obscuration are incident at higher f/in ( f/8) than those near the outer edge of the input spot ( f/3.6), they suffer from more FRD than those near the edge of the input spot. Therefore, the severity of the FRD experienced by a ray is a function of it’s incident angle, which changes smoothly from the center of the input spot to the outer edges. If the strength of the FRD on the central rays is not strong enough to send the light entirely outside f/3.65, you should expect to see a piling-up effect of the light in the output spot. We see such an effect, as evidenced by the blue FRD vs. EE curve being steeper between f/5 to f/3.5 than the curve showing the theoretical light profile of a fiber experiencing no FRD. You can also see this effect directly, although not in a quantified way, by visually inspecting the far-field images of the output spots (Figure 2).
3. BEND RADIUS TESTS
|
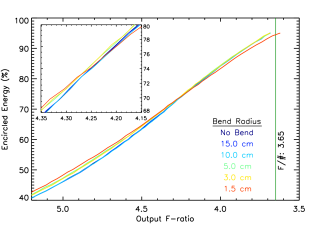
In order to set a fiber bend radius limit for the VIRUS instrument we conducted a series of tests to explore the influence of fiber bending on FRD. Three different fiber types were tested: CeramOptec UV265/292P/320, Fibertech AS266/292UVPI/318 and F & T 266/292. The three, 10 m length fibers were inserted into furcation tubing, mounted with standard SMA905 fiber connectors, then both ends were polished by hand and tested for their bend radius characteristics. First, each fiber was tested twice for FRD without any bends in the fiber, once through each end of the fiber. Then, the fiber was laid flat on a table, with a single loop placed into the center of the fiber. Care was taken not to add any extra twists into the fiber when making the loop. The fiber was then tested for FRD at increasing bend radii from R = 15 cm to R = 1.5 cm. The fiber was then retested in the same manner, yet coupling light into the other end of the fiber.
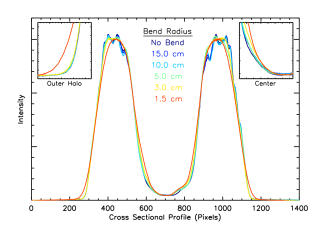
As the results for all three fibers are very similar, we have plotted the results from just the Fibertech fiber in Figure 4. Note the high quality of the end polish achieved for these tests as evidenced by the very low level of light in the central obscuration (Figure 4, right). The effect of FRD with bend radius is subtle, yet clearly evident. For the first three bend radii (none, 15 cm and 10 cm) there is no measurable increase in FRD or change in the cross-sectional profile of the far-field output spot. Then, at both 5 cm and 3 cm bend radii, we see the first evidence of FRD, and note an interesting affect; FRD is evident in the central obscuration, but not in the outer halo. This stems from the same affect described in the previous section, with the f/8 rays near the central obscuration suffering from stronger FRD. It is only when the bend radius reaches 1.5 cm that we see clear FRD into the outer halo. It is also worth noting the mode mixing that occurs with bend radius, as seen in the smoothing of the cross-sectional profiles, plotted to the right in Figure 4.
4. LIFETIME FIBER TESTS
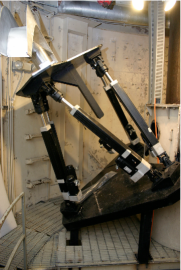
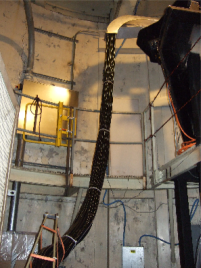
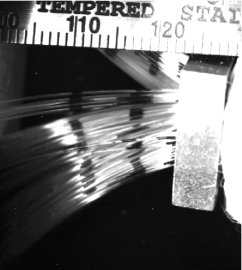
There are two critical aspects of the VIRUS IFU performance we want to understand and that were not explored in M08 or in other published work. First, how do optical fibers behave while in motion, and do these effects depend on the rate of fiber motion, if at all? This understanding is necessary for VIRUS as the HET tracks its targets via motion of a suite of mirrors at prime focus (called the Prime Focus Instrument Package, or PFIP). The VIRUS fiber input heads are connected to the PFIP and are thus subject to the motions required to both point and track the telescope. The second question we seek to address is how do the properties of a VIRUS fiber bundle change over time due to the accumulation of wear. In order to explore these questions we simulated 10.2 years of wear (188.7 km of linear travel) on a single VIRUS fiber bundle. The simulated motion was carried out between February and May, 2011 on a test rig designed and built for this purpose. The complete details of the test apparatus are given in Soukup et al. (2010). In Figure 5 we show pictures of the final test configuration (left two images) and a single frame (right) from a camera placed to monitor the motion of the optical fibers relative to their protective conduit.
|
To briefly summarize the test apparatus, the test platform is moved by 6 actuators, allowing linear motion in X, Y and rotation (rho). The range of travel is designed to simulate the motion the fibers will experience from the PFIP. A lower stage provides motion at the bottom half of the fiber bundle to simulate the motion coming from the telescope tracking (see Figures 6 and 8 in Soukup et al. (2010)). Three distinct “tracks” were run, simulating a range of observation tracks that HETDEX will take on the sky. A wide range of track rates were explored, yet all fall into one of three categories: “quiescent”, “observation”, and “slew”. For the quiescent stage, all motion is stopped and affords a reference for the tests. In the observation mode, the fibers are moved at typical telescope tracking rates (0.77 to 1.3 mm/sec) in order to explore the affect of fiber motion on our science frames. Lastly, slew mode covers the fastest rates of motion on the HET, similar to typical telescope slew rates. A wider range in the rate of motion was explored in this mode (24.3 to 140 mm/sec), yet as the results were quantitatively similar, they have been included in the same designation. In order to reach the goal of 10 years of simulated life within months, the majority of the lifetime tests were run in the slew mode. As the current VIRUS calibration plan makes use of the second rewind of the telescope for capturing arc and flat field frames, a clear understanding of the fiber behavior during the slew mode is also critical to the HETDEX project.
4.1. METHODS
 ……
……
|
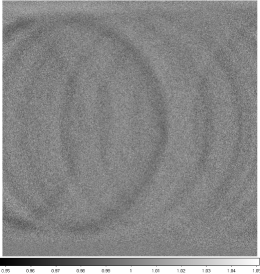
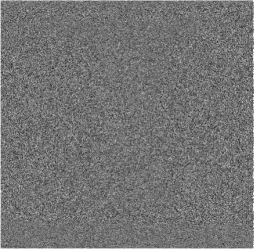
For the lifetime tests we wanted to capture potential changes in the fiber behavior taking place on short timescales (5 to 30 seconds) and do so over a large number of fibers simultaneously. Yet the tests described in M08 and outlined in §3 are carried out on individual fibers, with a complete set of transmission and FRD tests taking hour. To achieve the goal of sampling both a large number of fibers and doing it at a rapid cadence we took an heuristic approach to the problem, which we describe here. We start by coupling a collimated beam of light into the input end of the fibers at a controlled angle. Then, by relying on the azimuthal scrambling of light within a fiber, we simulate a full light cone at an input f-ratio of f/3.65. This approach allows us to couple light into all the fibers simultaneously, and is conceptually similar to laser-based tests for FRD (Haynes et al., 2008). The collimated light is filtered with a broad ( Å) bandpass filter centered at 500 nm. We then use a 3k 3k CCD to image the far-field output of a large set of fibers () simultaneously. These frames are taken at a cadence of a single, 1 second exposure every 5 to 30 seconds, depending on the tests being run. Approximately 250,000 frames were collected over the duration of the lifetime tests. The left-hand image in Figure 6 gives an example of a typical frame taken during testing showing the far-field light of fibers. Clearly the light from neighboring fibers is confused with the light from other fibers. To overcome this confusion we employ a differential measurement, wherein frame-by-frame division is used to detect transient FRD events; by analyzing each divided frame for deviations from 1.0, and doing so for a large number of frames over a long baseline, we are able to determine both the severity of the FRD events and how the events are correlated to the motion of the test platform. An example of a single divided frame is shown to the right in Figure 6. For each frame, information on the platform position (X, Y and rho), the lower stage position, and both temperature and humidity at two locations, near the input and output ends of the fiber bundle, were recorded. No measurable affect from humidity was seen, so we do not discuss it further. Plots of the various parameters against one another (see §4.2.2) allows us to explore correlations and better understand the causes of the transient FRD events.
|
|
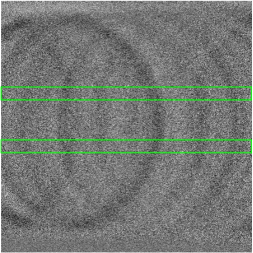
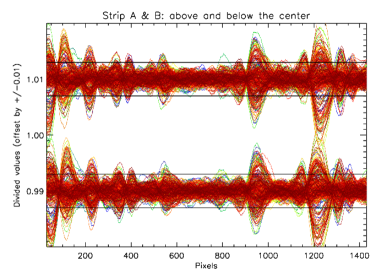
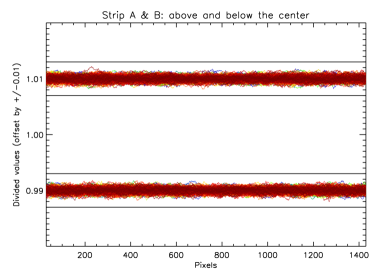
In order to quantify the transient FRD events seen in the lifetime tests, two regions from each set of divided frames are selected for analysis. These two regions are then median combined along the Y-direction and plotted as a cross-section through the frame division. Figures 7 and 8 show examples of this process for a slew and quiescent period of the testing, respectively. The left-hand frame in Figures 7 and 8 show a single divided frame, with the regions selected for analysis shown as green rectangles in Figure 7; the cross-sections of those regions are plotted to the right. The divided cross-section values are centered around 1.0 yet have been offset in the plot by for visual clarity. Note that although we have shown a single, divided frame to the left in these figures, the cross-sections of 400 divided frames are plotted in the frames to the right. The evidence for transient FRD is clearly seen in the cross-sections plotted in Figure 7. A threshold is then set for deviations from 1.0. This threshold was set to and is plotted as horizontal black lines in the cross-sectional plots in Figures 7 and 8. Although the threshold value is somewhat arbitrary, we are making a differential measurement and so the exact threshold value chosen is not important. Once this threshold is set, we simply count up the number of pixels that fall outside our threshold in the cross-sectional cut of a given divided frame. The more counts that fall outside the threshold, the more severe the FRD is for a given frame. We will refer to this number as the severity-of-event (SOE) value. The SOE value is, admittedly, a crude measure in that it lumps different scenarios under a single value. For example, one could have low-level FRD in many fibers, or extreme FRD in a single fiber, yet calculate the same SOE value. However, from inspection of many of the individual frames, and as evidenced in the cross-section plot of Figure 7, the typical case is that the FRD events are localized to a select number of fibers that get repeatedly affected.
4.2. LIFETIME TEST RESULT SUMMARY
The fiber lifetime tests revealed a number of interesting results on the behavior of optical fibers, both while in motion and the effect of accumulated wear. We summarize our primary results here, with the details given in §4.2.1, §4.2.2 and §4.2.3: (1) The fiber bundle went through a period of rapid settling. The outer conduit stretched by cm over the first 4 days. After this period of settling, the excess conduit length was taken up by an adjustment made at the output slit (see the right-hand image in Figure 5). Further settling was minimal over the remainder of the tests, with another 0.3 cm of movement occurring over the subsequent days, and none over the final 3+ months of the tests. (2) Six fibers broke over the 10+ years of simulated wear. Two of the six broken fibers were initially weak and were likely already damaged at the start of the tests. Therefore, the loss of 6 fibers over this time period is considered an upper-limit. (3) The motion of fibers at slew rates led to transient FRD events that tended to cluster around specific locations along a track. The location of the clustering was dependent on the track being run, with certain tracks showing a bimodal distribution, and one a trimodal distribution in the location of the FRD events. We believe these transient FRD events are due to localized stress and subsequent mircobending in a select number of fibers. (4) Transient FRD events for slew rates were common, but at a low level (%), and drop to effectively zero when the tracks are run at observation rates. (5) Although no loss in overall fiber transmission was seen over the lifetime tests, clear evidence for a permanent increase in FRD was seen in all 18 fibers tested both before and after the lifetime tests.
4.2.1 FIBER SETTLING AND BREAKAGE
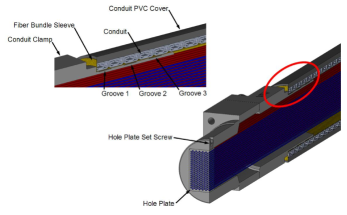
|
The motion of the optical fibers relative to their protective conduit was monitored during the lifetime tests in order to measure the amount of settling we can expect in the VIRUS fiber bundles. Excessive settling of the fibers relative to their conduit can lead to fiber tension and, in extreme cases, fiber breakage. To understand how the fiber bundle will settle, the position of the fibers relative to their conduit was monitored at the point where the fibers break out of the conduit and enter the output slit assembly (see the central image of Figure 6 in Hill et al. (2010)). The monitoring was done with a machine vision camera mounted just above where the fibers enter the slit assembly. An example of one frame used to monitor fiber motion is seen in the right-hand image in Figure 5.
The fiber bundle experienced some early and rapid settling, with cm of fiber being drawn into the conduit as the conduit settled and lengthened. This settling took place within the first days of testing. The output slit assembly connects to the conduit via an adjustable tail-piece. We therefore adjusted the tail-piece to take up the excess conduit length and continued to monitor fiber motion. The fibers settled another cm over the next 2 weeks. After that, no measurable motion of the fibers was observed over the remainder of the 3+ months of the lifetime tests.
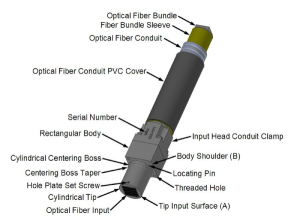
Over the duration of the lifetime tests 6 fibers broke. Initially the test fiber bundle was fabricated with an input head at both ends. Figure 9 shows a schematic of the input head. This configuration was initially chosen so that all 448 fibers could be monitored with a single CCD camera during the tests. However, we later elected to change this design to better match the final arrangement of the fibers at the output slit. During the reconfiguration of the fiber bundle and re-polish, several of the fibers were broken. This didn’t impact our test results, yet may have influenced the number of fibers that broke during the lifetime tests, as 2 of the 6 fibers that broke were noticeably weak in transmission at the start of the tests. We therefore conclude that the breakage of 6 fibers from wear over 10 years is an upper limit for the VIRUS instrument.
4.2.2 FIBER MOTION AND TRANSIENT FRD
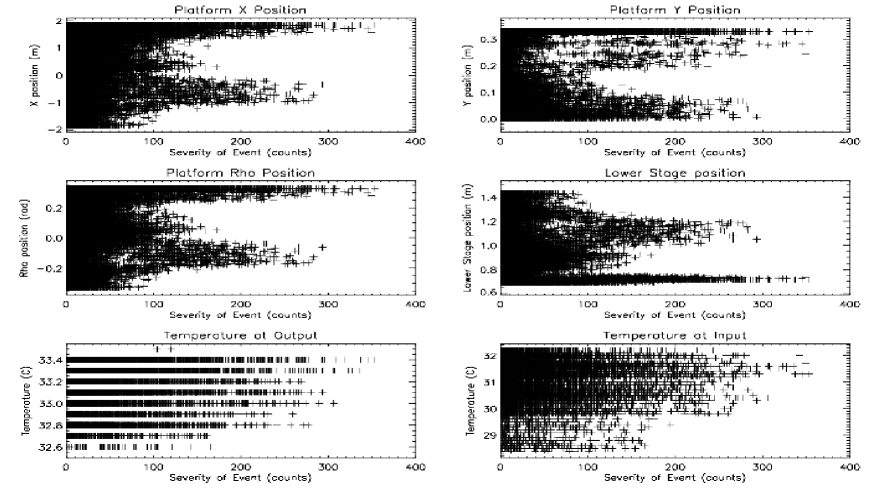
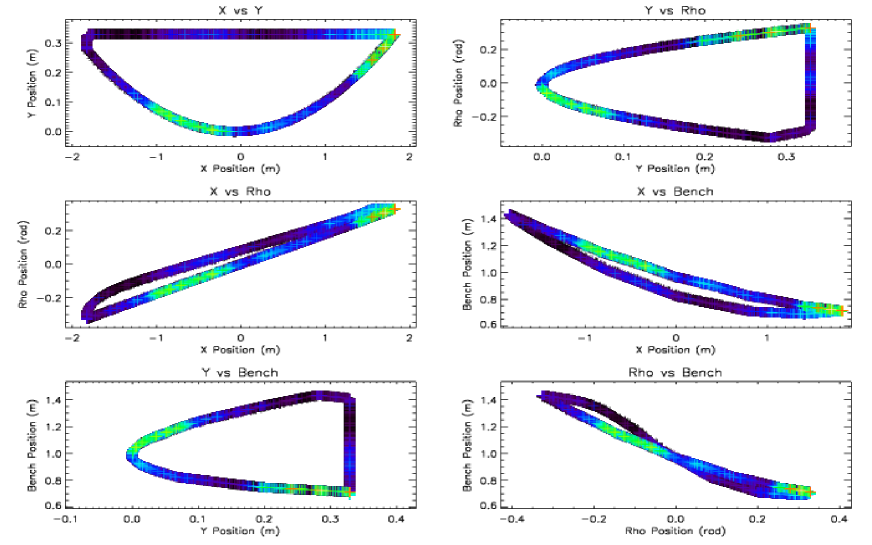
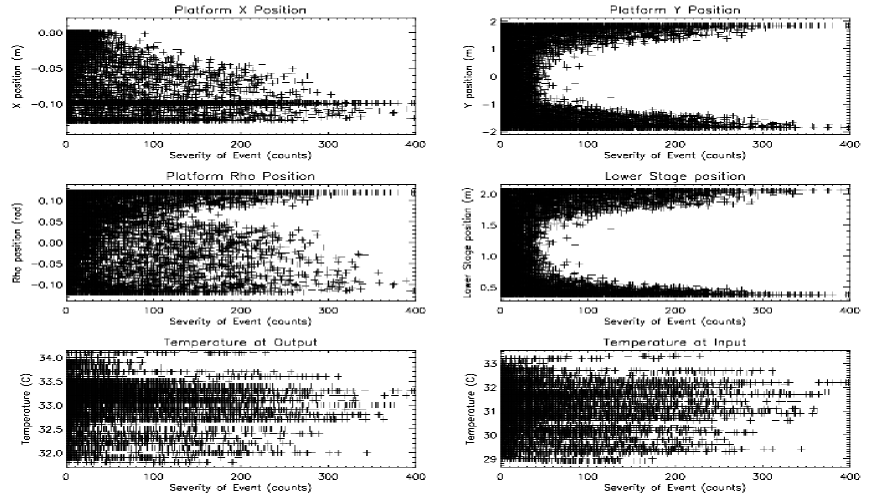
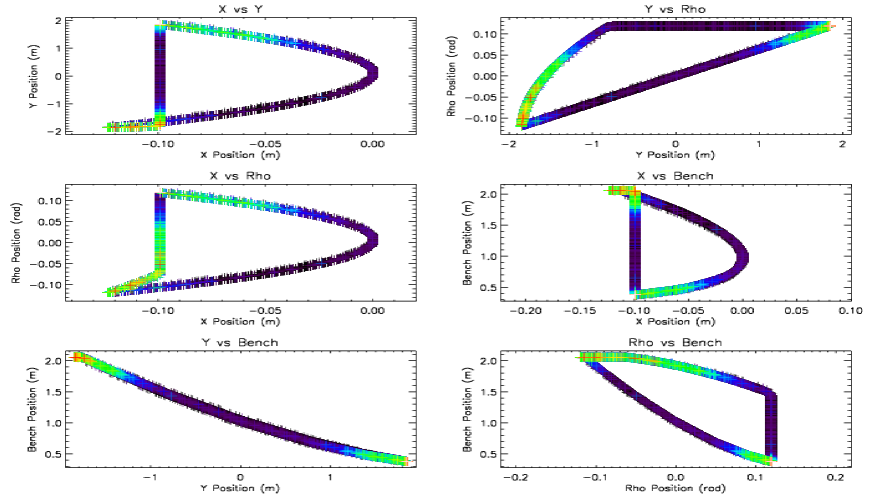
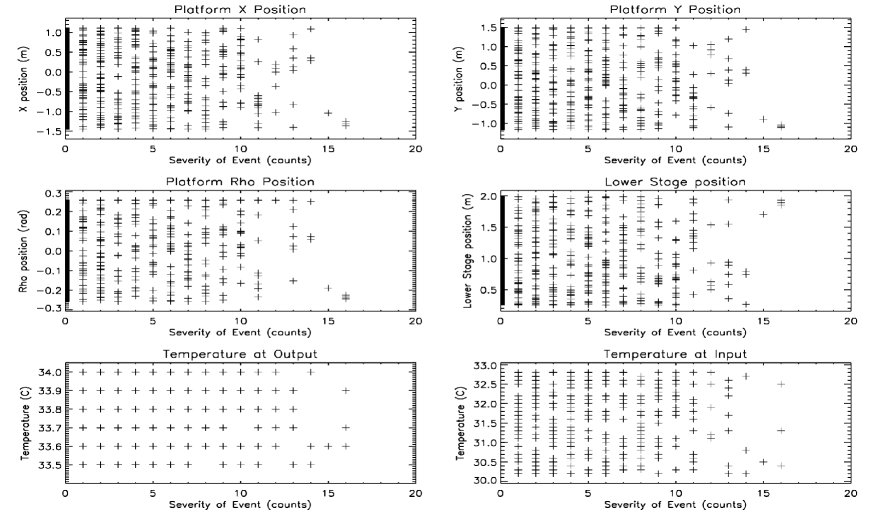
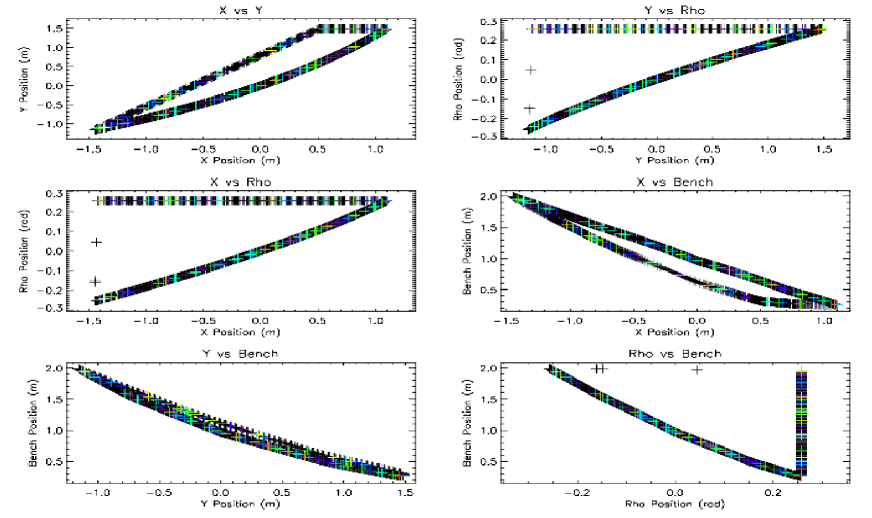
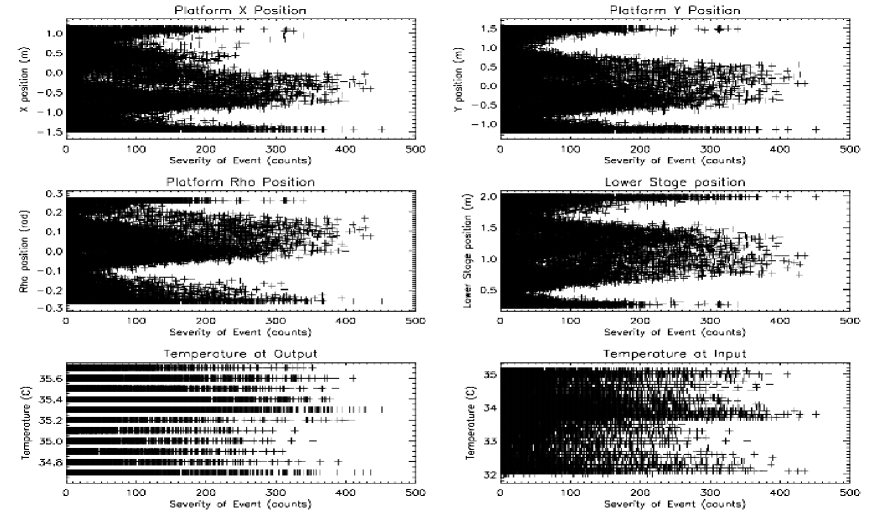
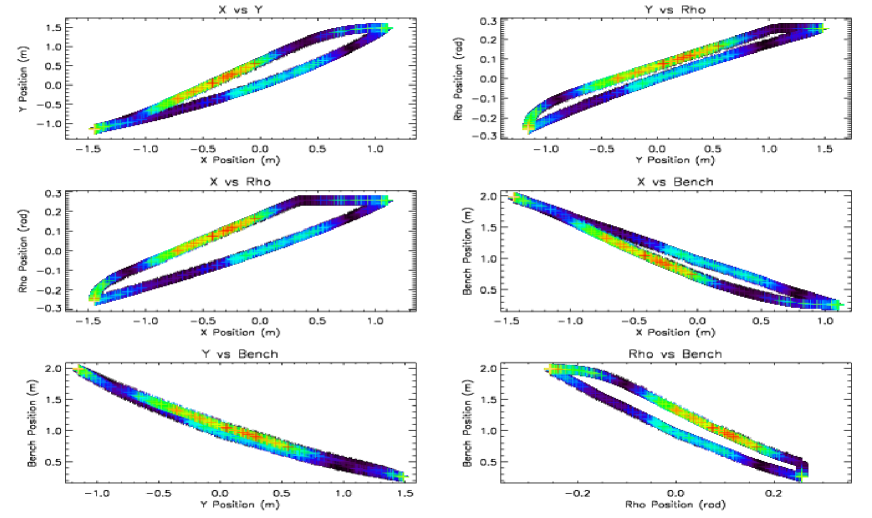
With an SOE value attached to each set of divided frames (as described in §4.1) we can plot the various parameters, both against the SOE values and against one another. This proves extremely informative as we are then able to determine at which positions the transient FRD events are most common, and, with thousands of repeat measurements, begin to see subtle trends in the data. Figures 10 and 11 show the effects of motion on the fibers during the lifetime tests. In Figure 10, the SOE value is plotted against 6 different parameters in order to map out where the transient FRD events are the most severe. The top two rows in Figure 10 plot the position of the test platform (X, Y, rho) and lower stage against the SOE number. The lower row plots temperature at the output slit (left) and the input head (right). Nearly 20,000 frames are plotted here, all taken in slew mode and spanning just over 5 days. In Figure 11 the same data set is shown, only with the various motion parameters plotted against one another in order to show correlations. The color indicates the SOE value, with black being an SOE value of 0 and red being the highest value seen in Figure 10. For this track it is clear that the FRD events that drive the SOE number to higher values occur at two locations along the track. In the Appendix (Figures 17 to 22) we show similar figures for a subset of different tracks and rates run during the lifetime tests, including tests run at observation rates (Figures 19 and 20).
 |
 |
In all 3 slew tracks, the high SOE values ranged from to over 400, yet the transient FRD effects dropped to nearly zero for the same tracks when run in the observation mode. Clearly the speed at which the fiber bundle is moving, rather than the track itself, is what drives the transient FRD events. This begs the question, if the transient FRD events are caused by short-term, localized stress, as we hypothesize, then why do the fibers that exhibit FRD at certain locations along the track not exhibit that same FRD at observation rates? A difference in frame sampling cannot explain this, as we have compared frames over a range of different time cadences (e.g. a frame is divided by frames other than its nearest neighbor).
We believe the difference between the slew and observation rates is due to a difference in settling time; at slew rates the fibers do not have a chance to smoothly settle. This leads to regions of temporary, localized stress. Based on the cross-section plot in Figure 7 it is clear that a relatively small number of fibers are being affected repeatedly. Along certain points in the track these fibers experience localized pressure as they roll over one another. In the slew track rate, the fibers don’t have time to alleviate the pressure between the fibers, leading to low-level, transient FRD. In the observation mode, the rate is slow enough to allow proper fiber settling and the localized points of stress are avoided.
4.2.3 BEFORE AND AFTER TESTS
|
 |
Before the lifetime tests were carried out, the test fiber bundle was characterized for both transmission and FRD. Twenty-five fibers were tested before the lifetime tests and 18 of those same fibers were re-tested after. In Figure 12 we plot both the transmission and FRD results for the 25 fibers tested before the lifetime tests. As we wanted to observe unmitigated fiber FRD, the input and output lens and index-matching gel were not installed. As previously shown (compare Figures 10 and 11 in M08) the index-matching gel and cover-plates are expected to boost the transmission values by % at all wavelengths. Also, the input end surface polish on the test fiber bundle was below specification. Therefore, we expect the FRD and transmission values shown in Figure 12 to improve for the final VIRUS science fiber bundles.
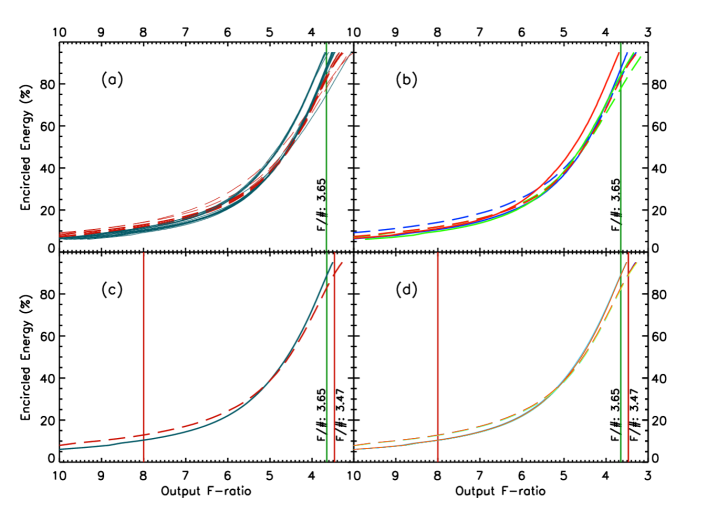 |
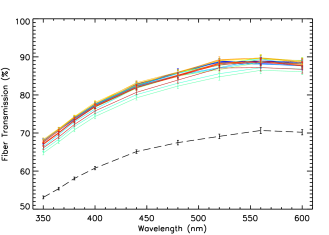
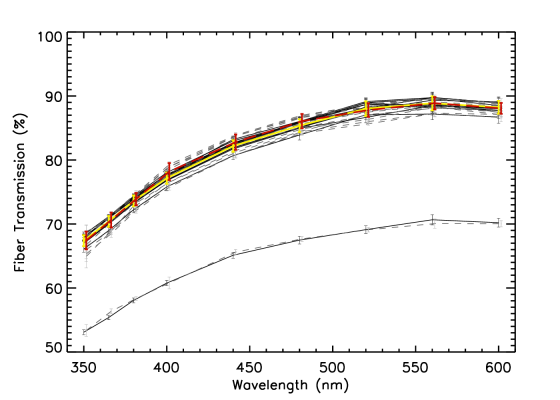
Figure 13 plots fiber transmission from both before and after the lifetime tests. After rejecting the fiber that shows very low transmission, we calculate and plot the average of the before (solid, yellow) and after (dashed, red) data. We find no measurable change in the transmission of the VIRUS fibers, at any wavelength, over the 10+ years of simulated wear. Because we count all photons that pass through the fiber, and are not concerned with the effects of FRD, the transmission values before and after the test agree remarkably well, despite the clear increase in FRD seen.
In Figure 14 we plot the primary results of our FRD measurements taken before and after the lifetime tests. A second major finding of the lifetime tests is that we see clear evidence for increased FRD in all 18 fibers re-tested at the conclusion of the lifetime tests. Although the total transmission of the fibers was unaffected, an increased level of light was seen in both the central obscuration and outer halo. This is best seen in Figure 14c where we have plotted the average of 17 of the 18 fibers tested both before and after the tests; the fiber exhibiting extremely poor FRD was withheld. The FRD curve taken after the lifetime tests (dashed, red line) clearly shows more light lost to the central obscuration and the outer halo. The increase in FRD was seen at the same level at all 9 wavelengths tested, as seen in Figure 14d. The before (solid) and after (dashed) curves for all 9 wavelengths are overplotted from blue to red and are nearly identical. We refer the reader to the caption of Figure 14 for a complete description of the plots. Although the cause of this rise in FRD is not known with certainty, we speculate it is due to an increase in microfractures stemming from repetition of motion of the optical fibers. This type of FRD stands in sharp contrast to the transient FRD events that are driven by localized shear and that typically occur at the limits of the track range.
We can use these FRD measurements from before and after the lifetime tests to make a crude estimate of the rate of transmission loss we expect to see in the VIRUS instrument due to increased FRD. This estimate necessarily makes a number of simplifying assumptions. First, we assume a circular central obscuration that does not change. This is a simplification for two reasons. One, the pupil of the instrument has both a wavelength and in-slit fiber position dependence; the location of the CCD relative to the central obscuration within the instrument changes (Lee et al., 2010). Two, the illumination pattern of the HET is also variable and changes over a given track, so the light coupling into a fiber varies. Setting aside these complicating factors, we can estimate the percentage of light lost both into the central obscuration, where light will be blocked by the CCD, and outside the acceptance f-ratio of VIRUS. We estimate the light lost to the central obscuration at 2.7% over a 10 year life span. The loss of light outside the acceptance f-ratio is greater and measures 5.8%. Therefore, the total loss due to increased FRD over a 10 year lifespan is 8.5%. If we make a further simplifying assumption of a linear increase in FRD over that time, this gives a through-the-instrument transmission loss rate of 0.85% per year due to increasing FRD effects.
5. MITCHELL SPECTROGRAPH FIBER BUNDLE DEGRADATION
 |
 |
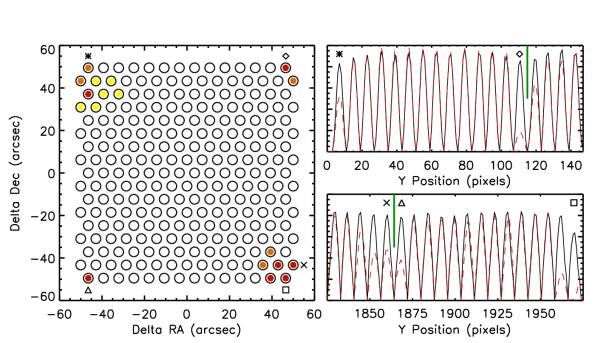
The Mitchell Spectrograph (formally VIRUS-P) (MacQueen et al., 2008) is an integral-field spectrograph that has been in use on the Harlan J. Smith 2.7 m telescope at McDonald Observatory for the past 6 years. The current fiber bundle, VP2, has been the primary science bundle from Spring, 2008 to the present. VP2 is composed of 246 optical fibers, each with a 200 m core diameter. Complete transmission and FRD tests for VP2 can be found in M08. Here, we report on a drop in overall fiber transmission in a select number of fibers seen in VP2. This transmission drop is caused by severe FRD due to a localized shear in the affected fibers that occurs near the input head of the fiber bundle, which is similar to the design shown in Figure 9. Figure 15 plots the on-sky positions of all the fibers in VP2. When the fiber bundle was first commissioned in Spring, 2008, all 246 of the optical fibers were within specification and performing well on sky (Murphy et al., 2008). However, over time we have seen a drop in the transmission of the 18 fibers highlighted in Figure 15. The colors in the left-hand plot of Figure 15 indicate the severity of the decrease as described in the figure caption. This drop in transmission is seen clearly in the flat field cross-sectional profiles, shown to the right in Figure 15, and can reach % in the worst cases.
The drop in fiber transmission was first noticed during an observing run in December 2008. VP2 is 22 m long, yet the length needed for the Mitchell Spectrograph is just over 4 m. As the Mitchell Spectrograph is a prototype for the VIRUS instrument, the extra fiber length was necessary for engineering runs on the HET during the design of VIRUS. When the Mitchell Spectrograph is in operation on the 2.7 m telescope, the extra length of VP2 was being taken up by a D m coil attached to the side of the instrument. With the discovery of the drop in transmission of the corner fibers in VP2, we speculated this was due to accumulated stress in the fibers and subsequent FRD; due to the clear trend in the location of the affected fibers, it was hypothesized that we were seeing an explosive form of FRD in select fibers stemming from accumulated twists that propagate the length of the fiber bundle and terminate at the input head. As the fibers are glued in place at the input head, the twists can no longer propagate and a shear develops between a fiber and its point of termination. Fibers at the outer edges of the input head take up the majority of this transmitted shear and thus exhibit the highest FRD. The fiber bundle was uncoiled and shaken out during an observing run in February 2009, and the transmission of all affected fibers returned to normal.
VP2 was taken back to the lab where twist tests were conducted on the fiber test bench. Figure 16 shows 4 far-field images of a single corner fiber (denoted with a triangle in Figure 15), with various levels of twist placed into the fiber bundle. From these tests we confirm that the loss in transmission was an extreme form of FRD due to localized shear at the input head, with light being lost into the central obscuration and outer halo. Surprisingly, the test twists were placed into the fiber bundle nearly 10 m away from the input head, and reveals how far fibers can propagate stress before manifesting its results. It is very likely that, in the most extreme cases, where overall transmission loss exceeds 40%, the localized shear is causing loss of total internal reflection and thus significant light loss into the fiber cladding. Regrettably, testing for loss of total internal reflection was not done while VP2 was in the lab, so this hypothesis remains untested. We also note that, like the FRD seen in the lifetime tests, we see no evidence for a dependence on wavelength in the loss of transmission due to localized shear. In Poppett & Allington-Smith (2007) they see a trend of increasing FRD with wavelength over the 450–700 nm range of their tests. However, this trend is clear in their data at the slower f-ratios of their tests (e.g. f/in ), but is not readily apparent in their results at f/in 5, which is the range for our tests.
Since the discovery of this FRD effect, the fiber bundle was re-routed on the telescope to remove any loops. This change in routing alleviated the twisting stress and returned the overall transmission of all affected fibers back to normal. Fiber transmission, when not being affected by this stress-induced form of FRD, has been shown to be very stable (Adams et al., 2011). However, over the course of the past year, the transmission of these affected fibers has been declining. Attempts at relieving the stress with manipulation and re-routing of the fiber bundle have failed, and the low transmission of the affected fibers is now permanent. We note that the fiber routing for the Mitchell Spectrograph, even after the elimination of the fiber coil, has numerous places where the bend radius is at or tighter than the 10 cm limit set for the VIRUS instrument. In §6 we give further discussion of the implication of this transmission loss for VIRUS and other IFU fed spectrographs.
6. DISCUSSION
We give a recap of the tests presented here, then discuss what implications this work has for both the VIRUS instrument and other projects which employ fiber optics that experience stress or motion during science observations or deployment. In summary:
1) We find clear evidence for an increase in FRD due to the accumulation of wear from repeated motion. Surprisingly, FRD due to poor fiber surface polish is effectively washed out by this new FRD, which likely comes from microfractures formed by repeated motion. This increase in FRD shows no dependence on wavelength. Although FRD is found to increase with wear, no loss in overall transmission was seen in the same fibers.
2) Fiber motion leads to low-level (), transient FRD events in a select number of fibers. The rate necessary to manifest these FRD events is typical of a telescope at a slew rate of travel (e.g. 40 to 120 mm/sec). When the fibers were moved at a rate typical of a science observation (e.g. 0.8 to 1.3 mm/sec), the transient FRD events dropped to a negligible level. These FRD events tended to cluster into bimodal or trimodal distributions along the the limits of the telescope track where the stress on the fiber bundle was at a maximum.
3) Bend radius tests on the 266 m core fibers showed no evidence for increased FRD down to a R = 10 cm bend radius. From 5 cm R 3 cm, the fibers experienced FRD for slower input f-ratios (f/8) as evidenced by the increase in light thrown into the central obscuration, but not the outer halo. By R = 1.5 cm, FRD increased for both slow and fast (f/3.65) input f-ratios.
4) An explosive form of FRD has been seen in the current fiber bundle in use for the Mitchell Spectrograph. Transmission in 18 fibers is affected, and stems from localized stress at the input head. The FRD is causing light to scatter both into the central obscuration and the outer halo. In the most severe cases, when transmission loss exceeds 50%, loss of total internal reflection within the fiber is suspected.
It is instructive to review the causes of these various forms of FRD before discussing the implications for the VIRUS instrument. We find evidence for all three distinct forms of FRD as studied in Haynes et al. (2011). The first is end-surface scattering, due to poor fiber polish. This can take the form of visual scratches and pits, and also sub-surface damage from the polishing process. The evidence for this form of FRD is best seen in Figure 12 where a clear bimodal distribution in the FRD characteristics of the lifetime test fiber bundle is seen. The bimodal nature of the FRD curves has an exact correlation with where on the input head the fiber is located. A large region of the fiber head was polished to a lower level, and this is directly reflected in the increased FRD measured of those fibers.
A second form of FRD were the transient events seen throughout the lifetime tests. As the fibers were in motion at a rate of travel high enough to not allow for a smooth dissipation of regions of localized pressure, microbends develop and lead to low levels of FRD. This is seen in the increased SOE values during the accelerated sections of the tests, and most prominent at the limits of the tracks where fiber bundle stress was likely the highest (see Figures 10 and 11 and in the Appendix). While these FRD events in the lifetime tests were transient, we also find that an accumulation of localized shear and subsequent microbends can become permanent, as seen in the degradation of the VP2 fiber bundle in use on the Mitchell Spectrograph.
The third form of FRD seen in these tests is evidenced by comparing the FRD values from before and after the lifetime tests (see Figure 14). Although we can not be certain, we believe this increase in FRD is due to microfractures that have formed in the fibers from repeated motion. The FRD caused by repeated flexure is permanent and washes out the FRD due to poor surface polish (see Figure 14a). Of these various sources of FRD, all but one is directly under the control of the fiber bundle manufacturer. FRD induced by surface scattering is remedied by higher quality end polish. The cross-sectional plots shown in Figure 4 give an indication of how well a fiber can be polished. However, this was for a single fiber, and an accurate, flat polish of the much larger surface area of typical fiber bundle input head is more difficult to achieve than for the single fiber shown in Figure 4.
Perhaps the source of FRD most critical to the VIRUS instrument, and astronomical instrumentation in general, is the FRD coming from localized shear and subsequent microbending. The importance of understanding this form of FRD becomes clear when one considers its variable nature. Although FRD due to surface scattering is not ideal, it is at least stable over time. Yet when FRD is variable, calibrations become difficult to impossible, and systematic errors with flat-fielding and extraction of on-chip fiber profiles can dominate your uncertainties. For the VIRUS instrument, an understanding of these challenges, as discovered from the VIRUS prototype, the bend radius tests, and the lifetime fiber tests, has led to careful consideration in the design of the fiber routing for VIRUS. This includes a bend-radius limit and the design of the three strain reliefs used to manage the fiber bundles once deployed on the HET. The current calibration plan for the HETDEX project involves collecting flat-field and arc lamp frames while slewing the telescope to target the next field. The levels of transient FRD seen in the lifetime fiber tests were quite low, typically with a maximum rarely greater than 1.0%. Whether this affects the calibrations at a detectable level will need to be explored further, once VIRUS is on-sky.
A final lesson gleaned from the degradation seen in VP2 is both in the initial design and packing fraction of the fiber bundle, and how the fiber bundles are deployed. In VP2, the fiber packing fraction inside the fiber conduit is tight. Allowing enough space, or providing a low-friction buffer, such as a Teflon tubing, so that torsion placed on the fiber conduit does not pass directly to the fibers, can mitigate the transfer of shear into the fibers. Yet perhaps more critical is how the fiber bundles are deployed. The coiling of VP2 was certainly the source of the initial problems seen with fiber transmission loss. Once the twists of the coiling were released, the transmission returned to normal for years. It is unclear what has led to the permanent decline in these fibers (Figure 15), but as the transmission loss was previously shown to come from localized shear, it’s likely that the fibers have worked themselves into a configuration that can not be undone by fiber bundle manipulation and shaking. It is also not clear if the effect seen in VP2 is really a risk for VIRUS, as the bundles will not experience the relatively sharp bends (R cm) found in the Mitchell Spectrograph, and the VIRUS IFUs will use a Teflon inner lining. One possible solution for other IFU-based instruments would be to include a row of dummy fibers along the outer edges of the IFU. As the twists that led to explosive FRD in VP2 were placed meters from the input head, the dummy fibers would need to run the length of the fiber bundle. For the VIRUS instrument, this was prohibited by space constraints at the IFU head, but could be implemented on other IFU configurations for future instrumentation.
References
- Adams et al. (2011) Adams, J. J., Blanc, G. A., Hill, G. J., Gebhardt, K., Drory, N., Hao, L., Bender, R., Byun, J., Ciardullo, R., Cornell, M. E., Finkelstein, S. L., Fry, A., Gawiser, E., Gronwall, C., Hopp, U., Jeong, D., Kelz, A., Kelzenberg, R., Komatsu, E., MacQueen, P. J., Murphy, J., Odoms, P. S., Roth, M., Schneider, D. P., Tufts, J. R., & Wilkinson, C. P. 2011, The Astrophysical Journal, Supplement, 192, 5
- Angel et al. (1977) Angel, J. R. P., Adams, M. T., Boroson, T. A., & Moore, R. L. 1977, The Astrophysical Journal, 218, 776
- Avila (1998) Avila, G. 1998, in Astronomical Society of the Pacific Conference Series, Vol. 152, Fiber Optics in Astronomy III, ed. S. Arribas, E. Mediavilla, & F. Watson, 44–+
- Bershady et al. (2004) Bershady, M. A., Andersen, D. R., Harker, J., Ramsey, L. W., & Verheijen, M. A. W. 2004, Astronomical Soc. of the Pacific, 116, 565
- Brunner et al. (2010) Brunner, S., Burton, A., Crane, J., Zhao, B., Hearty, F. R., Wilson, J. C., Carey, L., Leger, F., Skrutskie, M., Schiavon, R., & Majewski, S. R. 2010, in Society of Photo-Optical Instrumentation Engineers (SPIE) Conference Series, Vol. 7735, Society of Photo-Optical Instrumentation Engineers (SPIE) Conference Series
- Bryant et al. (2010) Bryant, J. J., O’Byrne, J. W., Bland-Hawthorn, J., & Leon-Saval, S. G. 2010, in Society of Photo-Optical Instrumentation Engineers (SPIE) Conference Series, Vol. 7735, Society of Photo-Optical Instrumentation Engineers (SPIE) Conference Series
- Bryant et al. (2011) Bryant, J. J., O’Byrne, J. W., Bland-Hawthorn, J., & Leon-Saval, S. G. 2011, Mon. Not. R. astr. Soc., 415, 2173
- Carrasco & Parry (1994) Carrasco, E., & Parry, I. R. 1994, Mon. Not. R. astr. Soc., 271, 1
- Clayton (1989) Clayton, C. A. 1989, Astronomical Soc. of the Pacific, 213, 502
- Craig et al. (1988) Craig, W. W., Hailey, C. J., & Brodie, J. P. 1988, in Astronomical Society of the Pacific Conference Series, Vol. 3, Fiber Optics in Astronomy, ed. S. C. Barden, 41–51
- Crause et al. (2008) Crause, L., Bershady, M., & Buckley, D. 2008, in Society of Photo-Optical Instrumentation Engineers (SPIE) Conference Series, Vol. 7014, Society of Photo-Optical Instrumentation Engineers (SPIE) Conference Series
- Haynes et al. (2008) Haynes, D. M., Withford, M. J., Dawes, J. M., Haynes, R., & Bland-Hawthorn, J. 2008, in Society of Photo-Optical Instrumentation Engineers (SPIE) Conference Series, Vol. 7018, Society of Photo-Optical Instrumentation Engineers (SPIE) Conference Series
- Haynes et al. (2011) Haynes, D. M., Withford, M. J., Dawes, J. M., Lawrence, J. S., & Haynes, R. 2011, Mon. Not. R. astr. Soc., 414, 253
- Hill et al. (2008) Hill, G. J., Gebhardt, K., Komatsu, E., Drory, N., MacQueen, P. J., Adams, J. J., Blanc, G. A., Koehler, R., Rafal, M., Roth, M. M., Kelz, A., Gronwall, C., Ciardullo, R., & Schneider, D. P. 2008, in Panoramic Views of the Universe, ASP conference series
- Hill et al. (2010) Hill, G. J., Lee, H., Vattiat, B. L., Adams, J. J., Marshall, J. L., Drory, N., Depoy, D. L., Blanc, G., Bender, R., Booth, J. A., Chonis, T., Cornell, M. E., Gebhardt, K., Good, J., Grupp, F., Haynes, R., Kelz, A., MacQueen, P. J., Mollison, N., Murphy, J. D., Rafal, M. D., Rambold, W. N., Roth, M. M., Savage, R., & Smith, M. P. 2010, in Society of Photo-Optical Instrumentation Engineers (SPIE) Conference Series, Vol. 7735, Society of Photo-Optical Instrumentation Engineers (SPIE) Conference Series
- Kelz et al. (2006a) Kelz, A., Bauer, S. M., Grupp, F., Hill, G. J., Popow, E., Palunas, P., Roth, M. M., MacQueen, P. J., & Tripphahn, U. 2006a, in Presented at the Society of Photo-Optical Instrumentation Engineers (SPIE) Conference, Vol. 6273, Optomechanical Technologies for Astronomy. Edited by Atad-Ettedgui, Eli; Antebi, Joseph; Lemke, Dietrich. Proceedings of the SPIE, Volume 6273, pp. 62733W (2006).
- Kelz et al. (2004) Kelz, A., Verheijen, M., Roth, M. M., Laux, U., & Bauer, S.-M. 2004, in Presented at the Society of Photo-Optical Instrumentation Engineers (SPIE) Conference, Vol. 5492, Ground-based Instrumentation for Astronomy. Edited by Alan F. M. Moorwood and Iye Masanori. Proceedings of the SPIE, Volume 5492, pp. 719-730 (2004)., ed. A. F. M. Moorwood & M. Iye, 719–730
- Kelz et al. (2006b) Kelz, A., Verheijen, M. A. W., Roth, M. M., Bauer, S. M., Becker, T., Paschke, J., Popow, E., Sánchez, S. F., & Laux, U. 2006b, Publications of the Astronomical Society of the Pacific, 118, 129
- Lee et al. (2010) Lee, H., Hill, G. J., Marshall, J. L., Vattiat, B. L., & Depoy, D. L. 2010, in Society of Photo-Optical Instrumentation Engineers (SPIE) Conference Series, Vol. 7735, Society of Photo-Optical Instrumentation Engineers (SPIE) Conference Series
- MacQueen et al. (2008) MacQueen, P. J., Hill, G. J., Smith, M. P., Tufts, J. R., Barnes, S. I., Roth, M. M., Kelz, A., Adams, J. J., Blanc, G., Murphy, J. D., Altmann, W., Wesley, G. L., Segura, P. R., Good, J. M., Goertz, J. A., Edmonston, R. D., & Wilkinson, C. P. 2008, in Proc. SPIE, Vol. 7014-257, Astronomical Telescopes and Instrumentation
- Murphy et al. (2008) Murphy, J. D., MacQueen, P. J., Hill, G. J., Grupp, F., Kelz, A., Palunas, P., Roth, M., & Fry, A. 2008, in Society of Photo-Optical Instrumentation Engineers (SPIE) Conference Series, Vol. 7018, Society of Photo-Optical Instrumentation Engineers (SPIE) Conference Series
- Navarro et al. (2010) Navarro, R., Chemla, F., Bonifacio, P., Flores, H., Guinouard, I., Huet, J.-M., Puech, M., Royer, F., Pragt, J. H., Wulterkens, G., Sawyer, E. C., Caldwell, M. E., Tosh, I. A. J., Whalley, M. S., Woodhouse, G. F. W., Spanò, P., di Marcantonio, P., Andersen, M. I., Dalton, G. B., Kaper, L., & Hammer, F. 2010, in Society of Photo-Optical Instrumentation Engineers (SPIE) Conference Series, Vol. 7735, Society of Photo-Optical Instrumentation Engineers (SPIE) Conference Series
- Poppett & Allington-Smith (2010a) Poppett, C., & Allington-Smith, J. 2010a, in Society of Photo-Optical Instrumentation Engineers (SPIE) Conference Series, Vol. 7735, Society of Photo-Optical Instrumentation Engineers (SPIE) Conference Series
- Poppett & Allington-Smith (2007) Poppett, C. L., & Allington-Smith, J. R. 2007, Mon. Not. R. astr. Soc., 379, 143
- Poppett & Allington-Smith (2010b) —. 2010b, Mon. Not. R. astr. Soc., 404, 1349
- Ramsey (1988) Ramsey, L. W. 1988, in Astronomical Society of the Pacific Conference Series, Vol. 3, Fiber Optics in Astronomy, ed. S. C. Barden, 26–39
- Roth et al. (2005) Roth, M. M., Kelz, A., Fechner, T., Hahn, T., Bauer, S.-M., Becker, T., Böhm, P., Christensen, L., Dionies, F., Paschke, J., Popow, E., Wolter, D., Schmoll, J., Laux, U., & Altmann, W. 2005, Publications of the Astronomical Society of the Pacific, 117, 620
- Saunders et al. (2010) Saunders, W., Colless, M., Saunders, I., Hopkins, A., Goodwin, M., Heijmans, J., Brzeski, J., & Farrell, T. 2010, in Society of Photo-Optical Instrumentation Engineers (SPIE) Conference Series, Vol. 7735, Society of Photo-Optical Instrumentation Engineers (SPIE) Conference Series
- Schmoll et al. (1998) Schmoll, J., Popow, E., & Roth, M. M. 1998, in Astronomical Society of the Pacific Conference Series, Vol. 152, Fiber Optics in Astronomy III, ed. S. Arribas, E. Mediavilla, & F. Watson, 64–+
- Schmoll et al. (2003) Schmoll, J., Roth, M. M., & Laux, U. 2003, Astronomical Soc. of the Pacific, 115, 854
- Smith et al. (2004) Smith, G. A., Saunders, W., Bridges, T., Churilov, V., Lankshear, A., Dawson, J., Correll, D., Waller, L., Haynes, R., & Frost, G. 2004, in Society of Photo-Optical Instrumentation Engineers (SPIE) Conference Series, Vol. 5492, Society of Photo-Optical Instrumentation Engineers (SPIE) Conference Series, ed. A. F. M. Moorwood & M. Iye, 410–420
- Soukup et al. (2010) Soukup, I. M., Beno, J. H., Hayes, R. J., Heisler, J. T., Mock, J. R., Mollison, N. T., Good, J. M., Hill, G. J., Vattiat, B. L., Murphy, J. D., Anderson, S. C., Bauer, S. M., Kelz, A., Roth, M. M., & Fahrenthold, E. P. 2010, in Society of Photo-Optical Instrumentation Engineers (SPIE) Conference Series, Vol. 7735, Society of Photo-Optical Instrumentation Engineers (SPIE) Conference Series
- Tuttle et al. (2008) Tuttle, S. E., Schiminovich, D., Milliard, B., Grange, R., Martin, D. C., Rahman, S., Deharveng, J.-M., McLean, R., Tajiri, G., & Matuszewski, M. 2008, in Society of Photo-Optical Instrumentation Engineers (SPIE) Conference Series, Vol. 7014, Society of Photo-Optical Instrumentation Engineers (SPIE) Conference Series
- Wilson et al. (2010) Wilson, J. C., Hearty, F., Skrutskie, M. F., Majewski, S., Schiavon, R., Eisenstein, D., Gunn, J., Blank, B., Henderson, C., Smee, S., Barkhouser, R., Harding, A., Fitzgerald, G., Stolberg, T., Arns, J., Nelson, M., Brunner, S., Burton, A., Walker, E., Lam, C., Maseman, P., Barr, J., Leger, F., Carey, L., MacDonald, N., Horne, T., Young, E., Rieke, G., Rieke, M., O’Brien, T., Hope, S., Krakula, J., Crane, J., Zhao, B., Carr, M., Harrison, C., Stoll, R., Vernieri, M. A., Holtzman, J., Shetrone, M., Allende-Prieto, C., Johnson, J., Frinchaboy, P., Zasowski, G., Bizyaev, D., Gillespie, B., & Weinberg, D. 2010, in Society of Photo-Optical Instrumentation Engineers (SPIE) Conference Series, Vol. 7735, Society of Photo-Optical Instrumentation Engineers (SPIE) Conference Series
7. Appendix
 |
 |
 |
 |
 |
 |