Electronic structure of the kagomé staircase compounds Ni3V2O8 and Co3V2O8
Abstract
The electronic structure of the kagomé staircase compounds, Ni3V2O8 and Co3V2O8, has been investigated using soft x-ray absorption, soft x-ray emission, and resonant inelastic x-ray scattering (RIXS). Comparison between the two compounds, and with first principles band structure calculations and crystal-field multiplet models, provide unquie insight into the electronic structure of the two materials. Whereas the location of the narrow (Ni,Co) bands is predicted to be close to , we experimentally find they lie deeper in the occupied O and unoccupied V manifolds, and determine their energy via measured charge-transfer excitations. Additionally, we find evidence for a excitation at 1.5 eV in Ni3V2O8, suggesting the V states may be weakly occupied in this compound, contrary to Co3V2O8. Good agreement is found between the crystal-field excitations observed in the experiment and predicted by atomic multiplet theory.
I Introduction
The coupling between spin, charge and lattice degrees of freedom in metal oxides yields rich phase diagrams of competing phases, and has long attracted significant attention. The kagomé staircase family of vanadium oxides, M3V2O8 (M = transition metal), support complex low-temperature magnetic phase diagrams including incommensurate spin structure, and multiferroic behavior. lawes2005 ; wilson2007etc While there have been numerous studies of the cascade of low-temperature magnetic phases in these oxides, there have been relatively few investigations of their fundamental electronic structure. Recently, detailed field- and temperature-dependent optical studies on Ni3V2O8 (NVO) and Co3V2O8 (CVO) were combined with ab initio band structure calculations, and revealed the inadequacy of the local (spin) density approximation [L(S)DA] in describing the electronic structure of these materials. rai2006 ; rai2007 Moreover, inclusion of electron correlations, in the form of the LDA+U method, were not found to significantly improve agreement with experiment.
We report here a comprehensive soft x-ray spectroscopic study of the electronic structure of Ni3V2O8 and Co3V2O8 where we directly measure both the occupied and excited states through absorption, emission and resonant inelastic x-ray scattering measurements. Comparisons are made with ab initio band theory and crystal-field multiplet calculations, as well as between the two compounds, to provide a detailed description of their electronic structure.
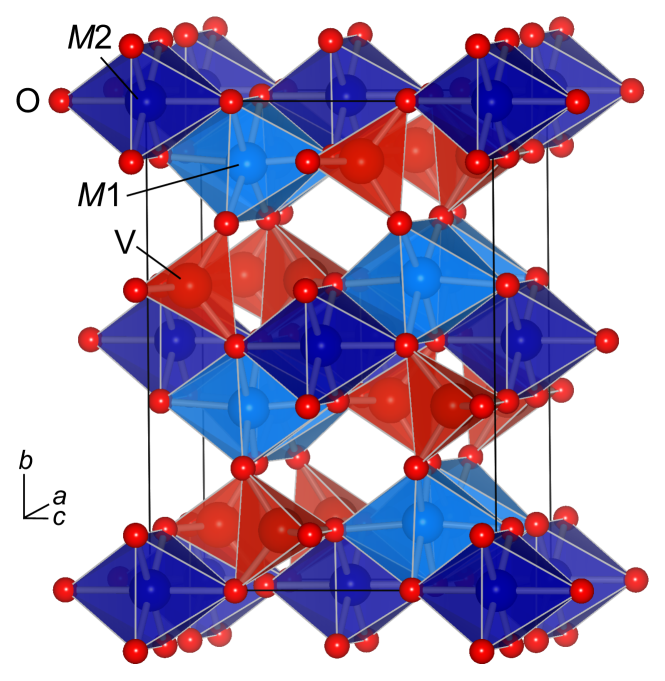
M3V2O8 (M = Co, Ni) crystallizes in the centered orthorhombic space group Cmca, consisting of edge sharing M2+O6 octahedra and V5+O4 tetrahedra (see Fig. 1). sauerbrei1973 Two inequivalent M sites exist within this structure, which are commonly referred to as cross-tie (M1, two sites per unit cell) and spine (M2, four sites per unit cell) sites. Below K, a series of ordered magnetic phases develop, which vary depending on the M ion. Generally, high-temperature incommensurate magnetic structures eventually give way to a commensurate ground state. For NVO, the broken inversion symmetry of one of the incommensurate spin structures brings the coupling of the magnetism to ferroelectricity into play, yielding coupled multiferroic behavior. lawes2005
Soft x-ray absorption spectroscopy (XAS) and soft x-ray emission spectroscopy (XES) are element-specific probes of the electronic structure of complex materials. In the XAS process, an electron is excited from a core level to the unoccupied conduction band states, subject to dipole selection rules (). stohr1992 In the case of XAS at the O -edge, this involves transitions between O to O states. The hybridization between O wavefunctions and neighboring transition metal electrons makes O -edge XAS ideal as a probe of the (hybridized) unoccupied states in transition metal oxides, allowing direct comparison with the partial density of states (PDOS) obtained from first-principles band theory. stohr1992 At the transition metal -edge (M ), the large overlap between the core hole and wavefunctions mean that atomic multiplet effects dominate these spectra, overwhelming band effects. In normal fluorescent XES, the system is initially excited in a process similar to the XAS process, but the measurement focuses on the fluorescent decay of the system (that fills the core hole). smith2003 For example, at the O -edge, one measures transitions, corresponding directly to the occupied O PDOS. However, when the initial excitation is tuned to an edge feature of the absorption spectrum, resonant effects become important, and the incident photon transfers energy and momentum to the system. Such a measurement is referred to as resonant inelastic x-ray scattering (RIXS), and the emitted photon carries information about the low-energy excitations. ament2011b As well as probing delocalized excitations (such as magnons or orbitons), RIXS can yield information on local crystal-field transitions ( transitions) and charge-transfer (CT) transitions.
II Methods
II.1 Experimental
High-quality single crystals of Ni3V2O8 and Co3V2O8 were grown using the floating zone method with an optical image furnace. balakrishnan2004 Samples were cleaved ex-situ, immediately before loading into the ultra-high vacuum chamber. Soft x-ray spectroscopy measurements were performed at room temperature (i.e. in the paramagnetic insulating phase) at Beamline 7.0.1 at the Advanced Light Source (ALS), Lawrence Berkeley National Laboratory and at Beamline X1B of the National Synchrotron Light Source, Brookhaven National Laboratory. XAS measurements were made in both total electron yield (TEY) and total fluorescent yield (TFY) modes. At the V - and O -edges, the energy resolution was set to 0.2 eV at full width at half maximum (FWHM), and the photon energy was calibrated with reference to TiO2 Ti - and O -edge spectra. At the Co and Ni -edges, the energy resolution was set to 0.2 eV and 0.3 eV respectively, and the photon energy was calibrated with CoO and NiO -edge spectra. Of the two XAS modes, TEY is more surface sensitive, having a probing depth of nm compared with the nm probing depth of TFY. In all the measurements, good correspondence was found between TEY and TFY spectra, indicating our results are representative of the bulk electronic structure. XES spectra were recorded with a Nordgren-type spectrometer, nordgren1989 with energy resolution between 0.7 and 1.0 eV (depending on the emission feature under study), and the instrument was calibrated with reference to metallic Zn, Co and Ni -edge spectra. All emission measurements were performed with a angle between incident and scattered photons, with the polarization vector parallel to the horizontal scattering plane, and with an angle of between the incident photons and the surface normal of the sample (i.e. near-grazing geometry).
II.2 Band structure calculations
For comparison with our experimental results, ab initio band structure calculations have been performed using the all electron full-potential linearized augmented plane-wave (FLAPW) method, as implemented in the Elk code. elk The deficiencies of the LSDA in describing the electronic structure of M3V2O8 have been well established through detailed FLAPW calculations; for example, CVO is predicted to be metallic. rai2006 ; rai2007 However, those authors also found that although the inclusion of static Coulomb correlations (in the form of the Hubbard parameter) produced an insulating ground state for CVO, the magnitude of the band gap was inconsistent with experiment for both NVO and CVO, and the predicted optical spectra were found to be in no better agreement with experiment. Here, we employ model calculations within the LSDA of both CVO and NVO, focusing on the bonding and hybridization characteristics, to study the trends between the two materials. The crystallographic parameters used in the calculations are those reported in the literature. sauerbrei1973 Self-consistency in the calculation was achieved on 125 k-points in the irreducible () Brillouin zone, with a cutoff for plane waves in the interstitial region of , where is the O muffin-tin radius. Muffin-tin radii of 2.2 a.u., 1.55 a.u. and 1.55 a.u. were used for M, V and O respectively.
II.3 Crystal-field multiplet calculations
RIXS at the transition-metal -edge is dominated by local crystal-field transitions between configurations. kotani2001 ; ament2011b In order to complement our RIXS measurements, crystal-field multiplet (CFM) calculations have been performed using the CTM4XAS and CTM4RIXS programs. stavitski2010 In contrast to other schemes, such as the single-impurity Anderson model (SIAM), the CFM approach takes no direct account of the ligand. For this reason, the value of the crystal-field parameter, , used in CFM calculations represents the effective separation between and states, which includes (approximately and empirically) the effects of hybridization with the ligand. However, a direct comparison between SIAM and CFM calculations at the Mn -edge of MnO has demonstrated the good correspondence between both theories, with a renormalization of the CFM value by a factor of two compared with the SIAM value. ghiringhelli2006 More obviously, a second consequence of omitting the effects of the ligand is that charge transfer excitations cannot be accounted for in the CFM model.
II.4 Data analysis
The maximum entropy (MaxEnt) approach has recently been shown to be a valuable tool in deconvoluting x-ray emission spectra, laverock2011b and is employed here in the Co and Ni -edge RIXS presented in Sections III.4 and III.5. However, owing to the favorable propagation of noise through the MaxEnt procedure, laverock2011b the MaxEnt process can also be used as an efficient noise filter. First, the raw spectrum is deconvoluted as usual, using the appropriate resolution function. Second, the deconvoluted spectrum is convolved with the same resolution function. The result of this process is a spectrum with the same resolution as the original measurement, but with an improved signal-to-noise ratio. This approach is used in the V -edge RIXS measurements of Section III.3, owing to the weak scattering intensity of these compounds at this edge.
In the RIXS measurements, the scattered photons are measured using a two-dimensional (2D) detector, in which each horizontal slice on the detector represents an equivalent intensity-energy spectrum. nordgren1989 Owing to the curvature of the 2D detector inherent in the measurement, the energy scales are slightly different, and higher fidelity spectra can be obtained by sampling the data at sub-pixel channel widths. This approach, made possible by the curvature, has been employed in all of the RIXS measurements that follow.
III Results
III.1 Band structure calculations
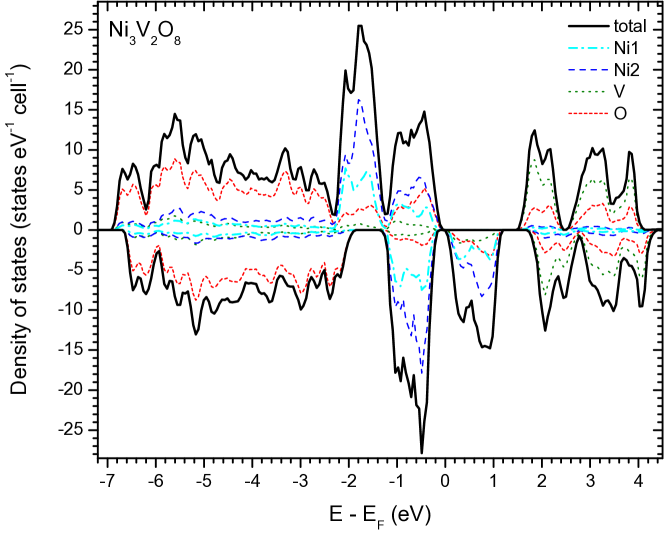
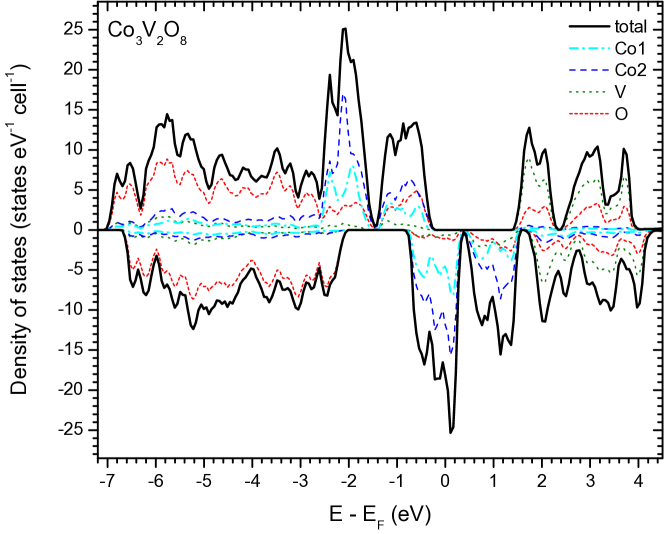
Since both NVO and CVO are local moment insulators, we compare our experimental results with ferromagnetic electronic structure calculations, since such calculations correctly predict the occupation of the (Ni and Co) states, and the insulating nature of NVO. This is in contrast to paramagnetic (degenerate spin) calculations. In fact, through comparison with the corresponding paramagnetic solutions, we find that the V and O states (including their energies and hybridization) are relatively insensitive to the magnetism for our purposes. The net effect of different magnetic orderings, such as ferrimagnetic, have been shown to have only weak effects on the overall density of states. rai2006 ; rai2007 As expected, our ferromagnetic calculations yield magnetic moments of B per Ni and B per Co, corresponding to the high-spin occupations of and respectively, and are in good agreement with the LSDA calculations of Rai et al. rai2006 ; rai2007 The calculated densities of states of the two compounds are shown in Fig. 2. For NVO, a small band gap between and indicates the insulating ground state, whereas is incorrectly placed in the middle of the manifold for CVO. With the inclusion of static electron correlations, in the form of the LSDA+U method (not investigated here), the occupied (Ni,Co) bands were found to be forced into the O manifold, whereas the empty (Ni,Co) states were pushed upwards into the V states. rai2006 ; rai2007 Whilst this correctly reproduces the insulating character of the ground state, it was pointed out by those authors that the magnitude of the band gap was substantially overestimated for reasonable values of , and that the agreement with optical spectra was worse.
III.2 O -edge XAS/XES
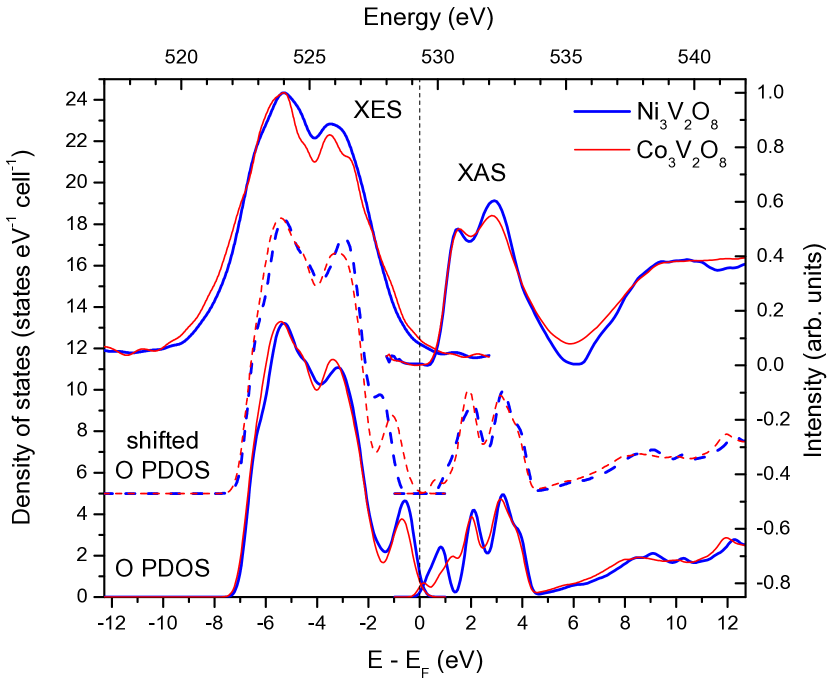
In Fig. 3, we compare our experimental XES and XAS results with the calculated band structure. As previously discussed, XES and XAS at the O -edge reflect the occupied and unoccupied O PDOS, respectively. Note that the XAS spectrum has been shifted to higher energies by 1 eV to (approximately) account for the effects of the core hole. preston2008 After this correction, the spectra are consistent with a small gap between hybridized states of 0.5 – 1.0 eV in both compounds, which is in rough agreement with the optical gap of eV. rai2006 ; rai2007 Note that pure states that do not hybridize with O will not be visible in these spectra. In general, the two compounds show remarkable similarity in their experimental spectral features, although CVO is found to have a slightly broader O bandwidth, with a tail that extends closer to . Overall, reasonably good agreement is observed between experiment and theory in the O ( to eV) and V (2 to 4 eV) manifolds. In the O manifold, two features are well resolved in the XES experiment: the lower peak at 524 eV originates from the oxygen-metal bonding states, whereas the second peak at 526 eV is due to more pure O states as well as some mixing of the O bands with the occupied (Ni,Co) states. In the XAS, two more features are visible at 530.5 eV and 532 eV, and match up well with the theoretical (tetrahedral crystal-field split) V and states respectively. Experimentally, the splitting between these states is found to be slightly larger for NVO than CVO. Finally, at higher energies, mixing between the metal and oxygen electrons yield the broad band between 536 and 545 eV. However, the (Ni,Co) states near (predicted by theory at near and eV) are not observed as distinct features in the experiment. These results indicate that the occupied (Ni,Co) states overlap in energy more with the O bands, and may account for the higher intensity of the 526 eV XES feature in NVO compared with CVO. Correspondingly, the higher intensity of the 530.5 eV XAS feature in CVO, relative to NVO, may indicate the higher number of available unoccupied Co states compared with Ni. Somewhat surprisingly, this picture bears more similarity with that of the LDA+U results, rai2006 ; rai2007 in which the (Ni,Co) states were found to be repelled far from into the O and V states. However, within the LDA+U, the electronic structure of NVO and CVO are quite dissimilar, incompatible with our spectra. In order to test what kind of correction to the theoretical band structure would be required to reproduce the experiment, we have shifted the (Ni,Co) bands away from , mimicking the qualitative trend of the LDA+U, but of much less magnitude. In this model, occupied Co and Ni states were rigidly shifted by eV and eV respectively for CVO and NVO and unoccupied states were shifted by and eV, chosen to improve the agreement with experiment. After this shift, the center of mass of the states in NVO and CVO end up being quite similar at eV ( eV) and eV ( eV) for occupied (unoccupied) states respectively. This artificial shift of the bands clearly takes no account of the evolution in hybridization or bandwidth that would accompany such a shift in energy. Nevertheless, the results, shown by the dashed lines in Fig. 3, are able to account for the differences in relative intensity of the two XES and two XAS features, as well as the increased bandwidth of CVO, and may hint towards the ultimate fate of the (Ni,Co) states.
This situation is reminiscent of that in NiO, in which the early LDA calculations yielded bands with strong Ni character near , resulting in NiO that was either metallic, mattheiss1972 or had a very narrow insulating gap, terakura1984b depending on whether spin polarization was included or not. Subsequent LDA+U calculations improved the magnitude of the insulating gap by pushing the occupied Ni states deep into the O bands. anisimov1991 However, it was not until dynamic correlations were included in the form of dynamical mean-field theory (DMFT), kunes2007 that good agreement with several spectroscopic methods was simultaneously obtained from an ab initio approach. kurmaev2008 In DMFT, the Ni states of NiO are located at an energy intermediate between the LDA and LDA+U.
III.3 V -edge RIXS
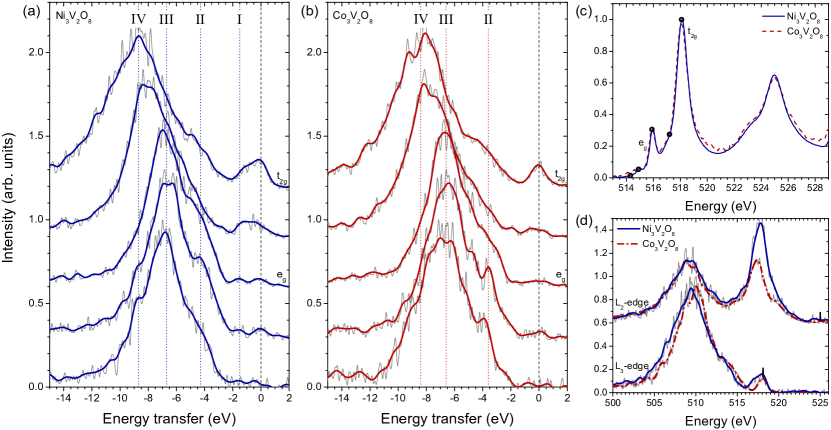
Figure 4 presents RIXS [Figs. 4(a,b)] XAS [Fig. 4(c)] and XES [Fig. 4(d)] spectra recorded near the V edge. V -edge XAS spectra are shown in Fig. 4(c) for NVO and CVO. Below eV, the double-peaked feature represents absorption from the V core level into unoccupied and states respectively. At higher energies, similar, although broader, features represent absorption from the level. These spectra are very similar for the two compounds, and are in good agreement with CFM calculations of tetrahedrally co-ordinated V5+.
V -edge RIXS spectra of NVO and CVO are shown in Figs. 4(a) and 4(b) respectively, and were recorded with the photon and spectrometer resolution both set to 0.69 eV. Since both compounds are nominally V5+ compounds, XES and RIXS are weak at this edge, and the recorded spectra suffer from an appreciable noise ratio. In order to enhance the signal-to-noise ratio, we employ the maximum entropy method as a noise filter, as discussed above. Five spectra were recorded across the V -edge of both NVO and CVO at incident energies shown in Fig. 4(c); both the raw spectra and noise filtered spectra are presented in Fig. 4. The V -edge RIXS spectra have very similar shapes for the two compounds, reflecting the similarity of the V environment of NVO and CVO, and are dominated by charge-transfer (CT) excitations between O and V sites: . For the first three excitation energies shown in Fig. 4, the features are constant on the energy transfer axis, indicating their origin as loss (CT) features. The association of these loss features with CT excitations is consistent with similar observations in other vanadium oxides. duda2004etc These spectra correspond to excitations into the unoccupied V states, and the dominant feature (III) at 6.7 eV for NVO (6.6 eV for CVO) can be associated with the separation between the center of mass of the O states and the unoccupied V band. At higher excitation energies, corresponding to excitations into the unoccupied V states, the spectra shift to deeper energies, centered at 8.7 eV (IV) for NVO (8.4 eV for CVO). The energy separation (of approximately 2 eV) between these two different CT excitations is consistent with the separation between V and features in the XAS (Fig. 3), in particular the slightly smaller splitting of these features for CVO compared with NVO.
In order to establish the origin of the V -edge spectral features, it is useful to compare them with -edge measurements. These spectra are shown in Fig. 4(d) for both CVO and NVO on an emission energy scale, alongside the resonant -edge spectra [the topmost spectra of Figs. 4(a,b)] for comparison. At the -edge, emission in the energy range 507 – 512 eV represents fluorescent emission from V-O hybridized states into the V core level, rather than CT or excitations that are present in the -edge spectra at this energy range. For CVO, there is a clear difference in the shape and center of mass of this feature between the and -edge spectra, supporting our interpretation that the -edge RIXS features (in particular, features III and IV) are associated with CT inelastic scattering processes. The same is also true of NVO, albeit less obviously owing to the precise choice of excitation energy in the NVO -edge RIXS spectrum. We also note that the NVO fluorescent feature is slightly broader than that of CVO, indicating the bandwidth of the V-O hybridized states of NVO is broader than that of CVO.
Returning to the V -edge RIXS, in both compounds an additional low-energy shoulder (II) is present at lower excitation energies, at 4.3 eV for NVO and 3.6 eV for CVO. Optical measurements have found low-energy CT excitations at 3.0 eV and 4.4 eV for NVO, interpreted as excitations into a mix of unoccupied Ni/V states and into pure V states respectively. rai2006 For CVO, these optical excitations are found to be shifted to slightly lower energies, at 2.7 eV and 4.2 eV. rai2007 Unlike optical measurements, however, RIXS is a site- and orbital-selective probe of the local transitions, and the absence of the eV feature in our data unambiguously indicates its origin is not primarily unoccupied V states. We note, however, that this energy approximately coincides with the onset of the broad CT feature, and its origin may be weak mixing of V states with (Co,Ni) states, as suggested by Rai et al. rai2006 ; rai2007 The eV feature (II) in our data, however, is in good agreement with the optical data. Here, we find it is most intense for low excitation energies, suggesting it represents an excitation into the empty V band.
Finally, we note that a small peak (I) is apparent in all the NVO spectra [Fig. 4(a)] at an energy of 1.5 eV. This feature is also present in the V -edge XES spectrum of NVO, visible as a weak peak approximately 1.5 eV offset from the incident photon energy. The energy of this feature is too low to be a CT transition, and we instead interpret it as a weak transition between partially occupied and unoccupied V states. The absence of any such peak in the CVO spectra suggests that the V ion in CVO is more strictly , whereas the extra electron in NVO at least weakly occupies the V states.
In summary, our V -edge RIXS measurements identify three CT transitions present in CVO and NVO. Transitions II and III are CT excitations into empty V states, whereas IV involves empty V states. Transitions III and IV occur at similar energies, of eV and eV respectively, for both CVO and NVO. Transition II, on the other hand, is at 3.6 eV for CVO and 4.3 eV for NVO, and may involve V states that are mixed with unoccupied (Co,Ni) states, in rough agreement with the optical measurements. rai2006 ; rai2007 In addition to these CT transitions, a excitation is also observed for NVO at 1.5 eV for all incident energies across both and edges, and is interpreted as being from occupied to unoccupied states. The absence of this excitation for CVO suggests the V states are negligibly occupied in CVO.
III.4 Co -edge RIXS
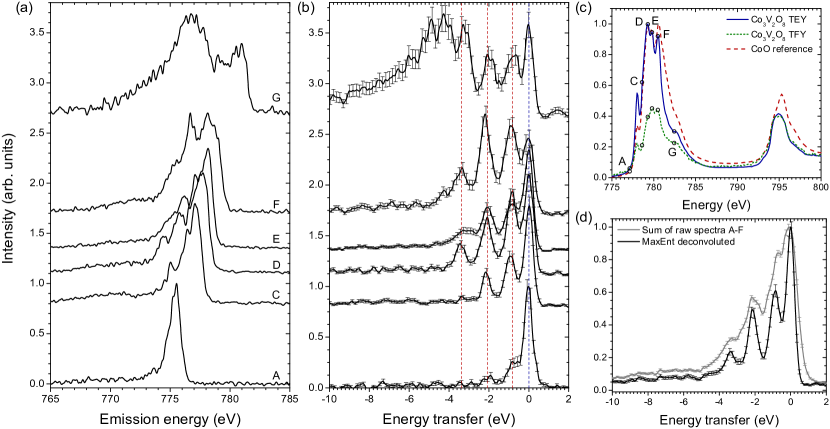
RIXS measurements at the Co -edge of CVO are shown in Figs. 5(a,b), at the excitation energies shown in the XAS spectrum of Fig. 5(c). Six spectra were recorded in the second order of diffraction with a photon and spectrometer resolution of 0.4 eV and 0.82 eV respectively, and are presented in Fig. 5(a). Owing to the higher count rate of the RIXS processes at the Co -edge compared with the V -edge in CVO, the MaxEnt procedure is used as a deconvolution tool (rather than as a noise filter). The spectra were deconvoluted using a broadening function of 0.82 eV FWHM, equivalent to the spectrometer resolution function, and are shown in Fig. 5(b). The errorbars in Fig. 5(b) are obtained through the empirical relation, (where is the intensity of the datum of the deconvoluted spectrum), determined from a detailed investigation into the propagation of noise through the MaxEnt procedure. laverock2011b
Aside from the rather intense elastic peak at 0 eV, the spectra are dominated by scattering at energy transfer of less than 5 eV, which can be attributed to excitations of the Co electrons. Above 5 eV, a weak band is present, centered at eV, which is due to Co-ligand CT transitions. Three features are clearly identifiable, even in the raw spectra [Fig. 5(a)], at (i) 0.9 eV, (ii) 2.1 eV and (iii) 3.4 eV. In the deconvoluted spectra [Figs. 5(b,d)], these features become well separated and are easily visible. A fourth feature at eV (iv) may be present for some of the higher excitation energies (e.g. spectra F-G). These spectra are reminiscent of RIXS measurements of other octahedrally-coordinated Co2+ compounds. For example, in high-resolution Co - and -edge measurements of CoO, Chiuzbǎian et al. found a total of five transitions at 0.9, 1.9, 2.3, 3.0 and 3.5 eV, although the 1.9 and 2.3 eV features were not resolvable from one another in their -edge data. chiuzbaian2008
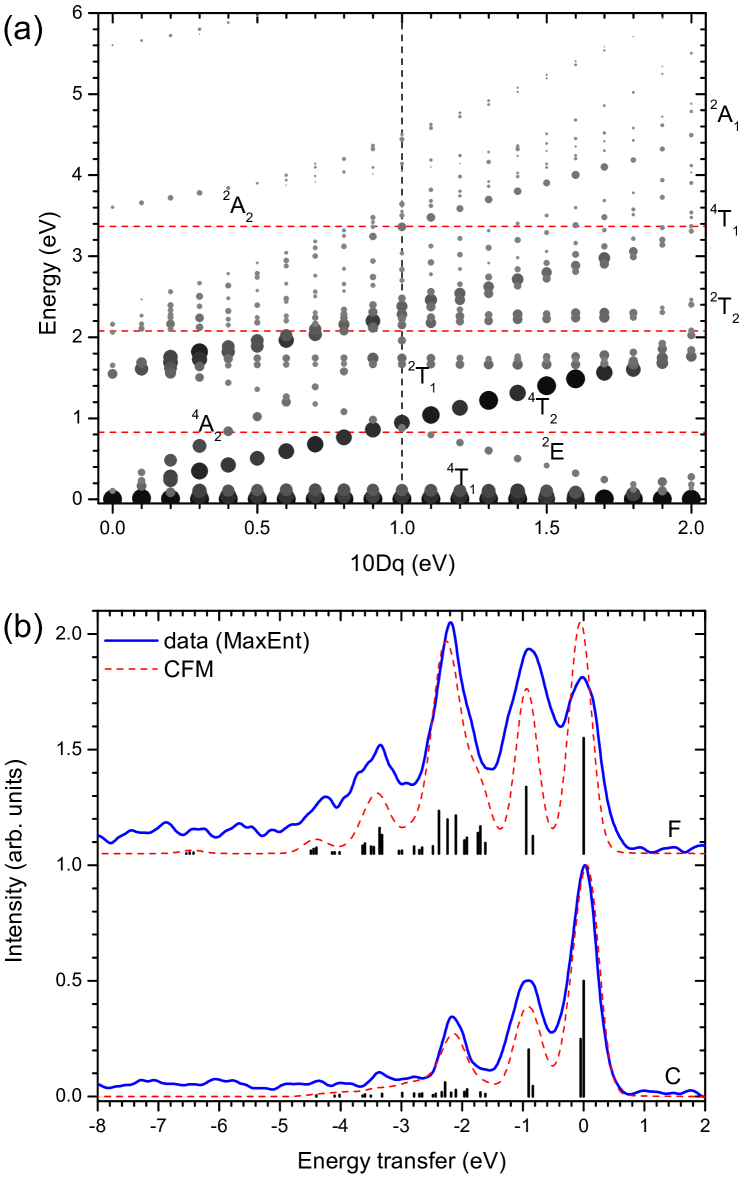
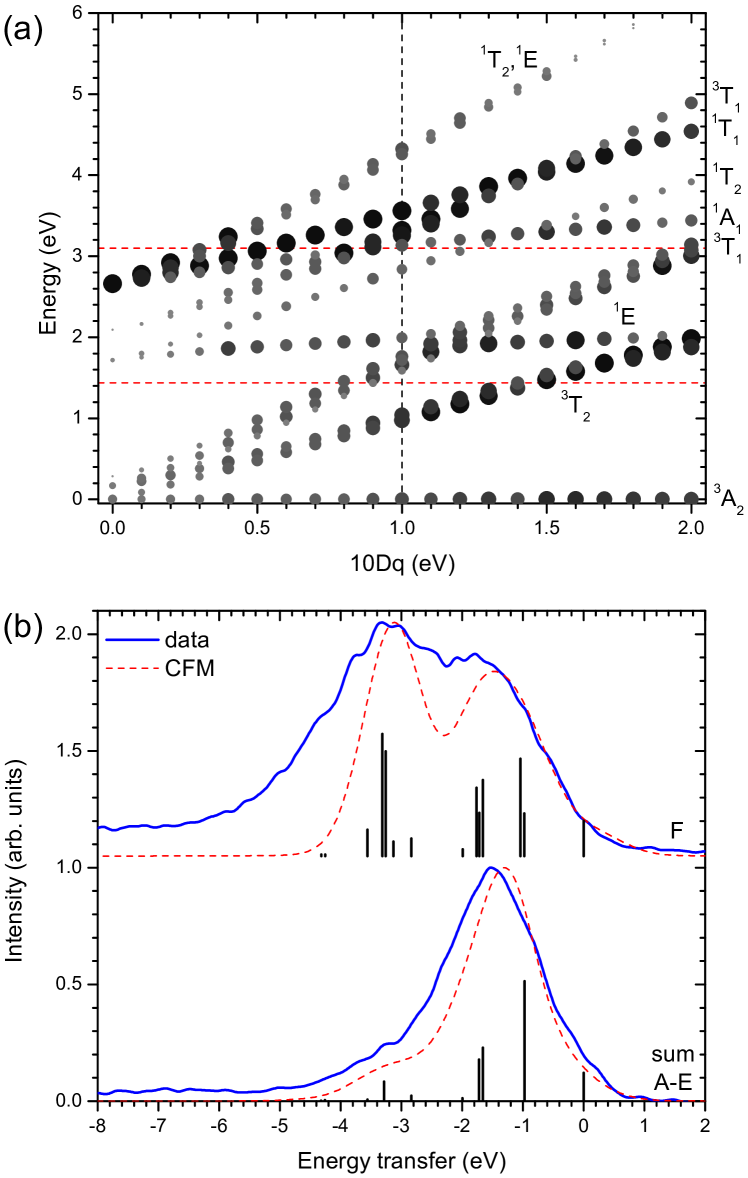
In order to understand the Co RIXS spectra more thoroughly, CFM calculations have been performed for the Co2+ ion, paying particular attention to the intensity dependence of the transitions with excitation energy. The dependence of the crystal-field excitations in symmetry as a function of the crystal-field splitting, is shown in Fig. 6(a) for a reduction of the Slater integrals to 65% of the Hartree-Fock (HF) values. In many systems, a reduction of the Slater integrals to 80% of the HF values is required to accurately describe multiplet effects in XAS and RIXS. degroot2005 Here, we find that this more modest reduction of the Slater parameters leads to transition energies that are % too large. Neither adjusting or lowering the symmetry to were able to significantly improve the agreement. Although larger reductions (to 75%) have been obtained through careful fitting of RIXS data to CFM results, ghiringhelli2006 we do not consider the current reduction as representative of this system. Rather, it is more likely that it serves to adequately counteract other more severe limitations of our model calculations. In particular, calculations in the correct (lower) symmetry may more accurately reflect the data. However, without the rich spectral structure afforded by high-resolution measurements, it is difficult to optimize the fine splittings that are present at lower symmetry; we therefore restrict our analysis to symmetry here, which at least captures the qualitative behavior well.
The energies and relative intensities in Co -edge RIXS of the respective transitions are shown in Fig. 6(a); the intensities are shown as the average intensity across the Co -edge. Spin-orbit coupling, known to be important in the CoO multiplet structure, is included, and splits the ground state into four sub-states: the symmetry labels refer to the symmetry of the states without spin-orbit coupling. For eV, the calculated transitions approximately intersect our experimental features. Moreover, these transitions have the correct intensity dependence with the excitation energy. For example, the state is the only transition predicted by the CFM calculation to weakly resonate at the onset of the XAS spectrum A. At energy C, the configuration contributes to the spectrum, providing intensity near 2 eV in our measurements. Explicit comparison between our data and the CFM model is shown in Fig. 6(b) at two representative excitation energies, demonstrating the good agreement. In these calculations, the sub-states of are populated by a thermal (Boltzmann) distribution at room temperature.
With the aid of the CFM model, we assign (i) to excitations to the state, (ii) to a combination of and (with some weak intensity from the and ), (iii) to the spin-orbit split configuration, and (iv) to the weak transition. Our assignment (which improves on an earlier preliminary one laverock2011b ) is similar to that of CoO, magnuson2002 emphasizing the local nature of the RIXS processes at the Co -edge in CVO.
III.5 Ni -edge RIXS
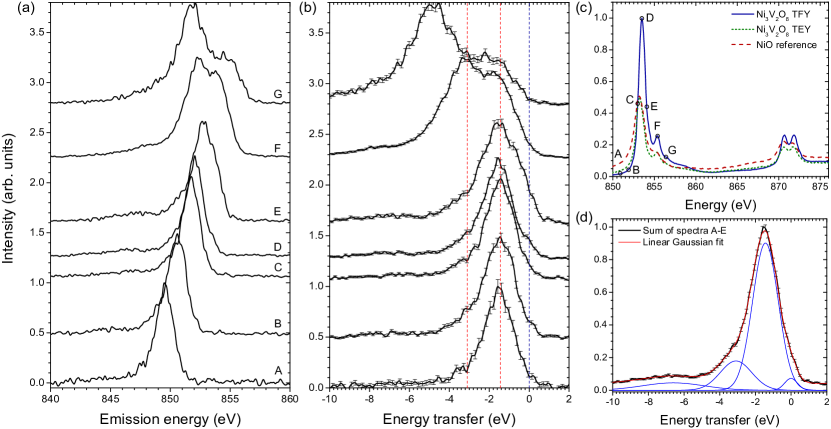
RIXS measurements across the Ni -edge of NVO are shown in Figs. 7(a,b) at the excitation energies shown in the absorption spectrum of Fig. 7(c). Although Ni XAS has been recorded, it is presented here only as a guide to the RIXS measurements, owing to the presence of elemental Ni in the upstream x-ray optics of ALS BL7. Absorption of the incident x-rays at the Ni -edge means knowledge of the incident photon flux at the sample is not reliable. The precise shape of the spectrum is therefore difficult to quantify, and no attempt is made here to interpret these results, other than to emphasize they agree with a +2 charge state for Ni in NVO. We note, however, that although XAS measurements at the Ni -edge are somewhat hampered, the effect on RIXS is only to renormalize the incident photon flux, and there will be no effect on the shape of the individual RIXS spectra.
Seven RIXS spectra were recorded in the second order of diffraction [shown in Figs. 7(a,b)] at photon and spectrometer resolutions of 0.50 and 0.97 eV respectively for spectra A-E, and at 0.8 and 1.7 eV for spectra F-G. Unlike CVO, elastically scattered light is substantially suppressed for NVO in this scattering geometry, and is barely visible in the raw data, only becoming resolvable after deconvolution (not presented here). This strong suppression of the elastic peak is in agreement with -edge RIXS measurements of NiO, ghiringhelli2009betc in which the Ni2+ ion is also octahedrally co-ordinated. Indeed, the structure of our measurements are reminiscent of both these -edge measurements, ghiringhelli2009betc as well as -edge measurements of NiO.chiuzbaian2005 The most prominent feature of the data is the strong dispersing peak in Fig. 7(a), which is found to be centered at an energy of 1.44 eV on the loss energy scale of Fig. 7(b). In Fig. 7(d), the sum of spectra A-E (which are unambiguously dominated by RIXS processes) is shown, alongside a fit to a linear combination of Gaussian functions (a total of four Gaussians were found to be required to adequately describe the data). This analysis clearly reveals the presence of the weak elastic peak, as well as the weak shoulder on the low-energy side of the main peak at 3.10 eV, which becomes strong when the excitation energy is tuned to the main satellite in the absorption spectrum (energy F). In addition, a broad band of excitations is observed centered at 6.6 eV, representing Ni-ligand charge-transfer transitions. This fit also provides information on the widths of the RIXS features. While the fitted elastic peak has a width (0.85 eV FWHM) comparable with that expected from the experimental setup ( eV), the widths of the two low-energy transitions are much broader ( eV). Indeed, the widths of the RIXS features in NVO are visibly larger than in CVO, despite the similar total experimental resolution in both measurements ( eV for CVO), an effect we return to in more detail below. Although the MaxEnt deconvolution was attempted on these data, the large intensity difference between spectral features was found to limit the power of the deconvolution, with the result that the deconvoluted spectra were only found to sharpen, without separating individual features.
In order to understand the Ni RIXS spectra more thoroughly, CFM calculations have been performed in symmetry, with a reduction of the Slater integrals to 80% of their atomic values. Owing to the resolution of these measurements, the optimization of the crystal-field parameters has not been attempted. In particular, the distortion of the local environment of the Ni ion lowers the symmetry, and therefore breaks the degeneracy of (and splits) the transitions. In practice, however, such a distortion has a weaker impact on the transition spectrum, compared with the resolution of the current measurements. In Fig. 8(a), the dependence of the CFM calculation on the crystal-field parameter, , is presented as a Tanabe-Sugano–like diagram. The relative intensity of the features predicted by the CFM model has been averaged from just above the threshold energy (approximately between points D and E) to point G in Fig. 7(c), owing to the overestimation of the intensity of the elastic feature for lower excitation energies in the CFM calculation. We note that SIAM calculations, explicitly including the effects of the ligand, account well for the weak elastic feature across the entire edge of NiO. ghiringhelli2009betc For eV, a group of transitions intersect our two experimental features. In Fig. 8(b), the experimental spectra are compared directly with the CFM calculation, after broadening with the experimental resolution function. Within the resolution of the measurement, reasonable agreement is observed; in particular, this comparison demonstrates that our 1.44 eV feature is composed of several unresolved transitions. Indeed, it is possible to see some asymmetry of this feature in the raw spectra. For example, spectrum E has a rather prominent shoulder centered at eV.
Overall, with the aid of the CFM model, we associate the 1.44 eV feature with a combination of and transitions (the transition is substantially weaker for most excitation energies). Similarly, the 3.10 eV feature is dominated by and transitions (with some weak intensity from transitions of and symmetry). Finally, we note that some evidence of the higher energy , excitations may be visible in spectrum E at an energy transfer of eV.
IV Discussion
Summarizing the experimental results, we find that the electronic structure of M3V2O8 (M = Ni, Co) differs from the predictions of the LSDA primarily in the location of the (Ni,Co) states, which are placed too close to . Rigidly moving apart the occupied and unoccupied bands by 1 – 2 eV captures some of the features of the data, and indicates the energetic location of the center of mass of these states: occupied states at eV are located near the high-energy feature of the XES spectrum, and unoccupied states at eV are close to the V states of the XAS. This trend (to push apart the occupied and unoccupied bands) is similar to the results of the LSDA+U method, although the magnitudes of the shifts employed here are much smaller. Indeed, previously published LSDA+U results yield quite different electronic structures for NVO and CVO, which is not experimentally observed. Presumably, more sophisticated calculations, such as DMFT, may be capable of more faithfully reproducing the experimental spectra, and in particular the (Ni,Co) electron energies. The V and O states, on the other hand, are relatively insensitive to the choice of M and agree reasonably well with experiment. However, there is some evidence of a V transition at 1.5 eV in NVO, which is not observed in CVO, and which may indicate some weak occupation of the V states in NVO.
Additional circumstantial evidence for this picture comes from the (Ni,Co) RIXS measurements. Charge transfer excitations between occupied O states and unoccupied (Ni,Co) states are observed centered at 6.6 eV and 6.5 eV for NVO and CVO, respectively. These are very similar in magnitude to the V CT excitations identified in V RIXS (6.6 eV and 6.7 eV), suggesting the unoccupied (Ni,Co) states and V states lie close in energy, as indicated by their centers of mass. In both cases, it is the bonding O peak (lower peak in the XES spectrum) that is eV below. Additionally, we note that V CT excitations are observed eV above the CT excitations (and in agreement with the XAS data), supporting our assignment. Finally, a third CT excitation is evident in the V RIXS at 4.3 eV (3.6 eV), and is interpreted as from the weakly-bonded O states into empty V states, in agreement with optical measurements of CT features. rai2006 ; rai2007
At the (Ni,Co) -edges, RIXS measurements reveal transitions in good agreement with crystal-field multiplet calculations with a crystal-field splitting of eV, and are strongly reminiscent of the corresponding binary oxides, NiO and CoO. The experimental features in NVO are associated with crystal-field transitions to the / (1.44 eV), / (3.1 eV) and / (4.1 eV) symmetry states respectively. For CVO, the experimental transitions are assigned to the (0.9 eV), / (2.1 eV), (3.4 eV) and (4.6 eV) excited states.
As mentioned above, there are two distinct (Ni,Co) sites within the unit cell, referred to as cross-tie (Ni1,Co1) and spine (Ni2,Co2). It has been suggested from optical measurements that the crystal-field environment may be quite different between the two sites, even in the paramagnetic phase at room temperature, leading to optical transitions separated by 0.6 eV (0.75 and 1.35 eV) and 0.9 eV (0.7 and 1.6 eV) for NVO and CVO respectively, with the separation being more severe for the Co compound. rai2006 ; rai2007 In our band structure calculations, we do not find strong differences in the crystal-field splitting between spine and cross-tie sites. Indeed, the center of mass of the and states at the two different sites agree to within 0.04 eV for both compounds (i.e. more than an order of magnitude smaller than suggested by optical measurements). Although the accuracy of the LSDA must be questioned for these compounds, this optical splitting is also not observed in our experimental RIXS spectra, which are found to agree very well with atomic multiplet theory of a single value of the crystal-field splitting. Whilst we cannot exclude such splittings of eV, splittings eV ought to be directly visible in our spectra. For both compounds, the lowest optical transitions ( eV) are close to those identified above via RIXS. However, for CVO the second optical feature (at 1.6 eV) lies in a dip in our RIXS spectra. RIXS is a direct probe of on-site electronic transitions, whereas their detection in optical measurements relies on hybridization with neighboring ligands. The absence of the optical features in RIXS measurements may indicate that their origin is more complex, possibly involving dimer excitations. Dimer excitations, involving two neighboring Co sites and of the form , are allowed in optical measurements, but are usually expected to be weaker than single-site excitations in RIXS. Their energy can be approximately estimated through the relation, which, for reasonable values of and , would make them relevant at 1 – 2 eV, approximately the right energy regime.
V Conclusion
In summary, we have measured the electronic structure of the local moment insulators M3V2O8 (M = Ni, Co) using soft x-ray absorption, emission and resonant inelastic scattering. Whereas the V and O states are in reasonable agreement with ab initio FLAPW band structure calculations, the LSDA fails to account well for the Ni and Co sites. The location of the narrow Ni and Co bands is predicted to lie close to (and, in the case of Co, cross) , which is not experimentally observed. On the other hand, features in the O -edge XES and XAS indicate the energetic location of these bands, which appear deeper into the occupied O and unoccupied V manifolds than theoretically expected. By shifting apart the occupied and unoccupied states, we estimate the centers of mass of the (Ni,Co) states. The weak occupation of the V states in NVO, absent for CVO, may hint towards the different effects of electron localization in the two materials. In that respect, and considering the unsatisfactory agreement between both LDA and LDA+U and experiment reported elsewhere both above and below , rai2006 ; rai2007 M3V2O8 would likely benefit from more thorough treatment of electron correlations, such as that afforded by DMFT (although it is acknowledged that such a treatment for these materials is not trivial). On the other hand, we find good agreement between (Ni,Co) RIXS and crystal-field multiplet theory, suggesting the crystal field is not as strongly distorted between the cross-tie and spine sites as has been previously suggested. Together, these measurements put strong constraints on the nature of any theoretical treatment of M3V2O8.
Acknowledgements
The Boston University program is supported in part by the Department of Energy under Grant No. DE-FG02-98ER45680. The ALS, Berkeley, is supported by the U.S. Department of Energy under Contract No. DE-AC02-05CH11231. The NSLS, Brookhaven, is supported by the U.S. Department of Energy under Contract No. DE-AC02-98CH10886. The research programme at the University of Warwick is supported by EPSRC, UK (EP/I007210/1).
References
- (1) G. Lawes, A. B. Harris, T. Kimura, N. Rogado, R. J. Cava, A. Aharony, O. Entin-Wohlman, T. Yildirim, M. Kenzelmann, C. Broholm and A. P. Ramirez, Phys. Rev. Lett. 95, 087205 (2005).
- (2) N. R. Wilson, O. A. Petrenko and G. Balakrishnan, J. Phys.: Condens. Matter 19, 145257 (2007); N. R. Wilson, O. A. Petrenko and L. C. Chapon, Phys. Rev. B 75, 094432 (2007); O. A. Petrenko, N. R. Wilson, G. Balakrishnan, D. McK Paul and G. J. McIntyre, Phys. Rev. B 82, 104409 (2010); N. R. Wilson, O. A. Petrenko, G. Balakrishnan, P. Manuel and B. Fåk, J. Magn. Magn. Mater. 310, 1334 (2007); G. Lawes, M. Kenzelmann and C. Broholm, J. Phys.: Condens. Matter 20, 434205 (2008); A. Kumarasiri and G. Lawes, Phys. Rev. B 84, 064447 (2011).
- (3) R. C. Rai, J. Cao, S. Brown, J. L. Musfeldt, D. Kasinathan, D. J. Singh, G. Lawes, N. Rogado, R. J. Cava and X. Wei, Phys. Rev. B 74, 235101 (2006).
- (4) R. C. Rai, J. Cao, L. I. Vergara, S. Brown, J. L. Musfeldt, D. J. Singh, G. Lawes, N. Rogado, R. J. Cava and X. Wei, Phys. Rev. B 76, 174414 (2007).
- (5) E. E. Sauerbrei, R. Faggiani and C. Calvo, Acta Cryst. B 29, 2304 (1973).
- (6) J. Stöhr, NEXAFS Spectroscopy (Springer, Berlin, 1992).
- (7) K. E. Smith, C. McGuinnes, J. E. Downes, P. J. Ryan, D. Fu, S. L. Hulbert, J. M. Honig and R. G. Egdell, Mater. Res. Soc. Symp. Proc. 755, DD1.1.1 (2003).
- (8) L. J. P. Ament, M. van Veenendaal, T. P. Devereaux, J. P. Hill and J. van den Brink, Rev. Mod. Phys. 83, 705 (2011).
- (9) G. Balakrishnan, O. A. Petrenko, M. R. Lees and D. McK Paul J. Phys.: Condens. Matter 16, L347 (2004).
- (10) J. Nordgren, G. Bray, S. Cramm, R. Nyholm, J.-E. Rubensson and N. Wassdahl, Rev. Sci. Instrum. 60, 1690 (1989).
- (11) J. K. Dewhurst, S. Sharma, L. Nordström, F. Cricchio, F. Bultmark and E. K. U. Gross, http://elk.sourceforge.net (2012).
- (12) A. Kotani and S. Shin, Rev. Mod. Phys. 73, 203 (2001).
- (13) E. Stavitski and F. M. F. de Groot, Micron 41, 687 (2010).
- (14) G. Ghiringhelli, M. Matsubara, C. Dallera, F. Fracassi, A. Tagliaferri, N. B. Brookes, A. Kotani and L. Braicovich, Phys. Rev. B 73, 035111 (2006).
- (15) J. Laverock, A. R. H. Preston, D. Newby, Jr., K. E. Smith and S. B. Dugdale, Phys. Rev. B 84, 235111 (2011).
- (16) A. R. H. Preston, B. J. Ruck, L. F. J. Piper, A. DeMasi, K. E. Smith, A. Schleife, F. Fuchs, F. Bechstedt, J. Chai and S. M. Durbin, Phys. Rev. B 78, 155114 (2008).
- (17) L. F. Mattheiss, Phys. Rev. B 5, 290 (1972).
- (18) K. Terakura, T. Oguchi, A. R. Williams and J. Kübler, Phys. Rev. B 30, 4734 (1984).
- (19) V. I. Anisimov, J. Zaanen and O. K. Andersen, Phys. Rev. B 44, 943 (1991).
- (20) J. Kuneš, V. I. Anisimov, A. V. Lukoyanov and D. Vollhardt, Phys. Rev. B 75, 165115 (2007).
- (21) E. Z. Kurmaev, R. G. Wilks, A. Moewes, L. D. Finkelstein, S. N. Shamin, and J. Kuneš, Phys. Rev. B 77, 165127 (2008).
- (22) L.-C. Duda, T. Schmitt, J. Nordgren, P. Kuiper, G. Dhalenne and A. Revcolevschi, Phys. Rev. Lett. 93, 169701 (2004); J. Laverock, A. R. H. Preston, B. Chen, J. McNulty, K. E. Smith, L. F. J. Piper, P.-A. Glans, J.-H. Guo, C. Marin, E. Janod and V. Ta Phuoc, Phys. Rev. B 84, 155103 (2011); T. Schmitt, L.-C. Duda, A. Augustsson, J.-H. Guo, J. Nordgren, J. E. Downes, C. McGuinnes, K. E. Smith, G. Dhalenne, A. Revcolevschi, M. Klemm and S. Horn, Surf. Rev. Lett. 9, 1369 (2002); T. Schmitt, L.-C. Duda, M. Matsubara, M. Mattesini, M. Klemm, A. Augustsson, J.-H. Guo, T. Uozumi, S. Horn, R. Ahuja, A. Kotani and J. Nordgren, Phys. Rev. B 69, 125103 (2004); O. Yu. Khyzhun, T. Strunskus, W. Grünert and Ch. Wöll, J. Electron Spectrosc. Relat. Phenom. 149, 45 (2005).
- (23) S. G. Chiuzbăian, T. Schmitt, M. Matsubara, A. Kotani, G. Ghiringhelli, C. Dallera, A. Tagliaferri, L. Braicovich, V. Scagnoli, N. B. Brookes, U. Staub and L. Patthey, Phys. Rev. B 78, 245102 (2008).
- (24) F. M. F. de Groot, Coord. Chem. Rev. 249, 31 (2005).
- (25) M. Magnuson, S. M. Butorin, J.-H. Guo and J. Nordgren, Phys. Rev. B 65, 205106 (2002).
- (26) G. Ghiringhelli, A. Piazzalunga, C. Dallera, T. Schmitt, V. N. Strocov, J. Schlappa, L. Patthey, X. Wang, H. Berger and M. Grioni, Phys. Rev. Lett. 102, 027401 (2009); M. Magnuson, S. M. Butorin, A. Agui and J. Nordgren, J. Phys.: Condens. Matter 14, 3669 (2002).
- (27) S. G. Chiuzbăian, G. Ghiringhelli, C. Dallera, M. Grioni, P. Amann, X. Wang, L. Braicovich and L. Patthey, Phys. Rev. Lett. 95, 197402 (2005).