Revealing Social Networks of Spammers Through Spectral Clustering
Abstract
To date, most studies on spam have focused only on the spamming phase of the spam cycle and have ignored the harvesting phase, which consists of the mass acquisition of email addresses. It has been observed that spammers conceal their identity to a lesser degree in the harvesting phase, so it may be possible to gain new insights into spammers’ behavior by studying the behavior of harvesters, which are individuals or bots that collect email addresses. In this paper, we reveal social networks of spammers by identifying communities of harvesters with high behavioral similarity using spectral clustering. The data analyzed was collected through Project Honey Pot, a distributed system for monitoring harvesting and spamming. Our main findings are (1) that most spammers either send only phishing emails or no phishing emails at all, (2) that most communities of spammers also send only phishing emails or no phishing emails at all, and (3) that several groups of spammers within communities exhibit coherent temporal behavior and have similar IP addresses. Our findings reveal some previously unknown behavior of spammers and suggest that there is indeed social structure between spammers to be discovered.
I Introduction
Previous studies on spam have mostly focused on studying its content or its source. Likewise, currently used anti-spam methods mostly involve filtering emails based on their content or by their email server IP address. More recently, there have been studies on the network-level behavior of spammers [1, 2]. However, very little attention has been devoted to studying how spammers acquire the email addresses that they send spam to, a process commonly referred to as harvesting. Harvesting is the first phase of the spam cycle; sending the spam emails to the acquired addresses is the second phase. Spammers send spam emails using spam servers, which are typically compromised computers or open proxies, both of which allow spammers to hide their identities. On the other hand, it has been observed that spammers do not make the same effort to conceal their identities during the harvesting phase [3], indicating that harvesters, which are individuals or bots that collect email addresses, are closely related to the spammers who are sending the spam emails. The harvester and spam server are the two intermediaries in the path of spam, illustrated in Fig. 1.

In this paper we try to reveal social networks of spammers by identifying communities of harvesters using data from both phases of the spam cycle. The source of the data analyzed in this paper is Project Honey Pot [4], a web-based network for monitoring harvesting and spamming activity by using trap email addresses. For every spam email received at a trap email address, the Project Honey Pot data set provides us with the IP address of the harvester that acquired the recipient’s email address in addition to the IP address of the spam server, which is contained in the header of the email. Spammers make use of both harvesters and spam servers in order to distribute emails to recipients, but the IP address of the harvester that acquired the recipient’s email address is typically unknown; it is only through Project Honey Pot that we are able to uncover it. The Project Honey Pot data set is described in detail in Section II.
Project Honey Pot happens to be an ideal data source for studying phishing emails. Phishing is an attempt to fraudulently acquire sensitive information by appearing to represent a trustworthy entity. It is impossible for a trap email address to, for example, sign up for a PayPal account, so all emails supposedly received from financial institutions can immediately be classified as phishing emails. We investigate the prevalence of phishing emails and their distribution among harvesters.
We look for community structure within the network of harvesters by partitioning harvesters into groups such that the harvesters in each group exhibit high behavioral similarity. This is a clustering problem, and we adopt a method commonly referred to as spectral clustering. Identifying community structure not only reveals groups of harvesters that have high behavioral similarity but also groups of spammers who may be socially connected, due to the close relation between harvesters and spammers. We provide an overview of spectral clustering in Section III, and we discuss our choices of behavioral similarity measures in Section IV.
Our main findings are as follows:
- 1.
-
2.
Phishers and non-phishers tend to separate into different communities when clustering based on similarity in spam server usage (Section V-A). That is, phishers tend to associate with other phishers, and non-phishers tend to associate with other non-phishers. In particular, phishers appear in small communities with strong ties, which suggests that they are sharing resources (spam servers) with other members of their community.
-
3.
Several groups of harvesters have coherent temporal behavior and similar IP addresses (Section V-B). In particular, we identify a group of ten harvesters that send extremely large amounts of spam and have the same /24 IP address prefix, which happens to be owned by a rogue Internet service provider. This indicates that these harvesters are either the same spammer or a group of spammers operating from the same physical location.
These findings suggest that spammers do indeed form social networks, and we are able to identify meaningful communities.
II Project Honey Pot
Project Honey Pot is a distributed system for monitoring harvesting and spamming activity via a network of decoy web pages with trap email addresses, known as honey pots. These trap addresses are embedded within the HTML source of a web page and are invisible to human visitors. Spammers typically acquire email addresses either by browsing web sites and looking for them or by running automated harvesting bots that scan the HTML source of web pages and collect email addresses automatically. Since the trap email addresses in the honey pots are invisible to human visitors, Project Honey Pot is trapping only the harvesting bots, and as a result, this is the only type of harvester that we investigate in this paper.
Each time a harvester visits a honey pot, the centralized Project Honey Pot server generates a unique trap email address. The harvester’s IP address is recorded and sent to the Project Honey Pot server. The email address embedded into each honey pot is unique, so a particular email address could only have been collected by the visitor to that particular honey pot. Thus, when an email is received at one of the trap addresses, we know exactly who acquired the address. These email addresses are not published anywhere besides the honey pot, so we can assume that all emails received at these addresses are spam.
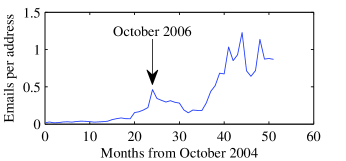
As of February 2009, over million trap email addresses, million spam servers, and harvesters have been identified by Project Honey Pot [4]. Honey pots are located in over countries. The total number of emails received at the trap email addresses monitored by Project Honey Pot is shown by month in Fig. 2, starting from its inception in October 2004. The number of emails received have been normalized by the number of addresses collected to distinguish between growth of Project Honey Pot and an increase in spam volume. October 2006 is a month of particular interest. Notice that the number of emails received in October 2006 increased significantly from September 2006 then came back down in November 2006. This observation agrees with media reports of a spam outbreak in October 2006 [5]; thus we will focus our analysis around this time. We refer readers to [3, 4] for additional details on Project Honey Pot.
In order to discover social networks of spammers, we need to associate emails to the spammers who sent them. Since we do not know the identity of the spammer who sent a particular email, we can associate the email either to the spam server that was used to send it or to the harvester that acquired the recipient’s email address. A previous study using the Project Honey Pot data set has suggested that the harvester is more likely to be associated with the spammer than the spam server [3], so we associate each email with the harvester that acquired the recipient’s email address. In particular, this is different from studies [1, 2], which did not involve harvesters and implicitly associated emails with the spam servers that were used to send them. Note that we are not assuming that the harvesters are the spammers themselves. A harvester may collect email addresses for multiple spammers, or a spammer may use multiple harvesters to collect email addresses. Thus, when we say that a particular harvester sends an email, we mean that a spammer who obtained an address collected by this harvester sends an email. To summarize, we are associating emails with harvesters and trying to discover communities of harvesters, which are closely related to communities of actual spammers.
As mentioned previously, Project Honey Pot is an ideal data source for studying phishing emails because the trap email addresses cannot sign up for accounts at financial institutions and other sources that phishing emails fraudulently represent. Note that this is not possible with legitimate email addresses, which may receive legitimate emails from these sources. Since we know that any email mentioning such a source is a phishing email, we can classify each email as phishing or non-phishing based on its content. We classify an email as phishing if its subject contains a commonly used phishing word. The list of such words was built using common phishing words such as “password” and “account” and includes those found in a study on phishing [6] and names of large financial institutions that do business on-line such as PayPal and Chase.
In general we find that a small percentage of the spam received through Project Honey Pot consists of phishing emails. As of February 2009, of the spam received was phishing spam. We define a phishing level for each harvester as the ratio of the number of phishing emails it sent to the total number of emails it sent. An interesting finding is that most harvesters either send only phishing emails or no phishing emails at all. In particular, of harvesters have a phishing level of or higher while have a phishing level of or lower, with only of harvesters in between. Thus we can label all harvesters as phishers or non-phishers based on their phishing level. We label a harvester as a phisher if its phishing level exceeds . As of February 2009, about of harvesters were labeled as phishers. We note that phishers send less emails on a per-harvester basis than non-phishers, as only of emails received were phishing emails as mentioned earlier. The labeling of harvesters as phishers or non-phishers will be used later when interpreting the clustering results.
III Overview of Spectral Clustering
In this paper, we employ spectral clustering to identify groups of harvesters with high behavioral similarity. We choose spectral clustering over other clustering techniques because of its close relation to the graph partitioning problem of minimizing the normalized cut between partitions, which is a natural choice of objective function for community detection as discussed in [7] where it is referred to as conductance.
III-A The graph partitioning problem
We represent the network of harvesters by a weighted undirected graph where is the set of vertices, representing harvesters; is the set of edges between vertices; and is the matrix of edge weights with indicating the similarity between harvesters and . The choice of similarities is discussed in Section IV. is the adjacency matrix of the graph and is also referred to in the literature as the similarity matrix or affinity matrix. is the total number of harvesters. The total weights of edges between two sets of vertices is defined by
| (1) |
and the degree of a set is defined by
| (2) |
Our objective is to find highly similar groups of vertices in the graph, which represent harvesters that behave in a similar manner. This is a graph partitioning problem, and our objective translates into minimizing similarity between groups, maximizing similarity within groups, or preferably both. Let the groups be denoted by where denotes the number of groups to partition the graph into. We represent the graph partition by an -by- partition matrix . Let where if harvester is in cluster and otherwise. We adopt the normalized cut disassociation measure proposed in [8]. One favorable property of this measure is that minimizing the normalized cut between groups simultaneously maximizes the normalized association within groups. Thus we attempt to minimize the normalized cut by maximizing the normalized association within groups, which is defined by
| (3) |
III-B Finding a near global-optimal solution
Unfortunately, maximizing is NP-complete even for as noted in [8] so we turn to an approximate method. Define the degree matrix where creates a diagonal matrix from its vector argument, and is a vector of ones. Rewrite and as
| (4) | ||||
| (5) |
We can formulate the maximization problem as follows:
| maximize | (6) | |||
| subject to | (7) | |||
| (8) |
As mentioned earlier, finding the optimal partition matrix is an NP-complete problem. A near global-optimal solution can be found by first relaxing a transformed version of into the continuous domain and finding the optimal continuous partition matrix by solving a generalized eigenvalue problem. This is followed by solving a discretization problem where the closest discrete partition matrix to the optimal continuous partition matrix is sought. We refer interested readers to [9] for details on this method, commonly referred to as spectral clustering.
III-C Choosing the number of clusters
As with most clustering algorithms, the proper choice of , the number of clusters, is unknown in spectral clustering. A useful heuristic particularly well-suited for choosing in spectral clustering problems is the eigengap heuristic. The goal is to choose such that the highest eigenvalues of the adjacency matrix are very close to but is relatively far away from . This procedure was justified in [10] and is used to choose in this paper.
IV Methodology
A social network is a social structure composed of nodes, also known as actors, and ties, which indicate the relationships between nodes. We cannot observe direct relationships between harvesters (the actors), so we use indirect relationships as the ties. We explore two types of ties in this paper. Each type of tie corresponds to a similarity measure for choosing the edge weights , which indicate the behavioral similarity between harvesters.
Note that the network may evolve over time so we need to choose a time frame for analysis that is short enough so that we should be able to see this evolution if it is present yet long enough so that we have a large enough sample for the clustering results to be meaningful. There is no clear-cut method for choosing the time frame. As a starting point, we split the data set by month and analyze each month independently.
IV-A Similarity measures
In this paper, we study two measures of behavioral similarity: similarity in spam server usage and temporal similarity. For both of these similarity measures, we create a coincidence matrix as an intermediate step to the creation of the adjacency matrix , which is discussed in Section IV-B. The choice of similarity measure is crucial because it determines the topology of the graph. Each similarity measure provides a different view of the social network, so a poor choice of similarity measure may lead to detecting no community structure if harvesters are too similar or too dissimilar.
IV-A1 Similarity in spam server usage
We note that harvesters typically send emails through multiple spam servers so common usage of spam servers is one way to link harvesters. Consider a mixed network of harvesters and spam servers described by the coincidence matrix , where is the number of harvesters and is the number of spam servers. We choose where denotes the number of emails sent by harvester using spam server , denotes the total number of emails sent (by all harvesters) through spam server , and denotes the total number of email addresses harvester has acquired. is a normalization term that is included to account for the variation in the total number of emails sent through each spam server. For example, a harvester that sent four emails through a spam server which only sent four emails total should indicate a much stronger connection to that spam server than one that sent four emails through a spam server which sent one thousand emails total. is also a normalization term to account for the variation in the number of email addresses each harvester has acquired, based on the assumption that harvesters send an equal amount of spam to each address they have acquired. We can interpret as harvester ’s percentage of usage of spam server per address it has acquired. The similarity between two harvesters and is the inner product between rows and of .
IV-A2 Temporal similarity
Harvesters that exhibit high similarity in their temporal behavior may also indicate a social connection, so another possibility for linking harvesters is by their temporal spamming behavior. We look at the timestamps of all emails sent by a particular harvester and bin them into -hour intervals, resulting in a vector indicating how many emails a harvester sent in each interval. Doing this for all of the harvesters, we get another coincidence matrix but with the columns representing time (in -hour intervals) rather than spam servers. The entries of are where denotes the number of emails sent by harvester in the th time interval, and is defined as before. Again we normalize by the number of email addresses acquired but no other normalizations are necessary because the columns represent time, which does not vary for different harvesters.
IV-B Creating the adjacency matrix
From the coincidence matrix we can obtain an unnormalized matrix of pairwise similarities . We normalize to form a normalized matrix of pairwise similarities , where is a diagonal matrix consisting of the diagonal elements of S. We can interpret this final normalization as a scaling of the edge weights between harvesters such that each harvester’s self-edge has unit weight. This ensures that each harvester is equally important because we have no prior information on the importance of a particular harvester in the network.
We create an adjacency matrix describing the graph by connecting the harvesters together according to their similarities in . There are several methods of connecting the graph, including -nearest neighbors and the fully-connected graph. We opt for the -nearest neighbor method, which translates into connecting each node to its neighbors with the highest similarities. This is the recommended choice in [10] and is less vulnerable to improper choices of the connection parameters (in this case, the value of ). It also results in a sparse adjacency matrix, which speeds up computations and makes the graph easier to visualize. Unfortunately, there are not many guidelines on how to choose . A heuristic suggested in [10], motivated by asymptotic results, is to choose . We use this choice of as a starting point and increase as necessary to avoid artificially disconnecting the graph.
V Results
We present visualizations for our clustering results from October 2006, which is a month of particular interest as noted in Section II. The visualizations were created using the force-directed layout in Cytoscape [11]. Key statistics of the clustering results over a period of one year starting in July 2006 are presented in -month intervals in tables.
V-A Similarity in spam server usage
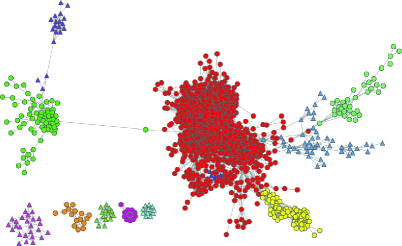
The graph created using similarity in spam server usage usually consists of a large connected component and many small connected components. The small components are easily recognized as clusters, while the large component is divided into multiple clusters. In Fig. 3 we show the social network of harvesters, connected using similarity in spam server usage, from October 2006. The shape and color of a harvester indicates the cluster it belongs to. The eigengap heuristic suggests that the large connected component should be divided into clusters, but to make the figure easier to interpret, we present a clustering result that divides the large component into clusters. We also remove connected components of less than ten harvesters. These modifications were made for visualization purposes only. In our analysis, and in particular when calculating the validation indices we present later, we use the number of clusters suggested by the eigengap heuristic and include all small connected components.
Notice that the majority of harvesters belong in a large cluster with weak ties, which is a subset of the large component. Meanwhile there exist several smaller clusters with strong ties, some of which are connected to the large cluster. Each cluster represents a community of harvesters that happen to use the same resources (spam servers), indicating that there is a strong likelihood that these harvesters are working together.
As with any clustering problem, the results need to be validated. If common usage of spam servers indeed indicates social connections between harvesters, perhaps we can find some other property that is consistent within clusters. Recall from Section II that harvesters can be classified as either phishers or non-phishers. In Fig. 4 we show the same social network colored by phishing level, as defined in Section II, rather than cluster. Note that each of the clusters consists almost entirely of phishers or almost entirely of non-phishers. In particular, phishers appear to concentrate in small clusters with strong ties. This observation is further enhanced when clustering using clusters as suggested by the eigengap heuristic. Thus, phishing level appears to be consistent within clusters. We consider a cluster as a phishing cluster if it contains more phishers than non-phishers and as a non-phishing cluster otherwise.

Using phisher or non-phisher as a label for each harvester, we compute the Rand index and adjusted Rand index [12], both commonly used indices used for clustering validation. The Rand index is a measure of agreement between clustering results and a set of class labels and is given by
| (9) |
where is the number of pairs of nodes with the same label and in the same cluster, is the number of pairs with the same label but in different clusters, is the number of pairs with different labels but in the same cluster, and is the number of pairs with different labels and in different clusters. A Rand index of indicates complete disagreement between clusters and labels, and a Rand index of indicates perfect agreement. The adjusted Rand index is corrected for chance so that the range is with an expected index of for a random clustering result.
In this clustering problem, the Rand index indicates how well phishers and non-phishers divide into phishing and non-phishing clusters, respectively. The adjusted Rand index indicates how well phishers and non-phishers divide compared to the expected division that a random clustering algorithm would produce. Both indices are shown in Table I for five months. Note that the clustering results have excellent agreement with the labels, and the agreement is much higher than expected by chance. The division between phishers and non-phishers is not perfect, as there are some phishers belonging in non-phishing clusters and vice-versa, but the high adjusted Rand index indicates that this split is highly unlikely to be due to chance alone. Hence we have found empirical evidence that phishers tend to form small communities with strong ties, suggesting that they share resources (spam servers) between members of their community.
| Year | 2006 | 2007 | |||
|---|---|---|---|---|---|
| Month | July | October | January | April | July |
| Rand index | 0.923 | 0.954 | 0.942 | 0.964 | 0.901 |
| Adj. Rand index | 0.821 | 0.871 | 0.810 | 0.809 | 0.649 |
V-B Temporal similarity
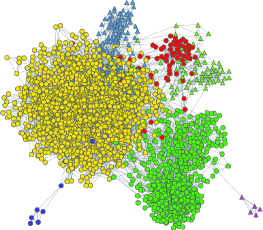
Unlike the graph created by similarity in spam server usage, the graph created by temporal similarity is usually connected. In Fig. 5 we show the social network of harvesters, connected using temporal similarity, from October 2006, where again the shape and color of a harvester indicates the cluster it belongs to. Any similarity in color with Fig. 3 is coincidental; Fig. 5 represents a completely different view of the social network and provides different insights.
Unfortunately we do not have validation for this clustering result on a global scale like we did with phishing level for similarity in spam server usage. However by looking at temporal spamming plots of the small clusters, we find some local validation. Namely, we see groups of harvesters in the same cluster with extremely coherent temporal spamming behavior. We notice that in many of these groups, the harvesters also have similar IP addresses. In particular, we notice a group of ten harvesters that have extremely coherent temporal spamming patterns and have the same /24 IP address prefix, namely 208.66.195/24, indicating that they are also in the same physical location. In Fig. 5 they can be found in the light green cluster of triangular nodes at the top right of the network.
Upon further investigation, we find that their IP addresses are in the 208.66.192/22 prefix owned by McColo Corp., a known rogue Internet service provider that acted as a gateway to spammers and was finally removed from the Internet in November 2008 [13]. This serves as further confirmation that these harvesters are likely to be socially connected. They first appeared at the end of May 2006 and have been among the heaviest harvesters, in terms of the number of emails sent, in every month since then. The average correlation coefficients between two harvesters in this group are listed in Table II for five months. Notice that their average correlation coefficients are extremely high and strongly suggest that they are working together in a coordinated matter. Also note that their behavior is still highly correlated more than a year after they first appeared. Furthermore, we discover that they have high temporal correlation in the harvesting phase; that is, they collect email addresses in a very similar manner as well. We would certainly expect them to belong to the same cluster, which agrees with the clustering results. Hence we believe that this group is either the same spammer or a community of spammers operating from the same physical location.
| Year | 2006 | 2007 | |||
|---|---|---|---|---|---|
| Month | July | October | January | April | July |
| 0.980 | 0.988 | 0.950 | 0.949 | 0.935 | |
VI Conclusions
In this paper, we revealed social networks of spammers by discovering communities of harvesters from the data collected through Project Honey Pot. Specifically, we clustered harvesters using two similarity measures reflecting their behavioral correlations. In addition, we studied the distribution of phishing emails among harvesters and among clusters. We found that harvesters typically send either only phishing emails or no phishing emails at all. Moreover, we discovered that communities of harvesters divide into communities of mostly phishers and mostly non-phishers when clustering according to similarity in spam server usage. In particular, we observed that phishers tend to form small communities with strong ties. We also discovered several groups of harvesters with extremely coherent temporal behavior and very similar IP addresses, indicating that these groups are close geographically in addition to socially.
Note that the two similarity measures we studied provided us with different views of the social networks of harvesters, and we gained useful insights from both of them. All of our findings are empirical; however, we believe that they reveal some previously unknown behavior of spammers, namely that spammers do indeed form social networks. Since harvesters are closely related to spammers, the discovered communities of harvesters are closely related to communities of spammers. If we further hypothesize that harvesters are the spammers themselves, then the discovered communities of harvesters correspond exactly to communities of spammers. Identifying communities of spammers allows us to fight spam from a new perspective—by using spammers’ social structure.
Acknowledgment
We thank Matthew Prince, Eric Langheinrich, and Lee Holloway of Unspam Technologies Inc. for providing us with the Project Honey Pot data set. We are also grateful to Nitin Nayar, John Bell, and Dr. Olaf Maennel for their assistance with the data retrieval. This research was partially supported by the Office of Naval Research grant N00014-08-1-1065 and the National Science Foundation grant CCR-0325571. Kevin Xu was supported in part by an award from the Natural Sciences and Engineering Research Council of Canada.
References
- [1] A. Ramachandran and N. Feamster, “Understanding the network-level behavior of spammers,” in Proc. ACM SIGCOMM, Sep. 2006.
- [2] Z. Duan, K. Gopalan, and X. Yuan, “Behavioral characteristics of spammers and their network reachability properties,” in Proc. Int. Conf. Communications, Jun. 2007.
- [3] M. Prince, L. Holloway, E. Langheinrich, B. M. Dahl, and A. M. Keller, “Understanding how spammers steal your e-mail address: An analysis of the first six months of data from Project Honey Pot,” in Proc. 2nd Conf. Email and Anti-Spam, Jul. 2005.
- [4] (2009) Project Honey Pot. [Online]. Available: http://www.projecthoneypot.org
- [5] M. Austin. (2006, Nov.) Spam at epic levels. ITPro. [Online]. Available: http://www.itpro.co.uk/97589/spam-at-epic-levels
- [6] M. Chandrasekaran, K. Narayanan, and S. Upadhyaya, “Phishing email detection based on structural properties,” in Proc. 9th Annual NYS Cyber Security Conf., Jun. 2006.
- [7] J. Leskovec, K. J. Lang, A. Dasgupta, and M. W. Mahoney, “Statistical properties of community structure in large social and information networks,” in 17th Int. WWW, Apr. 2008, pp. 695–704.
- [8] J. Shi and J. Malik, “Normalized cuts and image segmentation,” IEEE Trans. Pattern Anal. Mach. Intell., vol. 22, pp. 888–905, Aug. 2000.
- [9] S. Yu and J. Shi, “Multiclass spectral clustering,” in Proc. 9th IEEE Int. Conf. Computer Vision, Oct. 2003.
- [10] U. von Luxburg, “A tutorial on spectral clustering,” Statistics and Computing, vol. 17, no. 4, pp. 395–416, Aug. 2007.
- [11] P. Shannon, A. Markiel, O. Ozier, N. S. Baliga, J. T. Wang, D. Ramage, N. Amin, B. Schwikowski, and T. Ideker, “Cytoscape: A software environment for integrated models of biomolecular interaction networks,” Genome Research, vol. 13, pp. 2498–2504, Nov. 2003.
- [12] L. Hubert and P. Arabie, “Comparing partitions,” J. Classification, vol. 2, no. 1, pp. 193–218, Dec. 1985.
- [13] J. Nazario. (2008, Nov.) Third “bad ISP” disappears–McColo gone. Arbor Networks. [Online]. Available: http://asert.arbornetworks.com/2008/11/third-bad-isp-dissolves-mccolo-gone/