Studies of the Be star X Persei during a bright infrared phase
Abstract
We present multi-epoch photometric and spectroscopic near-infrared observations of the Be star X Persei in the bands covering the wavelength range 1.08 to 2.35 m. Combining results from our earlier studies with the present observations, it is shown that the equivalent widths and line fluxes of the prominent Hi and Hei lines anti-correlate with the strength of the adjacent continuum. That is, during the span of the observations, the broad band fluxes increase while the emission equivalent width values of the Hi and Hei lines decrease (the lines under consideration being the Paschen and Brackett lines of hydrogen and the 1.7002 m and 2.058 m lines of helium). Such an anti-correlation effect is not commonly observed in Be stars in the optical; in the infrared this may possibly be the first reported case of such behavior. We examine different mechanisms that could possibly cause it and suggest that it could originate due to a radiatively warped, precessing circumstellar disk. It is also shown that during the course of our studies X Per evolved to an unprecedented state of high near-IR brightness with magnitudes of 5.20, 5.05 and 4.84 respectively.
1 Introduction
X Persei/HD 24534 is a bright and variable Be star, the optical/near-IR counterpart of the low-luminosity X-ray source 4U 0352+30, which belongs to the class of Be/X-ray binaries (Braes & Miley, 1972; Roche et al., 1997). Norton et al. (1991) identified a disk loss state in X Per during 1989-1990 while Roche et al. (1993) presented evidence for a similar ‘extended low-luminosity state’ during 1974-1977. Fabregat et al. (1992) analyzed the data during the disk-less phase and estimated the spectral type to be O9.5 iiie and set an age of 6 Myr for the X Per system. The distance and rotation velocity () are estimated to be 1300 pc and 200 km s-1 respectively (Fabregat et al., 1992). The orbital period of the system was inferred from data to be 250 days while the eccentricity is 0.11 and orbital inclination angle is in between 26 and 33 degrees (Delgado-Martí et al., 2001).
Mathew et al. (2012b) did infrared photometric and spectroscopic studies of X Per during 2010 December 4 to 2011 February 8 and found the object to be in a photometrically bright state in the near-IR compared to earlier recorded values. Large optical depth effects were also observed in the Hi recombination lines as implied from the deviation of Paschen and Brackett line strengths from recombination Case B values. The object was found to show infrared excess which was modeled using a free-free excess from the disk to allow estimating a mean value of electron density, = 4 1011 cm-3, which is consistent with the values estimated in Be stars.
Because of the steady brightening trend in the bands, we continued monitoring X Per from Mt. Abu Infrared Observatory which has led to two interesting results that are reported here. First, the object is found to have evolved to an unprecedented state of high near-IR brightness. This brightening is worth reporting as it should interest other observers and encourage further monitoring of the object. The second significant result is the observation of an anti-correlation between the line equivalent widths (and also line fluxes) with the continuum brightness as measured by the IR magnitudes.
A search in the literature indicates that this type of inverse correlation is not too frequently seen in Be stars. Sigut & Patel (2013) have made a detailed study of the dependence of H equivalent widths on the V band magnitudes during long term variations of classical Be stars. They point out the examples of a few stars which have exhibited such an inverse correlation namely: 4 Her (B9e; Koubsky et al. 1997), 88 Her (B7pshe; Doazan et al. 1982), V1294 Aql (B0Ve; Horn et al. 1982) and Eta Cen (B1.5IVne; Stefl et al. 1995).
Another notable example is that of the Be star delta Sco (catalog ) in which Miroshnichenko et al. (2003) identified an anti-correlation between the H line flux and -band brightness of the star after its 2001 periastron passage, during which it transitioned from a normal B-type star to a Be star. This increase in H line flux with a fading in -band flux was explained in terms of episodes of enhanced mass loss from the star. However, this explanation was not found entirely satisfactory by Carciofi et al. (2006) for several reasons. They discussed and studied several alternative causes for the observed anti-correlation behavior but concluded by admitting that a convincing explanation could not be offered by their model (see section 4 in Carciofi et al. 2006). They suggested that rather than a static model of the Be star circumstellar disk, a complex dynamic model with a significant change in mass-loss rate and circumstellar geometry is needed to explain this phenomenon. Markova et al. (2001) identified an anti-correlation between the H equivalent width and -band magnitude of the luminous blue variable (LBV) star P Cygni. Pollmann & Bauer (2012) recently verified this anti-correlation as part of an international observing campaign where they did contemporaneous -band photometry and H equivalent width measurements. In view of the limited examples of this phenomenon seen in Be stars, it becomes necessary to report and if possible understand the observed behavior of X per.
Liu & Hang (2001) observed X Per during the bright phase in 1994-1995 and found a rise in infrared flux values with a peak in 1994 September 19 followed by the fading of light curve. The emission strength of H also increased during this time but reached the peak only after the fading in infrared light curve started. They developed an expanding ring model to explain this phenomenon in which they proposed the infrared excess and H line emission to arise from different regions of the envelope and their maximum values are reached at different evolution stage of the envelope. They also found that most of the infrared continuum emission came from within a region of 2 stellar radii while the maximum H emission arose from 6 stellar radii.
The present work presents photometry that show the progress of X Per to its present high level of brightness. Multi-epoch spectra are also presented from which we analyze the temporal evolution and dependence of the line equivalent widths and line fluxes on the near-IR magnitudes.
2 Observations & Analysis
The infrared photometric and spectroscopic observations of X Per were carried out from the 1.2-m Mt. Abu telescope, operated by the Physical Research Laboratory. Photometry in the bands was done in photometric sky conditions using the imaging mode of the Near-Infrared Imager/Spectrometer which employs a 256 256 HgCdTe NICMOS3 array. Several frames, in five dithered positions offset typically by 20 arcsec, were obtained for both the program object and a selected standard star (SAO 56762 (catalog ); spectral type A5V) in each of the filters. The procedure for the near-IR photometric observations and the subsequent reduction and analysis of data followed a standard procedure described for example in Banerjee & Ashok (2002). The log of the photometric observations and the magnitudes with the estimated errors are shown in Table 1.
The near-IR spectra were obtained at a resolution of 1000 in each of the bands using the NICMOS3 array. The spectra were extracted using IRAF and the wavelength calibration was done using a combination of OH sky lines and telluric lines that register with the stellar spectra. We have also observed the standard star SAO 56762 (catalog ) at a similar airmass to the object. The data were reduced using standard IRAF tasks and the details of the reduction procedure is given in the earlier study of X Per by Mathew et al. (2012b). The log of the spectroscopic observations is given in Table 2.
| Date | MJD | Exp.time | Photometry | ||
|---|---|---|---|---|---|
| Magnitudes | |||||
| (s) | |||||
| 2011 | |||||
| Oct. 14 | 55848.8 | (0.25,0.2,0.3) | 5.300.01 | 5.220.02 | 4.960.01 |
| Oct. 28 | 55862.8 | (0.5,0.5,0.5) | 5.370.03 | 5.180.02 | 4.980.02 |
| Oct. 29 | 55863.8 | (0.3,0.3,0.3) | 5.300.02 | 5.220.01 | 5.010.03 |
| Oct. 30 | 55864.9 | (0.5,0.4,0.4) | 5.270.03 | ||
| Oct. 31 | 55865.8 | (0.2,0.2,0.2) | 5.350.03 | 5.200.02 | 5.010.03 |
| Nov. 01 | 55866.8 | (0.2,0.2,0.2) | 5.390.02 | 5.050.06 | |
| Nov. 06 | 55871.8 | (0.3,0.3,0.3) | 5.350.02 | 5.200.02 | 4.990.02 |
| Nov. 07 | 55872.9 | (0.3,0.3,0.3) | 5.340.02 | 5.190.04 | 4.950.02 |
| Nov. 10 | 55875.9 | (0.3,0.3,0.3) | 5.340.04 | 5.190.03 | 4.960.03 |
| Nov. 11 | 55876.9 | (0.3,0.3,0.3) | 5.350.02 | 5.180.01 | 4.990.03 |
| Nov. 12 | 55877.9 | (0.25,0.25,0.25) | 5.360.01 | 5.200.03 | 5.020.04 |
| Nov. 21 | 55886.9 | (0.25,0.25,0.25) | 5.280.05 | 5.260.01 | 4.960.06 |
| Dec. 01 | 55896.9 | (0.3,0.3,0.3) | 5.340.02 | 5.240.03 | 4.990.03 |
| Dec. 13 | 55909.0 | (0.25,0.25,0.25) | 5.430.04 | 5.350.01 | 4.940.02 |
| 2012 | |||||
| Jan. 07 | 55934.0 | (0.25,0.25,0.25) | 5.280.03 | 5.190.02 | 4.960.02 |
| Feb. 28 | 55985.8 | (0.25,0.25,0.25) | 5.320.03 | 5.170.02 | 4.940.02 |
| Mar. 08 | 55994.5 | (0.25,0.25,0.25) | 5.270.03 | 5.150.03 | 4.920.03 |
| Mar. 27 | 56013.8 | (0.5,0.5,0.5) | 5.280.02 | 5.120.01 | 4.900.02 |
| Mar. 28 | 56014.8 | (0.5,0.5,0.5) | 5.240.04 | 5.100.02 | 4.930.04 |
| Apr. 06 | 56023.8 | (0.3,0.3,0.3) | 5.210.02 | 5.050.04 | 4.840.02 |

3 Results
3.1 Photometry
The photometric observations of X Per were conducted during the period 2011 October 14 to 2012 April 6. The log of the observations along with the estimated magnitudes are given in Table 1. For the construction of light curve, we have included the values obtained during 2010 December 4 – 2011 February 8; that were reported earlier in Mathew et al. (2012b). The light curve after including the whole set of observations (26 epochs) spanning a period of 489 days is shown in Figure 1. It can be seen that the latest magnitudes are 5.21, 5.05 and 4.84, obtained on 2012 April 6. The 2MASS magnitudes of the object are 6.149, 6.073, 5.920 and hence the present estimates are about 1 magnitude brighter than these values. Telting et al. (1998) have compiled the most comprehensive set of magnitudes of X Per for a period of 25 years. The brightest magnitudes reported by them are 5.44, 5.41 and 5.29 respectively, which was recorded during 1994 September 16 – 20, and is shown as a dashed line in Figure 1. Liu & Hang (2001) also reported a bright state in X Per with magnitudes of 5.32, 5.26, 5.19 on 1994 September 19. The values presented in this paper are 0.2 – 0.3 mag brighter than these values and hence show that X Per is at an all-time bright state in the near-IR.
In order to see whether a contemporaneous brightening event occurs in the optical also, we have looked for the -band CCD data of X Per in the AAVSO database. We could locate only 7 sets of photoelectric/CCD observations during the period of our IR observations; though several visual estimates were available these were not considered due to the lack of accuracy. The light curve is plotted and is shown in the bottom panel of Figure 1. The -band light curve also brightened up and the magnitude changed from 6.338, when observed on 2010 December 10, to = 6.114 on 2012 March 12. It can be seen that the magnitude change in -band is 0.22, roughly similar to those in the , , bands which are 0.29, 0.32, 0.25 respectively. The magnitude excess in all the bands are similar even though we expected a lesser value in if the excess emission is purely from the circumstellar disk.

X Per belongs to the class of persistent X-ray binaries where the neutron star does not pass through the circumstellar disk during its periastron passage due to the low value of eccentricity. Hence one does not expect normal Type I outburst in these systems. But there are reports of feeble X-ray outbursts in X Per by Lutovinov, Tsygankov, & Chernyakova (2012) from a continuous monitoring during 2001-2011 using the data from , and observatories. Using simultaneous -band magnitudes from AAVSO database along with the X-ray data, they did not find any significant correlation between the X-ray and optical light curve behavior. The X-ray light curve of the system in 15 – 50 keV energy band is shown in Figure 2. The epochs corresponding to our infrared photometric observations are marked in the figure. No detectable flare in X-rays is visible during the period of infrared observations i.e., from 2010 December 4 to 2012 April 6. The orbital period of the system is 250 days (Delgado-Martí et al., 2001) and hence the present set of observations spanning 489 days cover almost two orbits. Hence it can be concluded that the neutron star does not influence or have any significant role in the observed behavior reported here. In the case of X Per, no disk loss event was reported after 1989. If the present brightening is due to the deposition of material in the disk, then it could lead to the expansion of the disk which may result in a future X-ray outburst event. However, at present the possibility of such an outburst in X Per appears to be low (Reig & Roche, 1999).
3.2 Spectroscopy
In the present study we obtained spectra for 27 nights between 2011 October 14 to 2012 April 5 (from here on referred to as epoch 2). The log of the observations for these data is shown in Table 2. To prevent over-crowding in the display of these spectra, we present in Figures 3, 4 and 5 the , and spectra respectively for 10 selected dates which are reasonably equi-spaced over the observation span of epoch 2 and give a good idea of the spectral evolution. The spectra of X Per are dominated by the recombination emission lines of hydrogen and helium. The prominent recombination lines present in the spectra are Pa 1.2818 m, Pa 1.0938 m lines in Paschen series, Br 2.1656 m and Brackett 10 – 18 lines in Brackett series. Of the helium lines Hei 1.0830 m, 1.7002 m and 2.058 m are prominent which are present in , and band spectra respectively. The Oi 1.1287 m line is also seen whose strength is known to be influenced by the Lyman fluorescence process (e.g., Mathew et al. 2012a). The equivalent widths of the prominent lines are given in Table 2 – the typical error in the measurement of the equivalent width values is 10 %.


The spectra of X Per obtained earlier for 7 nights during 2010 December 05 – 2011 February 8 (epoch 1) were analyzed and discussed in Mathew et al. (2012b). We have combined equivalent widths of this epoch 1 data-set with those of the present data to illustrate how the equivalent width values evolve with time. The equivalent width values obtained on 2011 January 28 are also added in Table 2 as a sample representative of the previous set of observations. The evolution of equivalent width values of Paschen , Brackett , Brackett 10 – 14, Hei 1.7002 m, 2.058 m emission lines are shown in Figure 6. It can be seen that the EW values are reduced in the present set of observations compared to the previous one. In the present set of observations also a decreasing trend is visible which is not as drastic in comparison with the previous data-set. The trend is visible homogeneously in all the above mentioned emission lines. What is clearly established in Figure 6 is that the equivalent widths of the lines have systematically decreased with time whereas the broad band continuum fluxes (shown in Figure 1) have correspondingly increased during the same time.
We also consider how the line luminosities or line fluxes evolve with time ( we use the terms line luminosity and line flux interchangeably). To determine the line fluxes we first flux calibrate the spectra with the corresponding broad band magnitudes which were measured simultaneously on the same night along with the spectra - these photometric magnitudes are listed in Table 1. Line fluxes were then extracted from these flux calibrated spectra in a straight-forward way using IRAF and these are shown in Figure 7. As seen in the figure, the emission line flux values of all the prominent lines decrease with time even as the continuum flux increases during the same time. This decrease in the line fluxes is a genuine decrease and shows that the anti-correlation of the equivalent widths with IR magnitudes does not arise from a “flux dilution” effect. Flux dilution, also termed the “veiling effect”, occurs whenever there is a source of continuum emission in addition to the stellar photospheric emission and/or disk emission. The addition of a new continuum source will dampen the flux of an emission or absorption line, decreasing its equivalent width without actually affecting the line flux. From the mathematical definition of the equivalent width it can easily be seen that by increasing the continuum flux Fc by a factor of , while keeping the line flux Fline constant, decreases the equivalent width by 1/. Examples of the effect of “flux dilution” on photospheric absorption lines may be seen for example in the papers by Aragona et al. (2010) and Frémat et al. (2006).
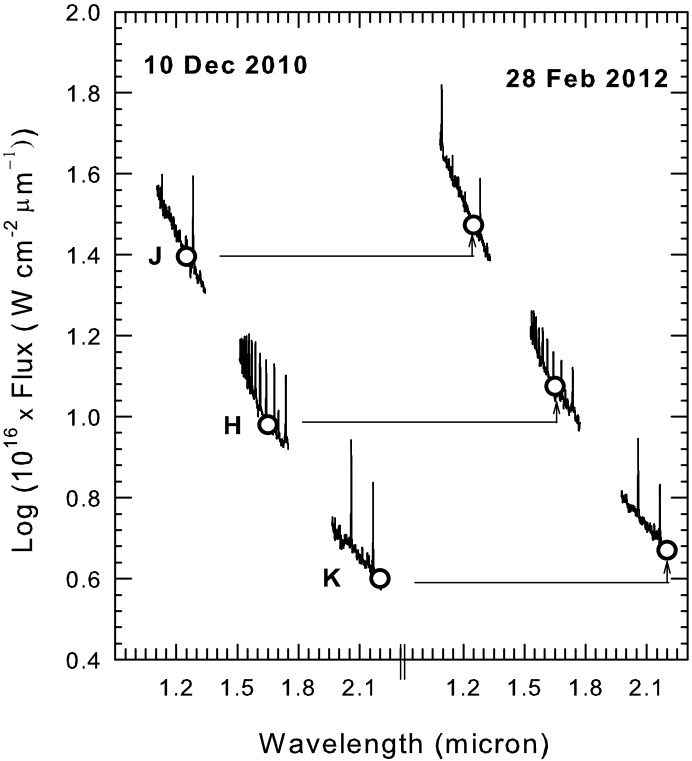
For ease of comparison and visualization, of the evolution of the EW of the lines between epochs 1 and 2, we have plotted in Figure 8 two representative spectra of these respective epochs. These are for 2010 December 10 and 2012 February 28; the spectra are shown flux calibrated using the corresponding broad band magnitudes dereddened using = 0.39 (these are shown as circles in Figure 8). The arrowed lines between the spectra show the slight increase in the continuum fluxes between 2010 to 2012, whereas the spectra clearly show the anti-correlation in the line strengths which are seen to decrease from 2010 to 2012.
To summarize, the continuum flux values are found to increase (equivalently the J,H,K magnitudes are found to decrease) while the equivalent width/line flux values are reduced with time in X per during the period of observations. Hence it can be seen that an inverse correlation exists between the line equivalent widths (or line fluxes) and the continuum emission. We examine possible physical mechanisms, some of which are suggested in the literature (for e.g. Sigut & Patel 2013), that could be responsible for producing such a trend.
3.3 Discussion
We have considered three possible mechanisms to explain the observed anti-correlated behavior of the line and continuum strengths, viz., (i) the recently proposed model by Sigut & Patel (2013) to account for such an effect (ii) episodes of increased mass loss and (iii) the presence of a radiatively warped precessing disk.
Sigut & Patel (2013) have calculated model H equivalent widths and UBV magnitudes for Be star disk models that grow in size and/or density with time. They show that these simple models are consistent with the known Be star classes of positive and inverse correlations between long-term variations in H and V magnitude as identified by Harmanec (1983). They show that the inverse correlation between H and V magnitudes is expected at high inclination angles due to the changing scale height of the growing disks. In their model, for Be stars observed at an inclination angle less than crit, disk formation should result in a positive correlation, while Be stars observed at greater than crit should exhibit an inverse correlation. The value of crit is likely to depend on several parameters and hence is difficult to assess accurately but a likely value is icrit 75∘. The authors however explain why this value may be only suggestive and should not be over-interpreted. In the case of X Per we likely have a low inclination system with = 26∘ – 33∘. This is also the case with delta Sco ( = 30.2∘; Meilland et al. 2011). So there may be some difficulty in reconciling the behavior of these two stars within the above model of Sigut & Patel (2013). However, the possibility exists that the infrared fluxes may be more sensitive to the inverse correlation at lower inclinations since the vertical extent of the disk could be larger at IR wavelengths.
We next examine whether the observed anti-correlation might be explained by episodes of increased mass loss. Such mass loss would increase either the the electron density in the disk or the volume of emitting gas - in either case the continuum and line emission may be expected to increase. This is because the free-free (f-f) emission from the disk will increase and in turn enhance the continuum; independently and simultaneously the strength of the lines arising from the recombination process will also increase. This follows from the dependence of the continuum flux in the f-f emission and the line flux in the recombination process: in both processes the fluxes are proportional to nV, where ne is the electron density and V is the volume of the emitting gas (Banerjee, Janardhan, & Ashok, 2001; Storey & Hummer, 1995). The possibility for the strength of certain lines to decrease - in this particular scenario - is if the injection of matter increases the disk density to such levels that these particular lines become optically thick. In which case the strength of the lines may decrease - but a rigorous radiative transfer analysis must be done to establish this which takes into account the interplay between optical depth at line-center () and the line strength. From an observational point of view it is worth pointing out that in several Be stars including X Per, many of the near-IR lines are indeed optically thick in the Pa, Br, Pf and Hu series (Mathew et al., 2012b; Clark & Steele, 2000; Steele & Clark, 2001; Granada, Arias, & Cidale, 2010) - especially the higher lines of the series.
In the case of delta Sco, Miroshnichenko et al. (2003) noted a similar anti-correlation between the visual and Balmer H fluxes in the earlier evolution of the delta Sco disk and suggested that it might be explained by episodes of increased mass loss. Their reasoning was however based on a slightly different approach than that offered above. From our point of view, one of the arguments against the above mechanism is that the brightening of the continuum, by injection of matter into the disk, should be seen preferentially at the longer IR wavelengths, if caused by f-f flux increase, rather than in the visual. This is expected because of the nature of the dependence of the f-f emission with wavelength. However, in the present case the light curves in Figure 1 show a similar brightening of about 0.2 to 0.3 mag in each of the , , and bands. Such a variation could arise from a geometric effect created by the formation or removal of an obscuration of the central star’s light. A radiatively warped disk is another possibility which could cause such a variation as suggested by Carciofi et al. (2006) in the case of delta Sco.
Porter (1998) has shown how the radiation field of the central star can warp the decretion disk of Be stars. Martin (2009)111http://stsci.academia.edu/RebeccaGMartin/Papers/1244536/ also finds that Be star disks can be unstable to radiation warping. If the density in the innermost parts of the disk is higher than 10-11 g cm-3 then such parts of the disk are optically thick and radiation driven warping can occur. Geometrically the warp causes the disk to be effectively bent away from the original planar configuration (Pringle, 1996; Porter, 1997). The effect of such a warp would place material at higher latitudes and increase the area of the stellar disk that could be blocked by the disk material along the line of sight. This blockage, because of Thompson scattering of the incident continuum radiation, would be expected to be more pronounced in low inclination systems like X Per ( = 26∘ – 33∘) or delta Sco ( = 30.2∘; Meilland et al. 2011). The continuum flux would hence decrease. However, since the warping causes the disk surface to curve out and thereby offer a larger cross-sectional area to the ionizing flux of the central star, more material can be photo-ionized which could lead to an increase in the strengths of the lines. Thus, by our reasoning, the current bright state is because the warped portion of the disk is presently not in the line of sight (l.o.s). But if this warped disk precesses, then the warped segment should come into the l.o.s in the future and a decline in the continuum should be seen then. It needs to be seen whether this happens.
From an observational point of view, is there evidence for warped precessing disks around Be stars? Martin (2009) cites two possible examples. First is the study of Larionov, Lyuty, & Zaitseva (2001) who observed the Be/X-ray binary A0535+26 (catalog ) and found a beat frequency of the orbital period of the neutron star and the precession period that could be due to a warped decretion disk around the Be star. Second, Negueruela et al. (2001) observed the Be/X-ray transient 4U0115+63/V635 Cas (catalog ) in the optical, infrared and X-ray regimes and found that the disk becomes unstable to, what they assumed to be radiative warping, and then tilts and starts precessing.
To summarize, we have discussed the role of different mechanisms in explaining the observed dependence of the near-IR line strengths on the near-IR magnitudes in X Per. The observed anti-correlation is not easily explained. We favor the presence of a radiation driven warped circumstellar disk to explain the observed behavior but it is possible that the underlying mechanism originates from a different cause.
References
- Aragona et al. (2010) Aragona, C., McSwain, M. V., & De Becker, M. 2010, ApJ, 724, 306
- Banerjee, Janardhan, & Ashok (2001) Banerjee, D. P. K., Janardhan, P., & Ashok, N. M. 2001, A&A, 380, L13
- Banerjee & Ashok (2002) Banerjee, D. P. K., & Ashok, N. M. 2002, A&A, 395, 161
- Braes & Miley (1972) Braes, L. L. E. & Miley, G. K. 1972, Nature, 235, 273
- Carciofi et al. (2006) Carciofi, A. C. et al., 2006, ApJ, 652, 1617
- Clark & Steele (2000) Clark, J. S., & Steele, I. A., 2000, A&AS, 141, 65
- Delgado-Martí et al. (2001) Delgado-Martí, H., Levine, A. M., Pfahl, E., & Rappaport, S. A. 2001, ApJ, 546, 455
- Doazan et al. (1982) Doazan, V. et al., 1982, A&A, 115, 138
- Fabregat et al. (1992) Fabregat, J. et al., 1992, A&A, 259, 522
- Frémat et al. (2006) Frémat, Y. et al., 2006, A&A, 451, 1053
- Granada, Arias, & Cidale (2010) Granada, A., Arias, M. L., & Cidale, L. S. 2010, AJ, 139, 1983
- Harmanec (1983) Harmanec, P. 1983, Hvar Observatory Bulletin, 7, 55
- Horn et al. (1982) Horn, J. et al., 1982, Bull. Astron. Inst. Czech., 33, 308
- Koubsky et al. (1997) Koubsky, P. et al., 1997, A&A, 328, 551
- Larionov, Lyuty, & Zaitseva (2001) Larionov, V., Lyuty, V. M., & Zaitseva, G. V. 2001, A&A, 378, 837
- Liu & Hang (2001) Liu, Q.-Z., & Hang, H.-R. 2001, Ap&SS, 275, 401
- Lutovinov, Tsygankov, & Chernyakova (2012) Lutovinov, A., Tsygankov, S., & Chernyakova, M. 2012, MNRAS, 423, 1978
- Markova et al. (2001) Markova, N., Scuderi, S., de Groot, M., Markov, H., & Panagia, N. 2001, A&A, 366, 935
- Martin (2009) Martin, R. G. 2009, PhD thesis, Jesus College & IoA, Univ. of Cambridge
- Mathew et al. (2012a) Mathew, B., Banerjee, D. P. K., Subramaniam, A., & Ashok, N. M. 2012a, ApJ, 753, 13
- Mathew et al. (2012b) Mathew, B., Banerjee, D. P. K., Naik, S., & Ashok, N. M. 2012b, MNRAS, 423, 2486
- Meilland et al. (2011) Meilland, A. et al. 2011, A&A, 532A, 80
- Miroshnichenko et al. (2003) Miroshnichenko, A. S. et al., 2003, A&A, 408, 305
- Negueruela et al. (2001) Negueruela, I. et al., 2001, A&A, 369, 117
- Norton et al. (1991) Norton, A. J. et al., 1991, MNRAS, 253, 579
- Pollmann & Bauer (2012) Pollmann, E., & Bauer, T. 2012, JAVSO, 156
- Porter (1997) Porter, J. M. 1997, A&A, 324, 597
- Porter (1998) Porter, J. M. 1998, A&A, 336, 966
- Pringle (1996) Pringle, J. E. 1996, MNRAS, 281, 357
- Reig & Roche (1999) Reig, P., & Roche, P. 1999, MNRAS, 306, 100
- Roche et al. (1993) Roche, P. et al., 1993, A&A, 270, 122
- Roche et al. (1997) Roche, P. et al., 1997, A&A, 322, 139
- Sigut & Patel (2013) Sigut, T. A. A., & Patel, P. 2013, ApJ, 765, 41
- Steele & Clark (2001) Steele, I. A., & Clark, J. S. 2001, A&A, 371, 643
- Stefl et al. (1995) Stefl, S., Baade, D., Harmanec, P., & Balona, L. A. 1995, A&A, 294, 135
- Storey & Hummer (1995) Storey, P. J., & Hummer, D. G. 1995, MNRAS, 272, 41
- Telting et al. (1998) Telting, J. H. et al., 1998, MNRAS, 296, 785
| Date | Exp. time (s) | Pa | Pa | Br10 | Hei | Br11 | Br12 | Br13 | Br14 | Br | Hei |
|---|---|---|---|---|---|---|---|---|---|---|---|
| 1.70 m | 2.058 m | ||||||||||
| 2011 | |||||||||||
| Jan. 28aaData taken from Mathew et al. (2012b). See section 3.2 for more details. | (40, 40, 40) | 12.8 | 17.0 | 13.1 | 4.1 | 10.8 | 12.1 | 10.2 | 10.8 | 16.2 | 20.6 |
| Oct. 14 | (60, 60, 60) | 9.1 | 15.3 | 1.5 | 8.5 | 9.0 | 7.9 | 7.7 | 10.4 | 16.6 | |
| Oct. 28 | (60, 60, 60) | 11.2 | 8.0 | 1.6 | 8.6 | 8.1 | 7.3 | 7.8 | 12.6 | 16.2 | |
| Oct. 29 | (90, 90, 90) | 9.0 | 12.9 | 2.2 | 9.3 | 8.6 | 8.2 | 9.4 | 12.1 | 16.7 | |
| Oct. 30 | (90, 90, 90) | 9.6 | 7.1 | 2.4 | 8.6 | 8.2 | 6.9 | 8.3 | 12.7 | 18.9 | |
| Oct. 31 | (60, 60, 60) | 12.3 | 13.8 | 2.6 | 7.9 | 7.5 | 7.9 | 11.5 | 16.4 | ||
| Nov. 01 | (60, 60, 60) | 8.9 | 7.4 | 2.3 | 9.0 | 6.9 | 7.2 | 8.5 | 21.4 | 15.6 | |
| Nov. 05 | (60, 60, 60) | 11.0 | 8.4 | 2.5 | 8.1 | 7.9 | 8.0 | 7.6 | 10.4 | 15.9 | |
| Nov. 06 | (60, 60, 60) | 8.1 | 2.1 | 9.0 | 9.7 | 8.3 | 9.2 | 10.8 | 16.1 | ||
| Nov. 07 | (60, 60, 60) | 10.5 | 15.3 | 8.8 | 2.4 | 7.9 | 7.9 | 7.2 | 7.6 | 11.2 | 17.9 |
| Nov. 08 | (60, 60, 60) | 8.7 | 14.8 | 3.8 | 8.0 | 7.5 | 7.9 | 9.2 | 11.5 | 15.6 | |
| Nov. 09 | (45, 50, 60) | 8.9 | 16.7 | 1.9 | 7.5 | 7.5 | 6.8 | 8.5 | 10.3 | 16.5 | |
| Nov. 10 | (60, 60, 60) | 9.2 | 12.8 | 7.8 | 1.9 | 7.4 | 8.7 | 7.7 | 8.6 | 11.1 | 15.1 |
| Nov. 11 | (60, 60, 60) | 9.2 | 13.9 | 3.3 | 8.3 | 7.7 | 6.8 | 9.1 | 11.7 | 16.2 | |
| Nov. 12 | (60, 60, 60) | 11.3 | 14.4 | 6.8 | 1.9 | 8.5 | 8.4 | 7.8 | 8.5 | 10.8 | 16.0 |
| Nov. 13 | (60, 60, 80) | 7.9 | 12.7 | 7.3 | 2.6 | 8.2 | 7.4 | 8.1 | 7.8 | 10.5 | 15.2 |
| Nov. 14 | (120, 60, 90) | 8.8 | 15.1 | 8.0 | 2.8 | 8.4 | 6.7 | 6.1 | 7.3 | 10.6 | 16.1 |
| Nov. 19 | (60, 90, 120) | 8.9 | 16.5 | 8.3 | 2.3 | 7.7 | 8.1 | 6.1 | 8.7 | 10.9 | 17.7 |
| Nov. 21 | (60, 60, 60) | 9.3 | 10.2 | 1.5 | 8.4 | 8.8 | 6.5 | 8.2 | 10.8 | 15.7 | |
| Dec. 01 | (60, 60, 60) | 8.6 | 7.6 | 2.1 | 8.5 | 8.4 | 6.8 | 8.4 | 10.7 | 15.9 | |
| Dec. 02 | (60, 60, 60) | 8.0 | 8.0 | 1.7 | 9.2 | 8.4 | 7.3 | 7.6 | 11.2 | 16.6 | |
| Dec. 12 | (40, 40, 60) | 9.8 | 7.2 | 3.5 | 8.4 | 7.9 | 6.6 | 7.7 | 10.5 | 16.3 | |
| 2012 | |||||||||||
| Jan. 07 | (60, 60, 60) | 9.1 | 7.6 | 1.6 | 7.9 | 7.7 | 7.6 | 7.7 | 11.0 | 15.7 | |
| Feb. 28 | (60, 60, 60) | 8.9 | 15.2 | 6.3 | 1.7 | 7.8 | 7.0 | 5.5 | 7.1 | 10.4 | 16.3 |
| Mar. 07 | (60, 60, 60) | 10.2 | 6.4 | 1.8 | 7.9 | 8.3 | 6.2 | 8.2 | 9.5 | 13.9 | |
| Mar. 27 | (60, 60, –) | 11.0 | 15.7 | 7.3 | 1.7 | 7.3 | 7.4 | 7.2 | 7.2 | ||
| Mar. 29 | (60, 60, 60) | 10.7 | 6.3 | 2.0 | 6.8 | 7.6 | 5.6 | 7.8 | 10.2 | 15.2 | |
| Apr. 05 | (60, 60, 60) | 10.2 | 8.2 | 2.4 | 7.6 | 7.0 | 5.0 | 6.5 | 10.5 | 15.1 |