A CO =3-2 map of M 51 with HARP-B: Radial properties of the spiral structure
Abstract
We present the first complete CO =3-2 map of the nearby grand-design spiral galaxy M 51 (NGC 5194), at a spatial resolution of 600 pc, obtained with the HARP-B instrument on the James Clerk Maxwell Telescope. The map covers the entire optical galaxy disk and out to the companion NGC 5195, with CO =3-2 emission detected over an area of 9′6′(2114 kpc). We describe the CO =3-2 integrated intensity map and combine our results with maps of CO =2-1, CO =1-0 and other data from the literature to investigate the variation of the molecular gas, atomic gas and polycyclic aromatic hydrocarbon (PAH) properties of M 51 as a function of distance along the spiral structure on sub-kiloparsec scales. We find that for the CO =3-2 and CO =2-1 transitions there is a clear difference between the variation of arm and inter-arm emission with galactocentric radius, with the inter-arm emission relatively constant with radius and the contrast between arm and inter-arm emission decreasing with radius. For CO =1-0 line and H i emission the variation with radius shows a similar trend for the arm and inter-arm regions, and the arm–inter-arm contrast appears relatively constant with radius. We investigate the variation of CO line ratios (=3-2/2-1, =2-1/1-0 and =3-2/1-0) as a function of distance along the spiral structure. Line ratios are consistent with the range of typical values for other nearby galaxies in the literature. The highest CO =3-2/=2-1 line ratios are found in the central 1 kiloparsec and in the spiral arms and the lowest line ratios in the inter-arm regions. We find no clear evidence of a trend with radius for the spiral arms but for the inter-arm regions there appears to be a trend for all CO line ratios to increase with radius. We find a strong relationship between the ratio of CO =3-2 intensity to stellar continuum-subtracted 8µm PAH surface brightness and the CO =3-2 intensity that appears to vary with radius.
keywords:
galaxies: individual(M 51), galaxies: ISM, galaxies: spiral1 Introduction
M 51 (NGC 5194), the ‘Whirlpool galaxy’, is a nearby grand-design spiral galaxy viewed almost face-on (Table 1), with two prominent spiral arms that can be traced close to the nuclear region, and is undergoing an interaction with a small companion, NGC 5195, 4.5′ to the north-east. With its large angular size and strong spiral structure M 51 is well studied across a broad range of wavebands from X-ray to radio, and has been the subject of numerous studies investigating the origin of grand design spiral structure (e.g. Tully, 1974; Garcia-Burillo et al., 1993b; Shetty et al., 2007; Meidt et al., 2008) and the relationship between spiral arms and star formation (e.g. Hitschfeld et al., 2009; Foyle et al., 2010). It is a Seyfert 2 (Ho et al., 1997) and hosts a low-luminosity active galactic nucleus (AGN) surrounded by a 100 pc disk of warm dense gas (Kohno et al., 1996; Matsushita et al., 1998). The two prominent spiral arms in M 51, presumed to be caused via tidal interaction with the companion, are rich in molecular gas (e.g. Aalto et al., 1999; Shetty et al., 2007; Koda et al., 2009), with molecular gas dominant over atomic gas until the outskirts of the disk (e.g. Garcia-Burillo et al., 1993a; Nakai et al., 1994; Schuster et al., 2007).
Molecular clouds provide the fuel for star formation, and in nearby galactic disks knowledge of the distribution of molecular hydrogen gas is a crucial tool for investigating star formation and spiral structure. Since molecular hydrogen is difficult to detect directly, as it lacks a permanent dipole moment, carbon monoxide (CO), observable at (sub)millimetre (submm) wavelengths, is widely used as a tracer of molecular hydrogen gas both in molecular clouds in the Milky Way and in external galaxies. At a distance of 8.2 Mpc (Tully, 1974, 1″ corresponds to pc) and an inclination (Tully, 1974), the proximity and face-on nature of M 51 makes it possible to use single-dish (sub)mm telescopes to study spiral arm structures and sub-structures at spatial resolutions of a few hundred parsecs. At this spatial resolution we are not sensitive to individual molecular clouds but rather clumps of molecular clouds, or Giant Molecular Associations (GMAs), as well as diffuse gas. The spiral arms of M 51 contain numerous GMAs (as many as 16 are noted by Aalto et al., 1999)
Since stars form not from the diffuse envelopes of molecular clouds but from their dense molecular cores, tracing the warm dense gas is important for our understanding of star formation. The =3-2 transition of CO (the =3 level is 33 K above ground state) is a tracer of this warm, dense gas, while the lower critical density CO =1-0 transition (the =1 level is 5.5 K above ground state) is sensitive to the majority of gas in the cold ISM, including, for example, more diffuse gas. In fact, many authors have shown that the CO =3-2 and CO =1-0 lines cannot be tracing exactly the same components of molecular gas, and, importantly, that CO =3-2 is the better tracer of warm dense gas (and hence star forming potential) (e.g. Wilson et al., 2009, and references therein).
Although M 51 has been mapped in low- rotational 12CO and 13CO transitions in a number of single-dish and interferometric studies, until now complete mapped observations of the full disk of M 51 in the higher energy level transition CO =3-2 line have been lacking, in particular because of the need for good telescope sites for higher frequency observations. Single-dish maps of the CO =1-0 and CO =2-1 transitions were presented by Garcia-Burillo et al. (1993a), Garcia-Burillo et al. (1993b), Schuster et al. (2007), Nakai et al. (1994) and Koda et al. (2009, 2011) (using the IRAM 30m and Nobeyama telescopes), and aperture synthesis maps have been presented by e.g. Lo et al. (1987), Sakamoto et al. (1999), Aalto et al. (1999), Regan et al. (2001) and Koda et al. (2009, 2011). These studies have indicated that CO is mainly confined to the spiral arms. Other authors have studied tracers such as CO, CI, and CII in the central region or at individual positions in the spiral arms (e.g. Israel & Baas, 2002; Kramer et al., 2005; Israel et al., 2006). CO =3-2 observations to date have been restricted to the central regions and inner spiral arms of the galaxy (e.g. Wielebinski et al., 1999; Dumke et al., 2001) and have also had a relatively coarse angular resolution. Aperture synthesis mapping of the central region has also been carried out (e.g. Matsushita et al., 2004; Schinnerer et al., 2010), but aperture synthesis maps are known to resolve out and miss both a significant proportion of the CO flux and any extended emission. Single-dish CO =3-2 observations of the full disk of M 51 are thus essential for determining the true distribution of molecular gas including any diffuse emission in the inter-arm regions, and thus its relation to star formation and the total reservoir of star-forming gas.
As well as understanding the distribution of molecular gas as a function of the spiral structure, it is also important to understand the relationship across multiple wavebands, from observations of the stellar component through to the dust and atomic gas components of the interstellar medium (ISM). Previous studies have suggested that polycyclic aromatic hydrocarbon (PAH) emission in the mid-infrared is a tracer of dust and gas in the cool ISM. For example, Regan et al. (2006) found that within nearby galaxies PAH emission is correlated with CO line emission, and several studies using Spitzer data have found that PAH emission is correlated with cool (20 K) dust emission in nearby spiral galaxies (e.g. Bendo et al., 2006; Zhu et al., 2008). However, using HARP CO =3-2 observations of the spiral galaxy NGC 2403, Bendo et al. (2010) found the scale length of the CO =3-2 radial profile to be statistically identical to the scale length of the continuum-subtracted 8µm (PAH) emission but found no correlation on sub-kpc scales.
In this paper we present the first complete CO =3-2 map of M 51 covering the entire optical galaxy disk over an area of 10′7′ (2417 kpc) at a spatial resolution of 600 pc. The paper is organised as follows. In Section 2 we describe our HARP-B CO =3-2 observations, the data reduction and processing of the HARP-B data, and our treatment of ancillary data we took from the literature. Sections 3–6 present our results. In Section 3 we present the HARP-B CO =3-2 map, describe the distribution of the CO =3-2 emission in a qualitative way, and compare our CO =3-2 map to maps of other tracers of molecular gas (CO =2-1, CO =1-0), atomic gas (H i), star formation (H , 24µm) and PAH 8µm emission using data available in the literature. We also investigate the contamination of submm continuum emission by in-band CO =3-2 line emission. In Section 4 we discuss how the appearance of M 51’s bright molecular gas rich spiral arms varies for different projected orientations and in Section 5 we disucss maps of the CO line ratio. In Section 6 we examine and discuss the distribution and properties of the CO =3-2 emission as a function of the distance along the spiral arms and inter-arm regions, and compare this to the distribution seen for other wave bands.
2 Observations and data reduction
| Parameter | Value |
|---|---|
| Centre R. A. (J2000) | 13h29m52.7s |
| Centre Decl. (J2000) | 4711′43″ |
| Morphological typea | SA(s)bc pec |
| Distance b | 8.2 Mpc |
| Position angleb | 170 |
| Inclinationb | 20 |
| b | 464 km s-1 |
| Bandwidth | 1 GHz |
| Original channel width | 0.488 MHz (0.423 km s-1) |
| rms () per 0.423 km s-1 channel | 0.037 K |
| rms () per 10.6 km s-1 velocity-binned channel | 0.008 K |
| Beamsize | 15″ |
| Spatial scale | 600 pc/beam |
a de Vaucouleurs et al. (1991)
b Tully (e.g. 1974)
2.1 HARP-B CO J=3-2 data
Observations of the J=3-2 transition of 12CO (rest frequency 345.79 GHz) were carried out with the 16-pixel array receiver HARP-B (Buckle et al., 2009) at the James Clerk Maxwell Telescope (JCMT) in January 2007. The telescope beam size (Half Power Beam Width) at this frequency is 15″, which corresponds to 600 pc at a distance of 8.2 Mpc. The 16 receivers of the HARP-B array are separated by approximately two beam widths (30″), and a “basket-weave” scan pattern was used to achieve a final map sampling with spacing of half a beam-size. HARP-B was used in conjunction with the Auto-Correlation Spectral Imaging System (ACSIS) backend spectrometer, which was configured to have a bandwidth of 1 GHz and a resolution of 0.488 MHz (0.423 km s-1at the observed frequency) per channel.
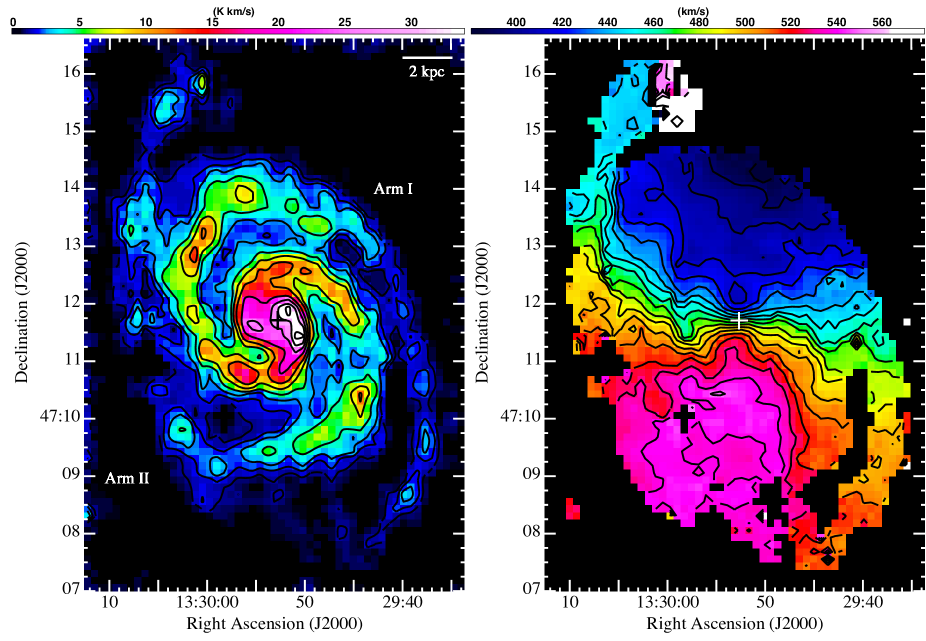
The data reduction was carried out using Starlink111The Starlink software package (Currie et al., 2008) is available from http://starlink.jach.hawaii.edu/ software packages such as KAPPA, SMURF and CUPID in a similar manner to that described in detail in Wilson et al. (2009) and Warren et al. (2010). Here, we give a brief overview of the data reduction process. First, the individual raw data files were inspected; obviously noisy channels were removed, the data was despiked, and any bad baselines were flagged. Second, the raw scans were combined into a data cube using the task makecube that is part of the SMURF software package. In this process, a sinc()sinc() kernel was used to determine the contribution of of individual receiver pixels to each map pixel (whose size was chosen to be 7.5″); this “SincSinc” function is an often used weighting function that results in a significant reduction in the noise in the map while having only a minor effect on the resolution. A baseline was then removed by fitting a fifth-order polynomial to line-free regions of the data cube. Thirdly, we created a mask of regions identified as having emission with a signal-to-noise 3 in a boxcar smoothed data cube (smoothed by 33 pixels spatially and over 25 velocity channels), using the task findclumps that is part of the CUPID software package and uses the clumpfind algorithm (Williams et al., 1994). Lastly, we applied this mask to the original high resolution data cube and from this produced moment maps. The CO integrated intensity (zeroth order moment) and velocity field (first order moment ) maps are shown in Figure 1. It is the CO =3-2 integrated intensity map that is the focus of this paper.
The size of the CO =3-2 map is 10′7′ (or 24 kpc17 kpc), which covers the full galaxy disk. CO =3-2 emission is detected over the large proportion of this area (see Section 3). The map rms noise level, measured over the main galaxy disk, is 37 mK (on the corrected antenna temperature, , scale) for a channel with 0.423 km s-1 velocity resolution (or 8 mK for a 10.6 km s-1 channel). We note that pixels at the very edges of the map tend to exhibit an increased noise level, and we thus exclude these from our analysis. The 1 noise level in the total intensity map is estimated to be 0.1 K km s-1(in units), based on the rms noise per 0.423 km s-1 channel and the number of channels at a typical position of emission. To convert the data from units to main beam brightness temperature () units we divided by the main beam efficiency =0.6. The uncertainty on is 10–15 %. Throughout the paper, all results will be quoted in units.
We compared our CO =3-2 map to previous CO =3-2 Heinrich-Hertz Telescope (HHT) data: a map of the inner 3′–4′ presented by Wielebinski et al. (1999) and a single HHT pointing at the central position presented by Mauersberger et al. (1999). After smoothing our map slightly to account for the difference in beam-size (the HHT beam-size was 22″and 18″ for the former and latter observations, respectively), we confirmed that both the shape of the spectra and the integrated intensity values in our map are in agreement with these previous studies within the calibration uncertainties (the uncertainty on is 20% for the HHT data). We note that contrary to the findings of Wielebinski et al. (1999), our HARP-B data does not show evidence of particularly extended CO =3-2 emission, and it appears that the HHT data may to some extent have been smeared out by an error beam.
We also compared the integrated intensity values in the CO =3-2 HARP-B map to previous JCMT CO =3-2 observations of the central regions presented by Israel et al. (2006) and find very good agreement.
2.2 Ancillary data
2.2.1 CO =2-1 and CO =1-0 data
For CO =2-1 and CO =1-0, we used the integrated intensity maps presented in Schuster et al. (2007) and Koda et al. (2009, 2011), respectively, which were kindly provided by the authors.
The CO =2-1 dataset was observed with the HERA instrument on the IRAM 30-m telescope, whose beamsize at the frequency of the CO =2-1 line is 12″. The mean baseline rms is 18 mK ( scale) at 5 km s-1 velocity resolution and the 1 noise level of the CO =2-1 map is 0.65 K km s-1, on the scale. To convert from units to main beam units we divide by =0.57 (Schuster et al., 2007). For further details of the CO =2-1 observations we refer to Schuster et al. (2007).
The CO =1-0 dataset was observed with the BEARS instrument on the Nobeyama Radio Observatory 45-m telescope, whose beamsize at 115 GHz is 15″. The 1 noise level is 14.7 mK ( scale) in a 10 km s-1 channel. To convert from units to main beam units the data is divided by =0.4. For further details of the CO =1-0 data we refer to Koda et al. (2009, 2011).
As for the CO =3-2 map, we also compared the CO =2-1 and CO =1-0 maps to previous datasets and again find good agreement.
2.2.2 H i data
We took H i integrated intensity maps from The H i Nearby Galaxy Survey (THINGS; Walter et al., 2008), via the THINGS website222http://www.mpia-hd.mpg.de/THINGS/Overview.html. THINGS was observed with the Very Large Array (VLA) in multiple configurations to provide uniform sensitivity over a range of spatial scales, and provides two differently weighted datasets – a natural weighted integrated intensity map and a robust weighted map. In this work we use the natural weighted map as this should be more sensitive to extended, large-scale, emission and we do not require the higher resolution provided by the robust weighted map. The Full Width at Half Maximum (FWHM) of the Point Spread Function (PSF) of the H i image is 11.92″10.01″.
2.2.3 H and Spitzer Space Telescope data
We used H (R-band subtracted), Spitzer Infrared Array Camera (IRAC) 3.6 and 8µm and Spitzer Multiband Imaging Photometer (MIPS) 24µm and 70µm data from the Spitzer Infrared Nearby Galaxies Survey (SINGS; Kennicutt et al., 2003) sample, obtained via the NASA/IPAC Infrared Science Archive333http://irsa.ipac.caltech.edu/data/SPITZER/SINGS/. For a description of the data reduction technique we refer to Regan et al. (2006). The FWHM of the PSFs are 1.7″, 2″, 6″ and 18″ for the 3.6, 8, 24 and 70µm data, respectively.
We used the 3.6 and 8µm images to produce a map of the PAH 8µm emission using the relationship
| (1) |
derived by Helou et al. (2004), to subtract the stellar continuum from the 8µm image (where has units of MJy sr-1). For the two IRAC images used in this equation we first subtracted residual backgrounds, by interpolating a smoothed version of the background outside the optical disk, masked out bright foreground stars, and corrected to an ‘infinite aperture’ using values of 0.944 and 0.737, respectively, as described in Reach et al. (2005).
For the 24µm image we also subtracted a residual background, using the same method of interpolating a smoothed version of the background outside the optical disk as we used for the IRAC images.
2.3 Alignment, convolution and re-gridding
Since in this work we wish to make comparisons between physical regions probed at different wavelengths, for example comparing structures in our CO =3-2 image with CO =2-1 and CO =1-0 images taken from the literature (see Section 2.2.1), it is important to ensure the image coordinates are aligned and to convolve all the images to the lowest common resolution. We checked the relative pointing offsets between the three datasets by comparing peaks in the integrated intensity maps convolved to the HARP-B beamsize and pixel grid, by comparing the three datasets to the higher resolution BIMA SONG CO =1-0 map (Helfer et al., 2003), and by examining the pixel–pixel relationship of the integrated intensity maps resampled onto a smaller pixel grid. We found no obvious offset between the two CO =1-0 images, and also no obvious offset between the CO =1-0 images and the H and 24µm images. For the CO =3-2 and CO =2-1 images we found offsets of ″ and ″, respectively, which is consistent with the pointing uncertainties for each dataset. A similar offset for the CO =2-1 dataset was previously reported by Koda et al. (2012). We applied these shifts to the HARP and HERA data accordingly. We stress that while small pointing offsets (a fraction of the beam) for each of the CO datasets is possible, it is unlikely that instead a single large (8″) pointing offset could be present for just one of the datasets (and such a large offset in a single dataset would be highly obvious). We note that although applying the pointing offsets results in generally better alignment of features in the two CO images, it does not significantly affect the overall results presented in this work.
We then convolved all the images to match the PSF of the HARP-B data (15″ FWHM) and regridded them onto the same pixel grid as the HARP-B data (7.5″ pixels). For the MIPS and IRAC images we obtained convolution kernels for the individual wavebands from Gordon et al. (2008), which are produced using the PSF simulator STinyTim (Krist, 2002) and empirically determined, respectively. Detailed information is given in Gordon et al. (2008). From these, we created kernels that match the resolution of each dataset to the HARP-B CO =3-2 PSF and applied these to each dataset. For the CO and H i images we used Gaussian kernels. 444Kernels are available from http://dirty.as.arizona.edu/kgordon/mips/conv_psfs/conv_psfs.html In our analysis in Sections 5 and 6, only pixels detected at 3 in the relevant images are used.
2.4 The -factor and the conversion of CO line intensity to molecular gas surface density
The surface density of molecular gas, and related parameters such as the gas-to-dust ratio, are dependent on the ubiquitous CO–to–H2 conversion factor (‘-factor’) . Application of a constant X-factor across a galaxy assumes that there is little variation with metallicity or star formation activity. Yet, the metallicity is found to vary with radius in most spiral galaxies, leading many authors to suggest that may vary with metallicity in spiral galaxies (e.g. Arimoto et al., 1996; Israel, 2005), while other authors suggest that may depend on other factors such as the cosmic-ray rate (e.g. Bell et al., 2006). For example, Garcia-Burillo et al. (1993a) found evidence that the value of may be a factor of about two smaller in the inter-arm region compared to the spiral arms.
Moreover, the -factor for conversion from CO line emission to molecular gas column density is usually based on the CO =1-0 line, and the value of appropriate for the =3-2 transition of CO is rather uncertain. Previous authors have attempted to use CO =3-2 data as an indirect measure of H2, by assuming a CO =1-0 factor and converting from CO =3-2 intensity to CO =1-0 intensity using the measured CO =3-2/=1-0 ratio. However, this method assumes that the -factor is constant, and does not vary, for example, with galactocentric radius, and that the different CO lines trace the same molecular gas. Other authors have derived values for the CO =3-2–to–H2 conversion factor, , using numerical models, for the central regions of galaxies where 100 km s-1, and thus it is unclear whether it is applicable across the galaxy as a whole, in particular at much large galactocentric radii and in inter-arm regions where the CO intensities are considerably lower.
Studies of the H2 surface density using the CO =2-1 and CO =1-0 datasets used herein have been presented by previous authors (notably, Schuster et al. (2007) and Nakai et al. (1994)). In the present work, however, we are concerned with examining the variation of CO properties as a function of galactocentric radius and physical location (arm or inter-arm region etc.) across M 51, and thus we choose to discuss the distribution in terms of observed CO integrated intensities and do not attempt to apply a CO =3-2–to–H2 conversion factor. Also, examining relationships, e.g. the relationship between CO =3-2 and PAH emission (see Section 6.6), in terms of CO intensities rather than molecular gas surface densities allows us to make a consistent comparison with previous authors who disussed CO intensities (e.g. Regan et al., 2006; Bendo et al., 2010). However, we will use the CO =3-2 intensity to investigate whether the CO =3-2/=1-0 ratio, or its dependence on another property of the galaxy such as CO =3-2 intensity or galactocentric radius, could be used to scale the CO =1-0 -factor for use with the CO =3-2 line.
3 A map of M 51 in CO =3-2 emission and comparison to other wavebands
The HARP-B CO =3-2 integrated intensity map of M 51, shown in Figure 1, is the first sensitive CO map of the entire galaxy disk in the CO =3-2 transition. The spatial scale is 600 pc per 15″ beam, or 300 pc per pixel. The first contour level shown corresponds to 3, where 0.17 K km s-1(). CO =3-2 emission is detected out to a radius of 12 kpc, and is detected everywhere over a central area of 1410 kpc.
In this section we describe the CO =3-2 image, which shows CO emission associated with molecular gas. We also give a qualitative comparison with images of other spiral arm tracers: lower CO transition tracers of molecular gas, H i emission that shows atomic gas, PAH emission (using the PAH 8µm image produced as described in Section 2.2.3), H that traces HII regions, and MIPS 24µm emission that traces recent dust enshrouded star formation (and may also include a component of diffuse 24µm emission that is not associated with recent star formation; Section 6). These images are shown at their native resolutions in Figures 1–3, with contours of the CO =3-2 emission superimposed.
3.1 The CO =3-2 image
| Central kpc | Arms | Outer arms | Inter-arm | |
|---|---|---|---|---|
| Linewidth (km s-1) | 40–80 [100] | 20–50 | 15–20 | 15-20 |
| Brightness temperature (K) | 0.3–0.7 [0.8] | 0.1–0.5 | 0.1 | 0.1 |
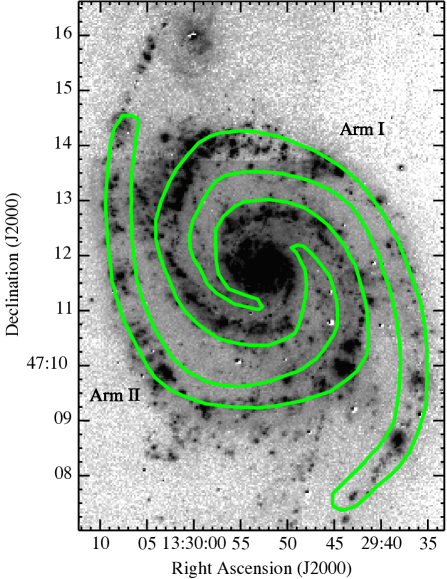
The CO =3-2 emission traces the two-armed spiral pattern, with one arm unwinding from the western side of the nuclear disk (hereafter ‘Arm I’) and the other arm unwinding from the eastern side of the nuclear disk and stretching towards the companion galaxy, NGC 5195, located at 11 kpc to the northeast of M 51 (hereafter ‘Arm II’). The two arms are labelled in Figure 1. Arm I exhibits continuous CO =3-2 emission out to a radius 250″ (10 kpc), with a notable ‘kink’ to the northwest at 110″, where a peak of emission extends into the inter-arm region via a spur or bridge joining Arm I with Arm II. On the other hand, Arm II exhibits depression in the CO emission at 100″ west. This is not a void but rather the CO emission here is at a comparable level to that in the inter-arm region.
Beyond this gap, there is a region of enhanced emission in Arm II at 120″ (5 kpc) southwest, where the intensity is the highest of any emission in the spiral arm outside the central 2 kpc. This emission peak is mirrored symmetrically opposite by such a peak in Arm I at 120″ northeast. Enhanced star formation activity (Calzetti et al., 2005) and [CII] emission (Nikola et al., 2001) have previously been reported at these two locations, which are near the predicted corotation radius (160″; Garcia-Burillo et al., 1993a, b) of the strong density wave pattern implied by kinematic studies (e.g. Aalto et al., 1999; Garcia-Burillo et al., 1993a; Kuno & Nakai, 1997; Shetty et al., 2007). Enhanced emission at these locations is interpreted as being triggered by the interaction with the companion (e.g. Toomre & Toomre, 1972; Nikola et al., 2001). As described previously by a number of authors (e.g. Nakai et al., 1994), the locations of these peaks also mark the locations beyond which the emission no longer follows a simple (e.g. logarithmic) spiral pattern.
Along the inner part of Arm I the emission peaks are fairly regularly spaced (at intervals of typically 1.8 kpc), while for Arm II fewer distinct peaks are discernible. The emission along the outer parts of both spiral arms appears to be more fragmented, as noted for CO =2-1 emission by Schuster et al. (2007). However, the outer part of Arm I to the west exhibits continuous low-level CO =3-2 emission out to 10 kpc (i.e. comparable to the level of inter-arm emission) with emission peaks fairly regularly spaced along the arm (at intervals typically of the order of 2.5k̃pc).
The arm–inter-arm intensity contrast is high, and the brightest CO =3-2 emission clearly follows the spiral structure. Nonetheless, inter-arm emission is detected at 3 everywhere out to a galactocentric radius of 5 kpc and is detected for some regions out to 10 kpc. The location of the highest arm/inter-arm contrast is at 1.7 kpc south-west (just to the west of the brightest emission peaks in the image) where the intensity drops by a factor of 14 over just 9″. We will return to the discussion of the spiral structure later in this section and in Section 6.
There are several obvious spurs of CO =3-2 emission connecting the two arms. One of the brightest features is to the north-west, at a galactocentric radius of 100″ (4 kpc). To the south-west, at radii of 50″–110″ (2–4 kpc), there are two further spurs, while another strong feature is seen to the north-east at a radius of 150″ (6 kpc). These spur-like features are also very apparent in the CO =2-1, CO =1-0 and H i images, the latter feature being especially apparent in the H i, H , 24µm, and PAH 8µm images (see Figures 2 and 3). To the south, there is a hint of two faint spurs of emission connecting the two arms at 3′–4′ (7–10 kpc). Although in these regions the CO emission is detected in typically only a handful of channels, with the signal-to-noise over these channels ranging from 2–7, we note that peaks in the stronger of the two spurs are also apparent in the CO =2-1 image (see Figure 2) and both features are clearly detected in recent Herschel SPIRE 250µm and 350µm observations (Mentuch Cooper et al., 2012) which have comparable resolution. The CO =3-2 image is seen to closely resemble the 250µm SPIRE image.
Typical values of CO =3-2 line widths and brightness temperatures at different locations in the galaxy are given in Table 2. As expected due to beam smearing, the broadest line spectra are found within the central kiloparsec (central 25″) of the galaxy, with typical widths of 40–80 km s-1, and 100 km s-1 at the very centre. Here, brightness temperatures are found to be typically 0.3–0.7 K, with the highest values (0.8 K) found not right at the centre but corresponding to the locations where the spiral arms begin to wind out. The brightness temperature in the spiral arms is typically found to range from 0.1–0.5 K, with no obvious dependence on radius until the outermost region of the arms, where values are 0.1 K. Typical line widths in the spiral arms, however, are found to decrease with distance along the spiral arms, from 50 km s-1 to 20 km s-1, as has previously been noted for CO =2-1 by Garcia-Burillo et al. (1993a) and Hitschfeld et al. (2009) who attribute the decrease in line width to streaming motions (e.g. Garcia-Burillo et al., 1993b). In the outer spiral arms line widths are typically 15-20 km s-1, comparable to the widths found in the outer disk and in the inter-arm regions. Brightness temperatures in the inter-arm regions are found to be 0.1 K. Overall, CO =3-2 line widths in the centre of the galaxy and in the spiral arms are in very good agreement with those found for CO =1-0 by Nakai et al. (1994) and for CO =2-1 by Garcia-Burillo et al. (1993a) and Hitschfeld et al. (2009).
3.2 Comparison to CO =2-1 and CO =1-0 images
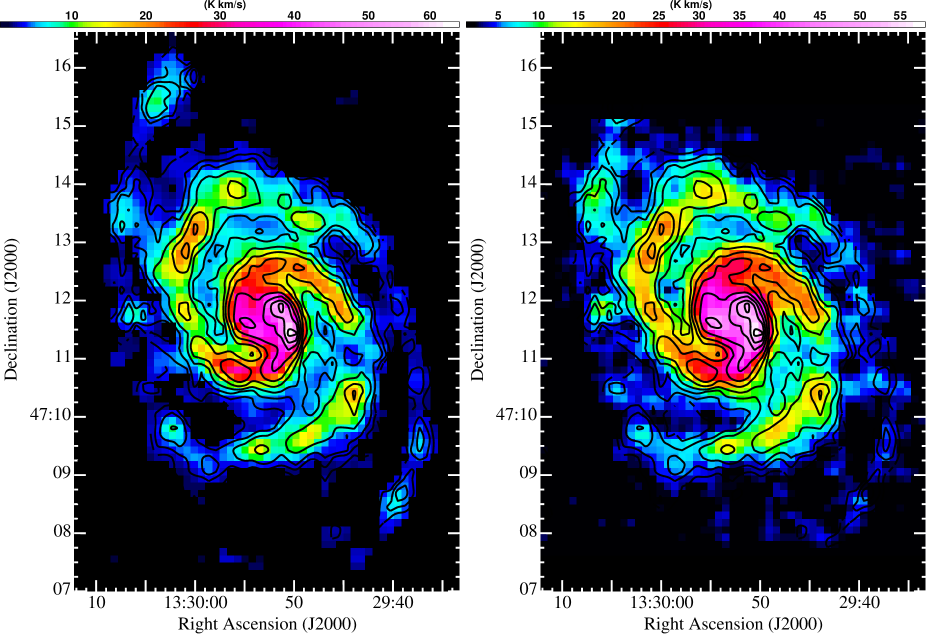
CO J=2-1 and CO =1-0 integrated intensity images, at their native resolutions, are shown in Figure 2. All images are convolved to a common scale of 600 pc and gridded on to the same 7.5″ pixel grid as the HARP data, as described in Section 2. The CO =2-1 and CO =1-0 emission is seen to trace the same two-armed spiral pattern as described for CO =3-2.
The CO =2-1 emission in particular closely traces the same features described above for CO =3-2, with clear distinction between the spiral arm and inter-arm regions. In fact, the peaks of CO =3-2 and CO =2-1 emission are remarkably well aligned; at this spatial resolution we find no significant emission peaks in either map that are not in excellent agreement. Even in the central region where, at 50″, the spiral arms begin to wind out and Arm I is characterised by two peaks of CO =3-2 emission, these two emission peaks are seen at the same spatial location in the CO =2-1 image. All the bright peaks of CO =3-2 emission appear to correspond to peaks in the CO =2-1 image and most of the bright CO =3-2 peaks appear to have corresponding peaks in the CO =1-0 image. Conversely, we find no bright peaks in the CO =2-1 and CO =1-0 images that are not the also the locations of bright peaks in the CO =3-2 image.
The highest arm/inter-arm contrast in the CO =2-1 image is found at the same location as for the CO =3-2 image, i.e. 1.7 kpc south-west of the centre, although the CO =2-1 integrated intensity drops by only a factor of about six over 9″, and falls by a factor of 14 over 16″. Garcia-Burillo et al. (1993a) found a similar result at this location using a different CO =2-1 dataset. These authors point out that the sudden drop between the spiral arm and inter-arm may in part be related to the fall-off of the nuclear component.
The CO =1-0 emission appears more diffuse with fewer apparent features. For example, the central CO =1-0 emission is characterised by a single peak that is located between the peaks seen for the higher transitions. Indeed, a fundamental difference between CO =1-0 and the higher transitions is to be expected, since the CO =1-0 line traces clouds of molecular gas, for example relatively low density cold diffuse gas, that are not (or only marginally) traced by the higher CO transitions.
For all three CO transitions the spiral arms show fairly regularly spaced concentrations or “clumps” of molecular gas, and, as noted for the lower CO transitions by previous authors (e.g. Garcia-Burillo et al., 1993a; Schuster et al., 2007), at a spatial resolution of 600 pc may be referred to as GMAs and may represent either bound clusters or random superpositions of GMCs (e.g. Rand & Kulkarni, 1990; Garcia-Burillo et al., 1993a). The outer parts of the two arms appear more fragmented than the inner parts for all three CO transitions.
3.3 Comparison to other wavebands
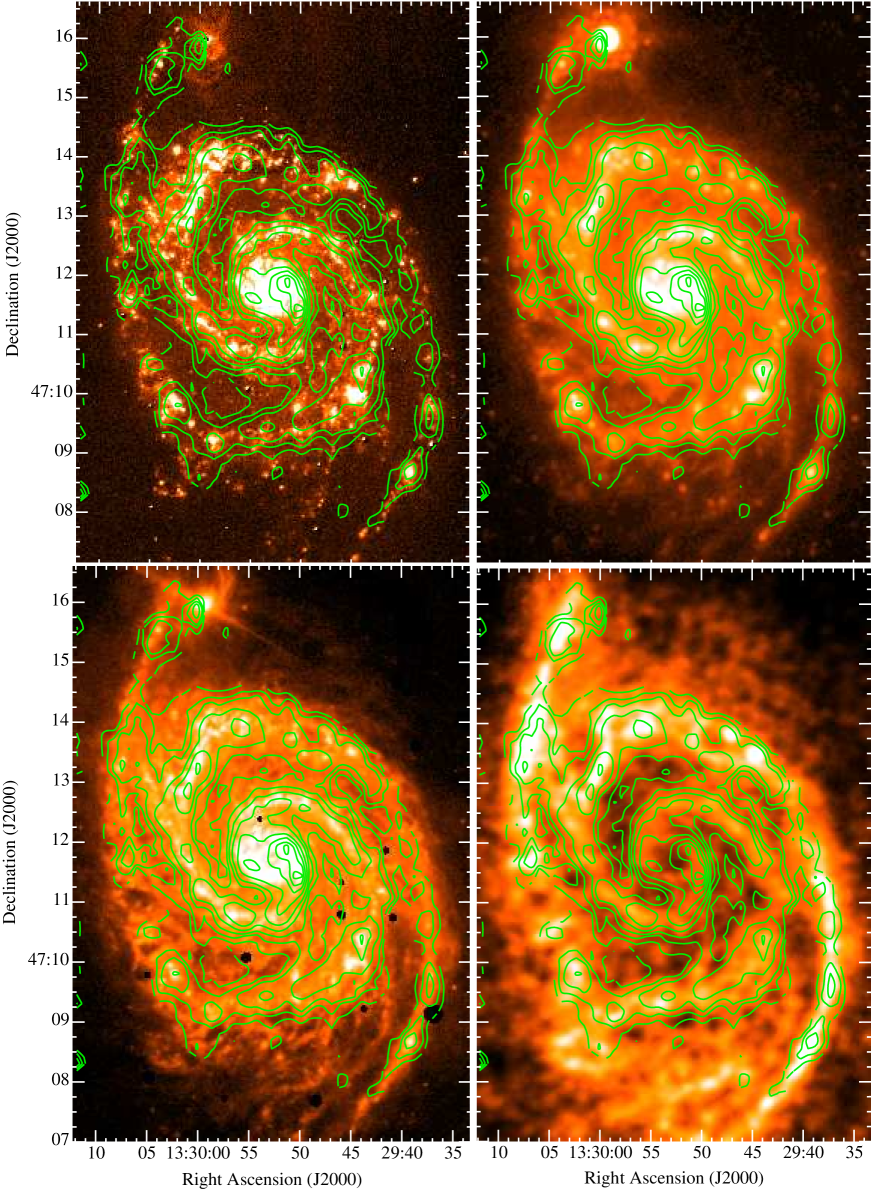
The H , 24µm, PAH 8µm and H i images are shown, at their native resolutions, in Figure 3. The PAH 8µm image clearly traces the clumpy dust structures of the ISM. The H i emission is stronger in the outer regions, and only a faint spiral structure is seen in the inner regions, as is typical in the inner parts of late type spirals where star formation is more active and the molecular phase dominates. By simple inspection of the images it is clear that the intensities of CO and H i are anti-correlated (also see Section 6.2).
Compared to the CO =3-2 emission, H , H i, PAH 8µm, and 24 µm peaks in the northern parts of both spiral arms (within the co-rotation radius) are found to be slightly offset, by 300–400 pc (7″–10″), towards the convex (downstream) side of the arms. This is particularly clear for Arm II at 2.5 kpc north. This is in agreement with the findings of previous authors (e.g. Tilanus & Allen, 1991; Garcia-Burillo et al., 1993a; Kuno et al., 1995; Bastian et al., 2005; Egusa et al., 2009; Louie, Koda & Egusa, 2013), although we note that CO =3-2 (and likewise the CO =2-1 and CO =1-0) emission is nonetheless present at the offset locations. Elsewhere in the spiral arms, even in the outer arms up to 10 kpc, we see excellent agreement between bright peaks of CO =3-2 emission and bright peaks in the H i, PAH 8µm, H and 24µm images. One clear difference is that in the outer spiral arms of the CO =3-2 (and likewise CO =2-1) image, despite the good agreement between bright peaks we note a tendency for the H i, PAH 8µm and 24µm emission to be more extended on the convex side of the arms. This is particularly apparent at the western and north-eastern sides of Arm I, close to locations of spurs of emission bridging the region between the inner spiral structure and the outer arms that are particularly clear in the PAH 8µm image.
Comparison to the CO =2-1 image from Schuster et al. (2007) presents a very similar result, since the CO =3-2 and CO =2-1 peaks are coincident, and we find excellent agreement between bright peaks of CO =2-1 emission and all the other emissions even in the outer part of Arm I where these authors noted a slight offset. The relative locations of peaks in the CO =2-1 and H images are in excellent agreement with those presented for different CO =2-1 and H datasets by Garcia-Burillo et al. (1993a), and thus we believe that the slight offset noted by Schuster et al. (2007) was likely due to a small pointing offset for which we have corrected in the present work (see Section 2 for details of our treatment of the datasets).
The CO =3-2 image also shows very good correspondence with with the PAH 8µm image, with both images appearing to trace the same spiral spiral pattern. The locations of most peaks (and likewise troughs) in the CO =3-2 image are also the locations of peaks and troughs in the PAH 8µm image. This is particularly obvious in the outer spiral arms and at the location of the spurs of emission spanning the inter-arm region to the southwest. The converse is also true, i.e. most features in the PAH 8µm image have counterparts in the CO =3-2 image. There are, however, some clear differences. For example, to the south, where Arm I begins to unwind, there is a dip in the PAH 8µm surface brightness that is not seen in the CO =3-2 image. Also, in Arm II at 5.5 kpc the CO =3-2 peak is coincident with a peak in the PAH 8µm image, but there is a second PAH 8µm peak with no corresponding CO =3-2 feature. The distribution of emission in the CO =3-2 and 24µm images is also generally similar, but the differences described for the PAH 8µm image are also seen for the 24µm image. One notable difference between the CO =3-2 and 24µm images can be seen for the outer western part of Arm I, where the emission appears very smooth at 24µm while several CO =3-2 knots are seen along the arm. We will return the the subject of the relationship between the CO =3-2, PAH 8µm and 24 µm images in Section 6.
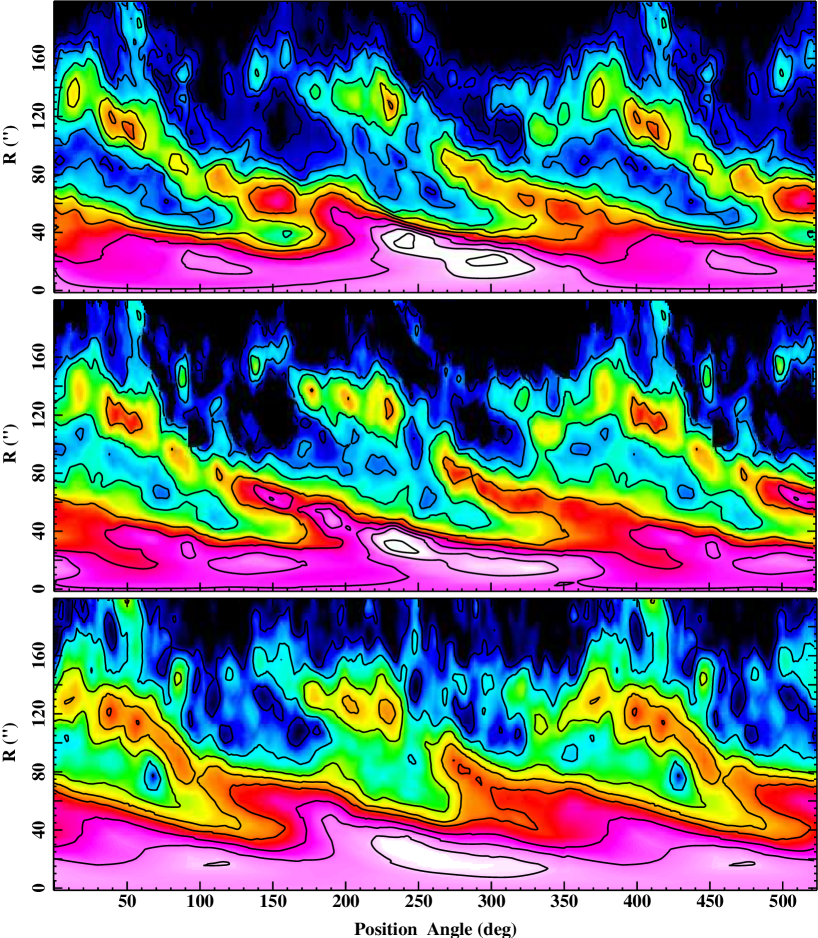
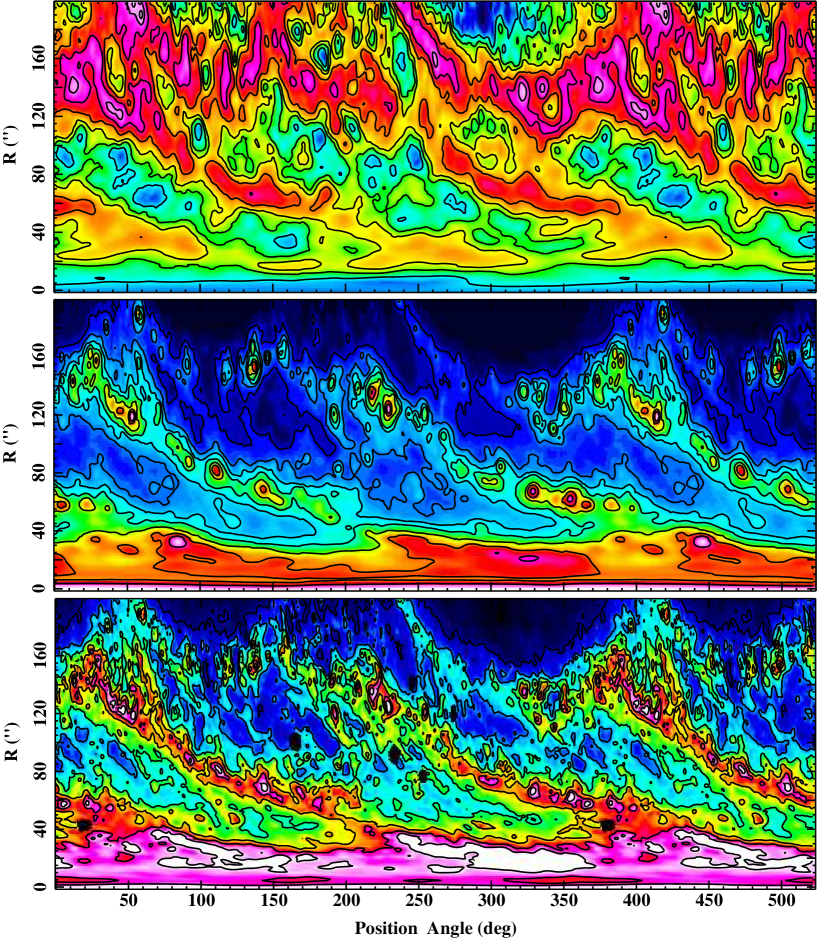
Many of the same features can be seen across most wave bands, despite the different native resolutions. To allow a clearer visualisaion of the comparison, and to aid the eye in delineating spiral features, in Figures 4 and 5 we display the CO, H i, PAH 8µm and 24µm images in polar coordinates. These images have first been de-projected using the inclination angle, position angle and central position given in Table 1.
In polar coordinates, Arm I can be seen to emerge from a radius of 50″ in the central region at a position angle of 190. Arm II begins at 370 (i.e. 10). Many of the features of the CO emission described in Section 3 are clearly emphasized in the polar images, and it is particularly striking how well-defined the spiral arm structure is in CO =3-2 and CO =2-1 emission. Conversely, the CO =1-0 image appears considerably more diffuse, with clear emission in the inter-arm regions. There are similarities, however. Spurs of emission connecting the two arms can clearly be seen in all three CO images at position angles of 60 and 340, and the point at which the spiral pattern deviates from a simple logarithmic spiral is clearly discernible at position angles of 50 and 230. The latter are the locations of the symmetrically opposite bright peaks in each of the spiral arms described in Section 3.1.
3.4 Contamination of submillimetre continuum by CO =3-2 line emission
Submm continuum observations of Galactic and extragalactic objects may suffer from contamination from inband line emission, which for many sources is primarily CO =3-2 line emission, due to the broad passband of many submm instruments such as SCUBA; the centre of the SCUBA 850µm bandpass is very close to the rest frequency of the CO =3-2 transition (345.796 GHz). Continuum 850µm emission is typically used to trace cool dust, and since correcting 850µm emission for the contribution from CO will lead to a higher dust temperature and lower dust mass, knowledge of the amount of contamination can be vital. In particular, detailed knowledge of the amount of contamination by the CO =3-2 line in a nearby galaxy such as M 51, where we can investigate the percentage contamination as a function of radius and spiral structure, could be extremely useful for future galaxy studies.
We carried out this investigation using our CO =3-2 map together with the total SCUBA 850µm map from Meijerink et al. (2005), which includes emission from an exponential dust disk (see Meijerink et al., 2005, for details and for a description of the data reduction procedure). Since both the CO =3-2 and 850µm maps were obtained at the JCMT the beam sizes are comparable so we can compare the two maps directly and the only treatment of the 850µm map was to regrid it onto the same pixel grid as the CO =3-2 map. Only pixels detected at 1.5 in both the CO =3-2 and 850µm images were considered.
We first produced an image of the SCUBA equivalent flux produced by the CO =3-2 line at the recessional velocity of M 51 using the profile of the SCUBA filter bandpass and a 15″ beam size. We then divided this image by the SCUBA 850µm image to produce an image of the percentage contamination at 850µm by inband CO =3-2 emission. This is shown in Figure 6. Values are typically 10–20% in the spiral arms and are highest in the central 2 kpc radius (on average 20% but reaching a maximum of 26% in the inner part of Arm II). In the inter-arm regions and outer spiral arms values are 10%. The average over the disk is 9%. We note, however, that if we perform the same analysis using the exponential disk-subtracted 850µm map from Meijerink et al. (2005) the percentage contamination in the spiral arms is considerably higher.
4 The geometry of central molecular emission

Several authors have attempted to describe the geometry of the distribution of molecular gas in the central regions of galaxies that are more highly inclined than M 51 based on the observed profile of the central gas component (often a ‘two-horned’ profile), leading to the conclusion that the gas is located in a molecular ring (e.g. Irwin et al., 2011). However, the inclination of a galaxy may determine how reliably the geometry of its gas distribution can be determined. If, for example, a galaxy has bright molecular gas rich spiral arms, as is seen for M 51, this could potentially mimic a ring if observed edge-on (c.f. Israel et al., 2006). We can therefore use the M 51 CO =3-2, CO =2-1 and CO =1-0 maps as a simple test of this scenario, by projecting the CO integrated intensity images to several different edge-on orientations and examining the shape of the profiles along the major axis.
Figure 7 shows major axis profiles of M 51 for a major axis oriented along 90 and 135, produced using the parameters given in Table 1. It can clearly be seen that the shape of the CO =3-2 and CO =2-1 profiles at each projected orientation are similar. However, the important thing to note is that it is also clear that the shape of the edge-on profile can appear ‘centrally-peaked’ or ‘two-horned’ (see the second column of Figure 7 in particular) depending on the orientation. Thus it appears that, depending on viewing angle, a galaxy like M 51 with bright molecular gas rich inner spiral arms may be observed to exhibit a two-horned profile that mimics a molecular ring.
5 CO line ratios
Maps of the ratio of CO =3-2/J=2-1 CO =2-1/1-0 and CO =3-2/J=1-0 integrated intensities are shown in Figure 8 (hereafter . and ). These CO ratio maps were produced from the CO images shown in Figures 1 and 2 for pixels where the emission is detected above 3 in both the input images. Input images (which are on the main beam temperature scale) were first matched to the HARP CO =3-2 resolution and pixel grid as described in Section 2.
The CO ratio maps clearly exhibit a spiral-like structure, with the highest ratio values typically located in regions corresponding to the spiral arms and the lowest values typically located in the inter-arm regions. Values of the CO ratio in different regions of the galaxy are summarised in Table 3.
We find a median ratio of 0.5 over the whole disk. In the central kiloparsec values are somewhat higher, ranging from 0.6 to 0.7 at the central position and towards the location where Arm I begins to wind out. The ratio clearly varies across the galaxy in a way that is similar to the spiral structure, with the highest values (unity) found in the spiral arms and the lowest values (0.1) found in the inter-arm regions. For the median value is 0.36 over the galaxy disk and somewhat higher in the central kiloparsec.
For the ratio of CO J=2-1/J=1-0 () we find a median value of 0.80 over the galaxy and somewhat higher in the central kiloparsec. Similar results using the same datasets were presented by Koda et al. (2012). As for , the ratio also appears to vary in a way that follows the spiral structure. However, the main difference is that, for , the contrast between the spiral arms and inter-arm regions appears less pronounced over the central few kiloparsecs and the highest values are found in the spiral arms at larger galactocentric radii (4 kpc). While values of at larger radii are found to be up to a factor of two higher than in the more inner spiral arms, values of in the spiral arms appear to be similar at all radii. We note, however, that very high or low ratio values found in gradient locations such as at the edges of the spiral arms may be unreliable since, despite the care taken to align the maps and convolve them to a common beamsize (Section 2.3), there may still be minute alignment errors between the maps or minute differences in matched beamsizes.

| Global | Central kpc | Arm | Inter-arm | |
|---|---|---|---|---|
| (1) | (2) | (3) | (4) | |
| CO J=3-2/J=2-1 | 0.50† 0.14∗ [0.1–1.0] | 0.63 | 0.5 | 0.4 |
| CO J=2-1/J=1-0 | 0.80§ 0.32∗ [0.3–3.1] | 0.86 | 0.9 | 0.5 |
| CO J=3-2/J=1-0 | 0.36‡ 0.17∗ [0.1–1.7] | 0.54 | 0.4 | 0.2 |
(1)-(2) Median CO ratio over the full galaxy disk and central kiloparsec, for pixels where the emission is detected above 3 in both input images; the uncertainty indicates the standard deviation of the ratio over the whole disk.
(3)-(4) Typical CO ratios in the spiral arms and inter-arm regions.
The median CO =3-2 line intensity is 3.6 K km s-1and the median CO =2-1 line intensity is 7.5 K km s-1.
The standard deviation of the CO line intensities in the input images is 6, 10 and 5 for CO =3-2, CO =2-1 and CO =1-0, respectively. The sources of uncertainty on the CO line intensities are described in Section 2.
The median CO =2-1 and CO =1-0 line intensities are 7.6 and 5.5 K km s-1, respectively.
The median CO =3-2 and CO =1-0 line intensities are 2.2 and 3.7 K km s-1, respectively.
From inspection of Figure 8, while all three ratio maps appear to trace the spiral-arm structure, ratios with CO =1-0 appear to show a clearer spiral pattern than , which appears somewhat smoother. This is not unexpected – since the higher CO transitions trace the spiral structure better than CO =1-0, ratios of these transitions with CO =1-0 will show a clear spiral pattern, while if the higher CO transitions trace the spiral structure roughly as well as each other then the ratio of the two will produce a map that is somewhat smoother in appearance. We discuss in more detail the variation of the CO ratios as a function of distance along the spiral arms and inter-arm regions in Section 6.
We find the values of to be in agreement with the range of values found for M 51 by previous authors and for spiral galaxies in general (e.g. Mauersberger et al., 1999). The average line ratio over the whole disk of M 51(0.36) falls within the range of ratios found by Mauersberger et al. (1999, 0.2–0.7), and is consistent with the average values found in a number of other recent CO =3-2 studies of nearby galaxies with the HARP-B instrument (e.g. Wilson et al., 2009; Warren et al., 2010). These authors point out that if galaxies have enhanced line ratios in their centres, then previous observations such as those by Mauersberger et al. (1999) that only observed the central regions of galaxies may have overestimated the ratios averaged over the whole galaxy disk. The factor of 10 variation in across the disk of M 51 is high compared to some previous observations (e.g. Thornley & Wilson, 1994; Mauersberger et al., 1999) but is in good agreement with the variation found in recent studies by Bendo et al. (2010) and Wilson et al. (2009) for other nearby galaxies observed in CO =3-2 with HARP-B. As these authors suggest, a large variation in may be real but was not observed before due to some regions being undetected or unresolved.
In the present work, no attempt has been made to extract molecular gas parameters from the measured line ratios, because the observed 12CO transitions are strongly degenerate with respect to molecular gas temperature and density. This degeneracy can be broken by e.g. observations of an optically thin isotope such as 13CO, but these are not available at present on a galaxy-wide scale. Relevant discussions of a few individual pointings may be found in Kramer et al. (2005) and Israel et al. (2006).
The nuclear region of M 51 appears to have line ratios that are different from those of much of the disk, indicating perhaps an excitation mechanism substantially different from the presumed PDR excitation of the disk gas (also see Israel et al., 2006). Whether or not this related to the low-luminosity AGN referred to in the introduction is not presently clear. To answer this question reqwuires a more detailed study of the molecular line emission from the central region.
6 Radial properties of M 51 as a function of the CO spiral structure
In this section we investigate the properties of M 51 as a function of galactocentric radius and, specifically, as a function of the distance along the observed molecular spiral structure.
6.1 Describing the CO spiral structure
The commonly used method of obtaining radial profiles by averaging in elliptical annuli over the whole disk is likely to average out the true variation of properties along spiral arms and in inter-arm regions, so here we describe our alternative approach of producing separate radial profiles of the spiral arms and inter-arm regions.
The spiral pattern at small galactocentric radii (R120″) in M 51 has often been described with simple symmetrical logarithmic spirals (see e.g. Nakai et al., 1994; Shetty et al., 2007). However, the spiral arm pattern clearly no longer follows a logarithmic spiral at R120″ (5 kpc), with the fracture in the spiral pattern at R120″ and the distortion at radii beyond this presumably due to the tidal interaction with the companion galaxy; in the images in Figures 4 and 5 this can be easily seen at P.A.50 for Arm I and P.A.230 for Arm II, for all three CO transitions as well as PAH 8µm and 24µm emission. In previous studies tracing the spiral structure in M 51 to radii much larger than 120″, authors have adopted a variety of approaches for defining the spiral structure, but have often involved selecting regions based on CO surface brightness. For example, Hitschfeld et al. (2009) attributed all emission above a certain threshold molecular gas surface density to spiral arms and the remainder to the inner-arm regions, and Foyle et al. (2010) followed a similar approach but instead used the surface density of stellar 3.6µm emission. This approach, however, has the effect of including emission features (spurs) bridging the gap between the spiral arms as part of the arms themselves.
In the present work, we instead wish to examine the properties M 51 as a function of physical location and distance along the observed spiral morphology out to where the interaction with the companion NGC 5195 is taking place (11 kpc), and thus we require a different approach. We take the simple approach of defining a mask by eye that broadly describes the observed appearance of the CO spiral structure out to large radii – i.e. two spiral arms and two inter-arm regions, where we define the “spiral arm” region as a continuous broad structure that is linked seamlessly from the nuclear region in a broadly spiral pattern. The remaining region in between the spiral arms we refer to as the “inter-arm” region, irrespective of any emission features it may contain. The resulting mask – defined based on the CO =3-2 image while ensuring that it adequately describes the spiral structure observed in the other two CO transitions – is shown in Figure 9. The width of the spiral arms defined in this way is 1 kpc (20″–30″), when corrected for the telescope beam, which is in excellent agreement with the values found for CO =2-1 and CO =1-0 by Garcia-Burillo et al. (1993a) and Nakai et al. (1994), respectively.
We produce radial profiles by plotting the pixels in each spiral arm or inter-arm as a function of galactocentric distance (where the central position is defined as given in Table 1). These are shown by the black points in Figures 10 (filled and open points show Arms I and II, respectively) and 11. We also bin this data into 0.5 kpc bins (approximately the size of the HARP-B beam-size), and this is shown as the red (Arm I) and blue (Arm II) points in the figures. The latter is effectively the equivalent of averaging the emission in a series of circular annuli separated by 0.5 kpc in which only detected pixels are considered. We do not set undetected pixels to zero since there is considerable difference in the sensitivity of the three CO maps we wish to compare (see Section 2). We note that the CO profiles can be reliably interpreted out to 5–6 kpc, beyond which the number of detected pixels is relatively small.
All radial profiles were produced using de-projected images produced as in Section 3.3 and that emission within the central 1.7 kpc is not considered for the analysis of the spiral structure. In the case of the CO ratios, we only consider pixels that are detected above 3 in both input CO maps.
| Exponential disk determined in: | Scale length | disk/total mass fraction |
|---|---|---|
| (kpc) | % | |
| Molecular gas (CO =3-2) | 6.90.4 | 14 |
| Molecular gas (CO =2-1) | 5.30.1 | 25 |
| Total gas (CO =2-1 and H i) | 7.4 | 61 |
| Dust | 6.2 | 55 |
6.2 Radial variation of CO, H i and PAH emission
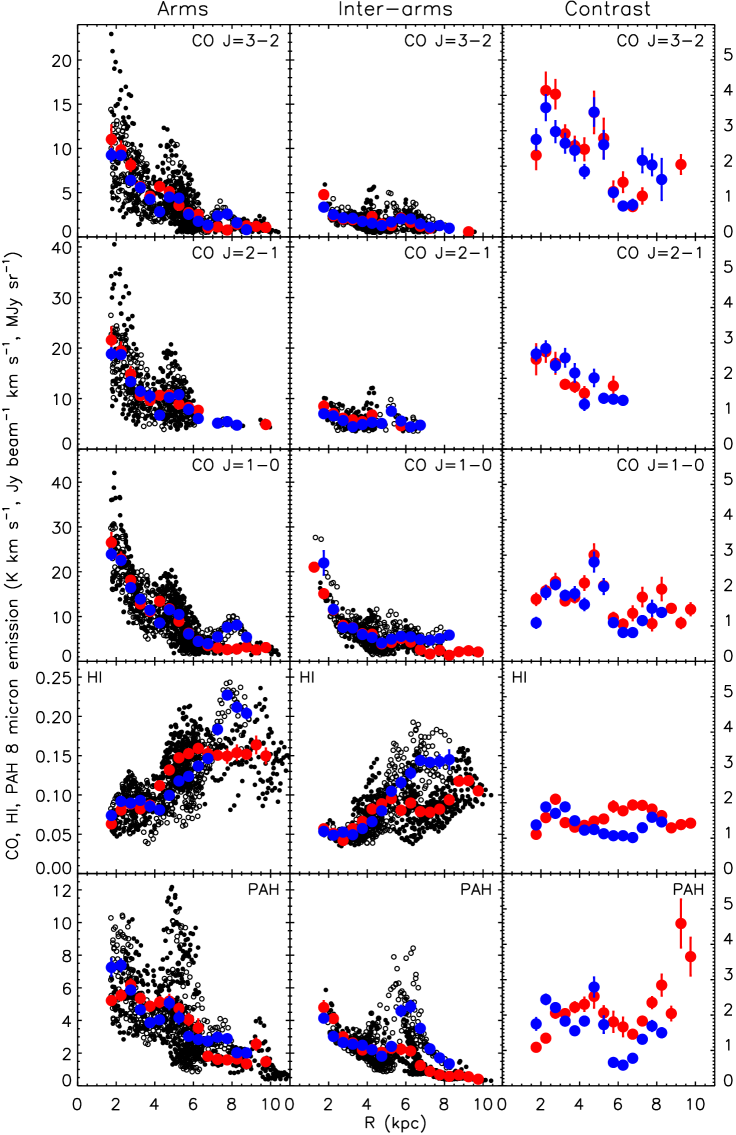
Figure 10 shows the radial profiles of the CO =3-2, CO =2-1, CO =1-0 and H i integrated intensities. The CO profiles of the two spiral arms are generally similar, with CO intensity decreasing with radius but with a strong ‘humps’ at 5 kpc and 8 kpc. The H i profiles also show some evidence of a broad humps at these radii. The former is the radius at which two strong regions of CO emission are seen in the spiral arms, to the north-east and the south-west of the centre. Two notable differences are that the scatter appears to increase somewhat towards higher CO transitions, and there appears to be less scatter for the Arm II than Arm I. This is probably related to the interaction with the companion to the north of M 51. Conversely, there is remarkably little scatter for the inter-arm emission, with the shape of the profile broadly following that seen in the spiral arms (but without the broad hump). This is what may be expected if the inter-arm emission is diffuse emission underlying the disk. Despite these differences, the total profile (Figure 10) for the whole galaxy disk shows a strong similarity between the shapes of the binned CO profiles on 0.5 kpc scales. The emission scale lengths we measure for CO =3-2 and CO =2-1 are shown in Table 4. For comparison we also show the scale lengths of the total gas exponential disk presented by Hitschfeld et al. (2009) and the exponential dust disk presented by Meijerink et al. (2005).
The PAH 8µm surface density profile is seen to be similar to the profiles of CO =3-2 intensity but is very different to the profile of H i emission, suggesting that in M 51 PAH emission is not associated with H i. While the radial profiles of CO =3-2 and PAH 8µm emission are similar to one another, the radial profile of the H i emission is clearly very different (Figure 10), as is also obvious from simple inspection of the images in Figure 3. As previously noted in Section 3.3, it is also clear from Figure 10 that the intensities of CO and H i are anti-correlated, i.e. that the two species are complementary, which suggests that the ratio H i/H2 is a strong, and apparently continuous, function of radius.
6.3 Radial variation of arm–inter-arm contrast
In the right-hand panel of Figure 10 we show the contrast between arm and inter-arm emission as a function of radius for the two spiral arms and inter-arm regions. Contrast is defined as the ratio of the mean spiral arm velocity-integrated intensity versus the mean inter-arm integrated intensity in bins of 0.5 kpc (i.e. the ratio of the red points shown in Figure 10). The average arm/inter-arm contrast values for CO =3-2, CO =2-1, CO =1-0 and H i emission, as well as PAH 8µm surface density, are given in Table 5. As expected from simple inspection of the images in Figures 1–2 there appears to be a trend for arm-interarm contrast to increase towards higher CO transitions. For CO =2-1, a value of 2.9 was previously found by Hitschfeld et al. (2009) who used used the same dataset as the present work but with different method of defining the arm and inter-arm regions, while we find a value of 2.1. Both values are in reasonable agreement with Garcia-Burillo et al. (1993b).
It is clear that for H i and CO =1-0 emission there is little variation in the arm-inter-arm contrast with radius over 10 kpc. Conversely, for the higher CO transitions the contrast is high in the central few kiloparsecs and clearly decreases towards larger radii. The trend is particularly clear for CO =3-2 emission, which decreases from a contrast of 4 at 2 kpc to 1 at 6.5 kpc (the co-rotation radius).
6.4 Radial variation of CO line ratios
| Transition | Arm-interarm contrast |
|---|---|
| CO =3-2 | 2.41.1 |
| CO =2-1 | 2.10.5 |
| CO =1-0 | 1.70.5 |
| H i | 1.60.3 |
| PAH 8µm | 2.20.8 |
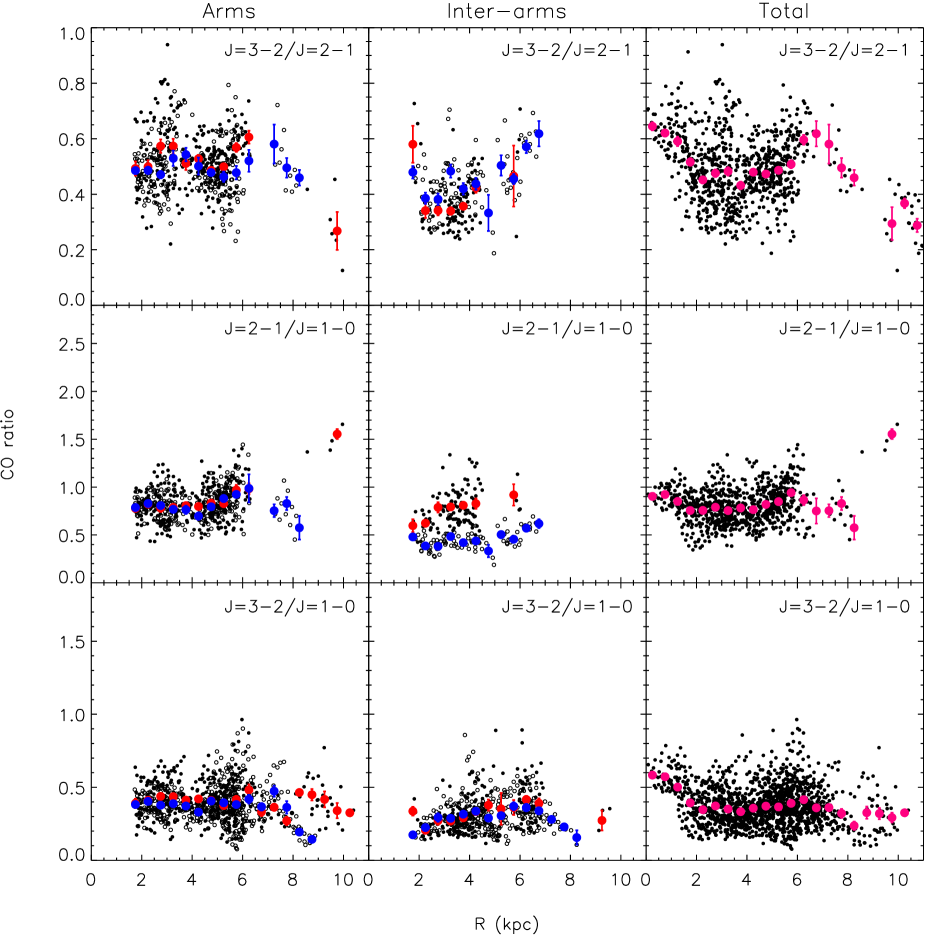
In Figure 11 we show the CO ratios , , and as a function of distance along the spiral arms and inter-arm regions. The last column shows the radial profile for the entire galaxy. Despite considerable scatter in the individual pixel values, averaged on 0.5 kpc scales the variation in CO ratio in the spiral arms is surprisingly small, typically much less than a factor of two, both within an individual spiral arm and compared between the two spiral arms. The main notable difference between Arm I and Arm II occurs for at 7 kpc, near the co-rotation radius. Here, the value of for Arm I decreases by a factor of about two while for Arm II the ratio increases by a similar factor. While the values for the other CO ratios also increase for Arm II at this radius, for Arm I virtually no significant CO =2-1 emission is detected beyond 6 kpc. The CO ratio profiles for the total galaxy disk again emphasize that the variation on 0.5 kpc scales appears to be within a factor of two, whether in individual spiral structures or averaged over the whole galaxy. It is interesting to note, however, that while the total profile is almost flat from 2–4 kpc in all three transitions, in the individual spiral arms there is nonetheless some variation – in the case of as much as a factor of two. Comparing Arm I and Arm II it is clear why this is – in the eastern arm the ratio is decreasing while in the western arm it is increasing. Thus, this shows that in only taking radial averages over the whole galaxy one would ‘miss’ a factor of two variation between the two spiral arms.
Median line ratios are 0.5 in the spiral arms and 0.4 in the inter-arm regions. For , average values are 0.4 in the spiral arms and 0.3 in the inter-arm regions. We note that we find lower median values of and for inter-arm I than for inter-arm II. While this may hint at a small systematic difference in the average CO ratio between the arm and inter-arm regions we note that the difference is only of the order of one standard deviation (Section 5). Lower line ratios suggests that the molecular gas may on average be cooler and/or less dense, so it is not unexpected to find higher values in the spiral arms which are clearly the sites of star formation (see e.g. Figures 4 and 5) and thus should host warmer, denser, gas. Our values of and are somewhat lower than found in previous works – Garcia-Burillo et al. (1993a) and Kramer et al. (2005) find values of 0.7 over the whole disk and in the central region, respectively.
| Radius | A | B | |
| (kpc) | |||
| Relationship between CO =3-2/=1-0 ratio and CO =3-2 intensity: | |||
| R1.7 | 0.568(0.024) | -1.019(0.032) | 0.89 |
| 1.7R2.7 | 0.515(0.020) | -0.878(0.019) | 0.89 |
| 2.7R3.7 | 0.549(0.019) | -0.761(0.011) | 0.80 |
| 3.7R4.7 | 0.555(0.038) | -0.683(0.016) | 0.58 |
| 4.7R5.7 | 0.551(0.022) | -0.678(0.010) | 0.68 |
| 5.7R6.7 | 0.791(0.042) | -0.630(0.013) | 0.69 |
| R6.7 | 1.104(0.104) | -0.591(0.017) | 0.46 |
| Relationship between PAH 8µm and CO =3-2 intensity: | |||
| R1.7 | 0.869(0.044) | 0.016(0.059) | 0.85 |
| 1.7R2.7 | 0.556(0.024) | 0.285(0.019) | 0.80 |
| 2.7R3.7 | 0.643(0.017) | 0.230(0.011) | 0.91 |
| 3.7R4.7 | 0.711(0.019) | 0.202(0.010) | 0.89 |
| 4.7R5.7 | 0.805(0.021) | 0.209(0.012) | 0.88 |
| 5.7R6.7 | 0.895(0.031) | 0.249(0.013) | 0.77 |
| R6.7 | 0.989(0.049) | 0.160(0.015) | 0.45 |
| All | 0.718(0.09) | 0.220(0.005) | 0.89 |
Column 1: radial intervals (in kpc); Columns 2 and 3: parameters of linear fits to log() versus log(CO =3-2 intensity) and log(PAH 8µm surface brightness) versus log(CO =3-2 intensity); uncertainties are given in parentheses; Column 4: Pearson correlation coefficient.
However, as can be seen in the last panel of Figure 11, our value of in the central kiloparsec is 0.6, with values for individual lines of sight in the inner spiral arms ranging up to 0.8, while our value for are 0.5–0.6 in the central kiloparsec. Thus, within the uncertainties, we find our values of to be in agreement with those in the literature. Our values of are also in good agreement with those found in previous works. We find median values of 0.4 in the spiral arms, 0.2 in the inter-arms, and 0.54 in the central kiloparsec. For comparison, Garcia-Burillo et al. (1993a) found values of 0.6 in the spiral arms within the central 1′.
For each of the CO line ratios, we generally find no significant difference between the mean values in Arms I and II, nor do we find any significant difference between the two inter-arm regions. Thus, while there is clearly variation between the individual spiral arms at a given radius, as described above, when averaged over distance the CO ratios appear to be similar.
The ratio for the spiral arms shows some evidence of an increasing trend towards larger galactocentric radii, while there is no clear trend for or . The lack of a clear trend for to vary with radius when studied over either all regions of emission, (the right-hand panel of Figure 11) or just the spiral arms (the left-hand panel of Figure 11), is in agreement with the findings for NGC 2403 by Bendo et al. (2010). However, for M 51, in the inter-arm regions there appears to be a trend for all the CO ratios to increase with radius.
6.5 CO line ratios and the factor
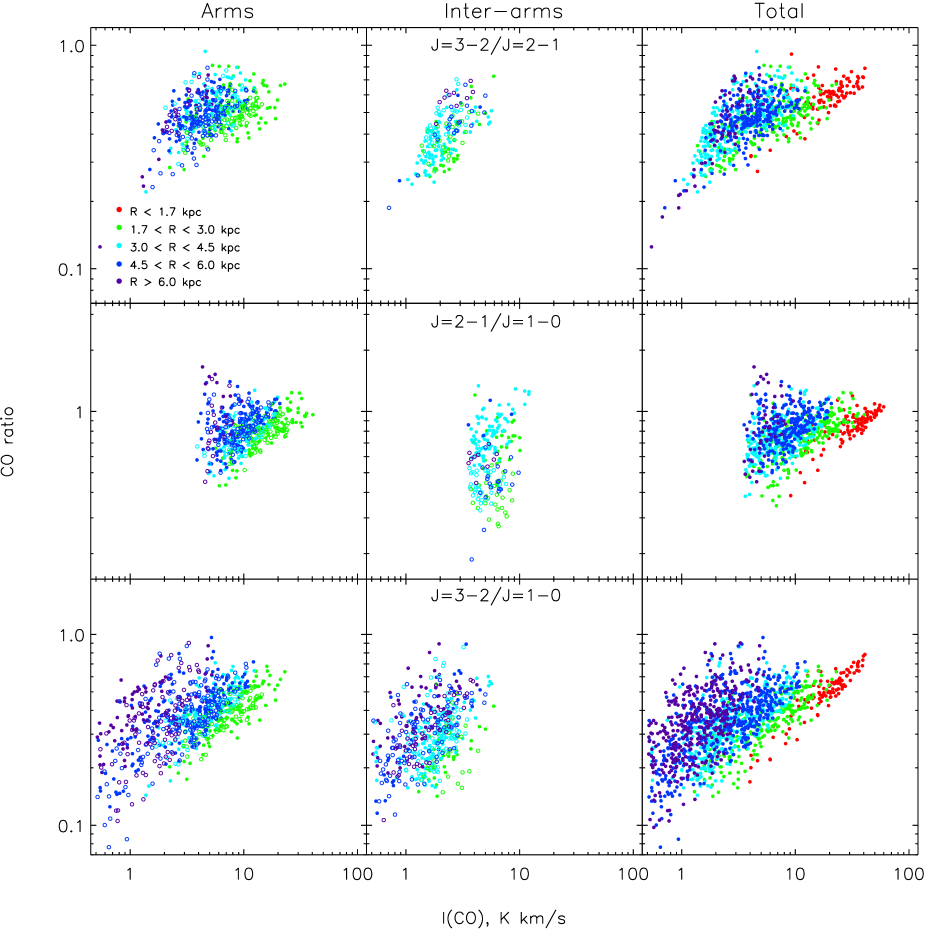
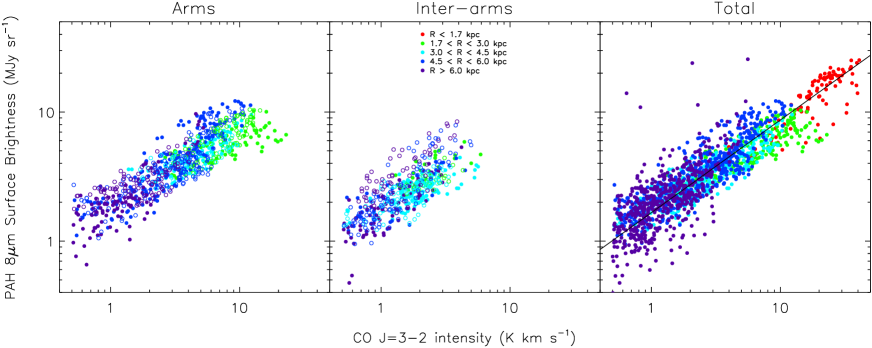
The large pixel-to-pixel variation in the CO ratio described above, together with the suggested different behaviour with radius for the spiral arms and inter-arm regions, implies that obtaining molecular gas column densities from the CO =3-2 data by applying a simple scaling term to match it to the -factor determined for CO =1-0 is likely to introduce large uncertainties for sub-kiloparsec scales. As in Bendo et al. (2010), we investigate this further by looking at the relationship between CO line ratio and CO surface brightness. We plot this for , and in Figure 12. In the first two columns we plot separately the regions of spiral arm and inter-arm emission, as described for the previous figures, and in the last column we show the entire galaxy disk (where emission is detected at 3 in both CO lines), colour coded for galactocentric radius. We can immediately note several features of the distribution of the CO ratio with CO surface brightness that was not apparent for the relationship with galactocentric radius (Figure 11). First, in the inter-arm regions, for a given CO line intensity the CO ratios and tend to be higher in Arm II than in Arm I. This difference is not apparent for the inter-arm in , and is also not obvious for the spiral arms. Second, for and the slope of the relationship between CO ratio and CO surface brightness appears to be steeper for the inter-arm regions than for the spiral arms. Thirdly, for all three CO ratios we see that the relationship with CO surface density clearly varies with galactocentric radius, and that the dependence of the relationship on radius appears to be greater for and than for . At the centre of the galaxy, where the highest CO surface densities are located, there is little variation in the CO ratio for a given CO line intensity. However, as galactocentric distance increases, and CO surface densities decrease, there is increasingly large variation in the CO ratio for a given .
| Radius | A | B | C |
|---|---|---|---|
| (kpc) | |||
| R1.7 | 0.6 | 0.19 | 1.3 |
| 1.7R2.7 | 0.6 | 0.12 | 1.2 |
| 2.7R3.7 | 0.6 | 0.12 | 1.2 |
| 3.7R4.7 | 0.6 | 0.12 | 1.2 |
| 4.7R5.7 | 0.6 | 0.12 | 1.3 |
| 5.7R6.7 | 0.9 | 0.10 | 1.3 |
| R6.7 | 1.2 | 0.09 | 1.3 |
Column 1: radial intervals (in kpc). The mean value in each interval is used; this is the central value in each radial interval, except for R1.7 kpc where the mean radius is 1.1 kpc and R6.7 kpc where the mean radius os 7.6 kpc; Columns 2, 3 and 4: parameters of the linear fits to Equation 2).
In Section 5 we noted an apparent trend for in the inter-arm regions to increase with radius. From inspection of Figure 12 (lower middle panel) we can now see clearer evidence of this. Here, for a given CO intensity high values of the ratio always occur at higher radii. This is in contrast to the behaviour seen in the spiral arms (lower left panel of Figure 12), where larger radii exhibit higher ratios for lower CO intensities than small radii, and likewise smaller radii exhibit low ratios for higher CO intensities than large radii. These trends can be explained as follows. The general dropoff in all CO ratios with radius, for both spiral arms and inter-arm regions, is likely explained by the decreasing beam-averaged molecular gas column density with radius. For the spiral arms, which contain star-forming regions, high ratio values reflect high gas densities and/or temperatures. The trend with radius suggests that active star-formation sites occur at lower CO intensities at larger radii, which may reflect an underlying star formation threshold (e.g. the Toomre Q parameter; Toomre & Toomre, 1972). One would not expect the same trend in the inter-arm regions since they contain little or no active star formation (see Figure 9, which shows that with the exception of inter-arm II to the north-east at large radii there are no significant regions of star formation that are not included within our spiral arm mask). There are a number of possible explanations for the apparent trend with radius in the inter-arm regions. One possibility is that the temperature and/or density is increasing with radius, but this does not seem likely in the inter-arm regions. Another possibility is that the inter-arm medium consists of a diffuse molecular medium (dominating the lowest emission lines most) in which dense clouds are embedded. Loss of the diffuse medium at large radii would result in the observed behaviour. An alternative possibility is that the CO begins to become optically thin at large radii. Under typical excitation conditions all low CO lines are optically thick, and if the density and temperature are high enough CO =3-2 will have higher optial depth than the lower lines. Thus, if cloud column densities in the inter-arm region decrease with radius, CO =1-0 may become optically thin while CO =3-2 remains optically thick, hence producing the observevd trend.
Variation of the CO ratio with CO surface density suggests a relation to star formation and local heating. Variation with radius, on the other hand, suggests a relation to a more diffuse component in the disk. Thus, Figure 12 clearly suggests that the CO =1-0 line emission is also tracing a more diffuse and radius-dependent component of molecular gas than the higher CO transitions.
While it is clear that the variation of CO ratio with CO surface density is dependent on galactocentric distance, the important result from this plot is that a simple relationship between the CO ratio and the CO =3-2 integrated intensity cannot be used to scale the CO =1-0-derived -factor for use in determining molecular gas surface density from the CO =3-2 line without talking into account the spatial location of the emission in the galaxy – the variation in the relationship implies that applying a global scaling for sub-kiloparsec scales will overestimate the molecular gas surface density at large galactocentric radii and underestimate it at small radii.
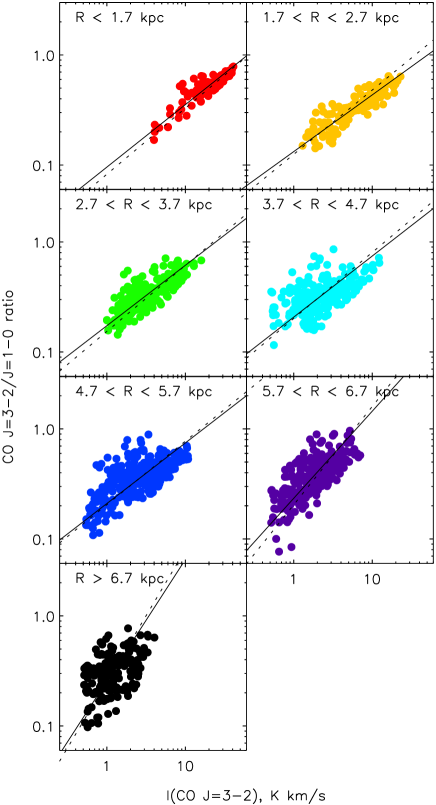
In Figure 13 we investigate the radial dependence of the relationship between CO ratio and CO =3-2 intensity, by plotting the data at radial intervals of 1 kpc and fitting a bi-variate linear function for each bin (shown as solid lines in Figure 13). The parameters of the linear fits are given in Table 6. We find that the Pearson’s correlation coefficient decreases considerably with galactocentric radius, from 0.95 in the centre to 0.5 at 7 kpc.
The dashed lines in Figure 13 show radius dependent relations given by a linear function of the CO ratio with both CO =3-2 intensity and galactocentric radius such that
| (2) |
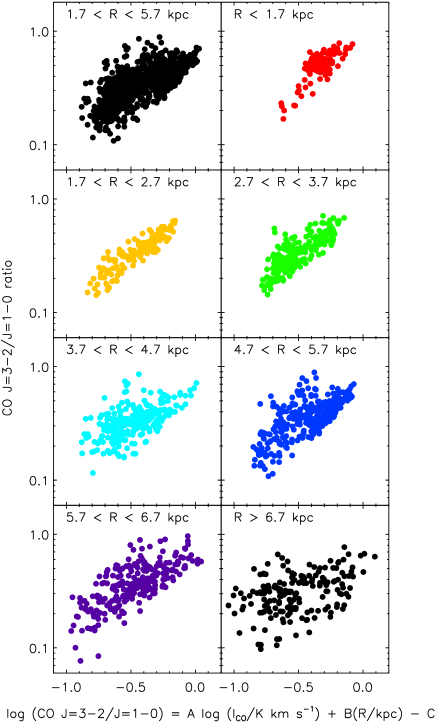
for the parameters given in Table 7. We find that a relationship with a slope of 0.6 reasonably describes the emission between radii of 1.7 and 5.7 kpc, but that different relationships are needed to describe both the central regions (shallower slope) and regions at radii larger than 6 kpc (steeper slope). Nonetheless, a global fit across all radii yields a slope of 0.6, which is comparable to the value found by Bendo et al. (2010) for NGC 2403. The relationship between the CO ratio and Equation 2 for individual pixels is shown in Figure 14. The scatter in the relationship clearly increases with radius, as indicated by the decreasing correlation coefficient (Table 6).
6.6 Relations between CO =3-2, PAH and 24µm emission as a function of the spiral structure
It is interesting to compare the relationships between PAHs, cold dust, molecular gas and atomic gas emission in M 51 with those in other late-type galaxies, and in particular whether PAH emission is a tracer of gas and dust in the cool ISM. A good target for a simple comparison is the nearby ( 3 Mpc; Freedman et al., 2001) SABcd spiral galaxy NGC 2403, whose relationships between these properties were studied by Bendo et al. (2010). While previous authors have found that PAH emission in nearby galaxies is strongly correlated with cold dust emission (e.g. Bendo et al., 2006; Zhu et al., 2008), and some authors (e.g. Regan et al., 2006) have found a correlation between PAH emission and CO line emission in nearby galaxies, Bendo et al. (2010) find that, in NGC 2403, the CO =3-2 and PAH surface brightnesses are uncorrelated on sub-kpc scales.
For both M 51 and NGC 2403, as for many late-type spiral galaxies, the strongest regions of star formation are located outside the centre of the galaxy. Qualitatively, the structures seen in the CO =3-2, PAH, 24µm and H images for M 51 and NGC 2403 are similar. Exceptions for M 51 are the inner part of Arm II, the south-west where CO emission is seen to trace the spiral arm but relatively little PAH emission is seen, and the very centre where there is a dip in the PAH emission but not CO (the latter difference, however, may be due to the different spatial resolutions). Conversely, an exception for NGC 2403 is a hole in the CO emission at the galaxy centre that is not seen in PAH emission (Bendo et al., 2010).

6.6.1 Relationships between CO =3-2 and PAH 8µm emission
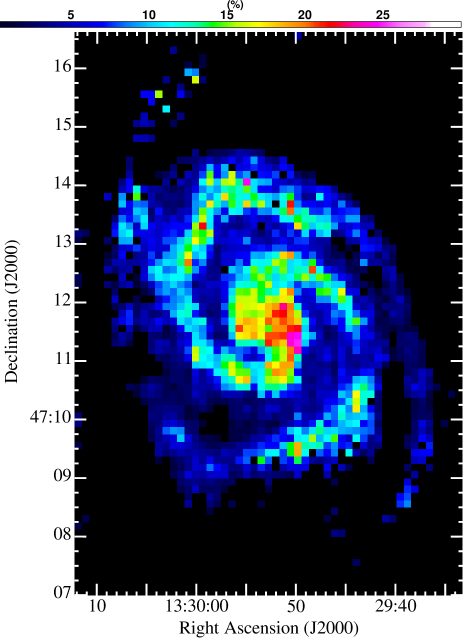
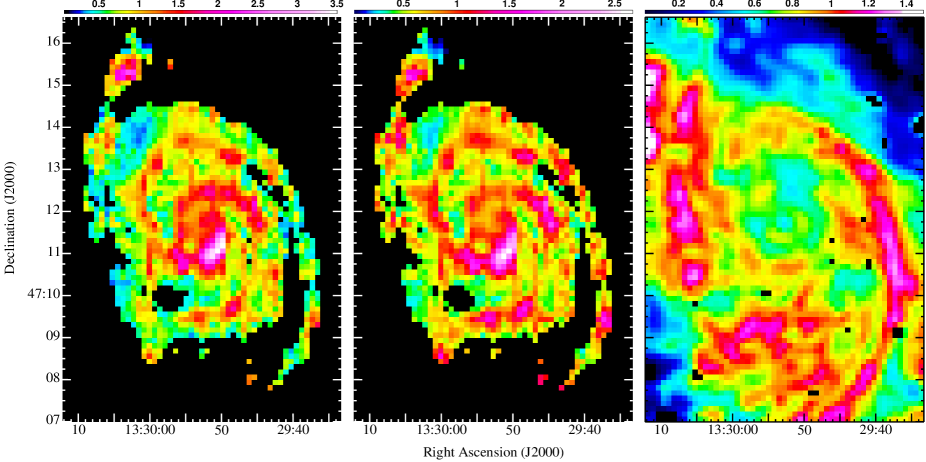
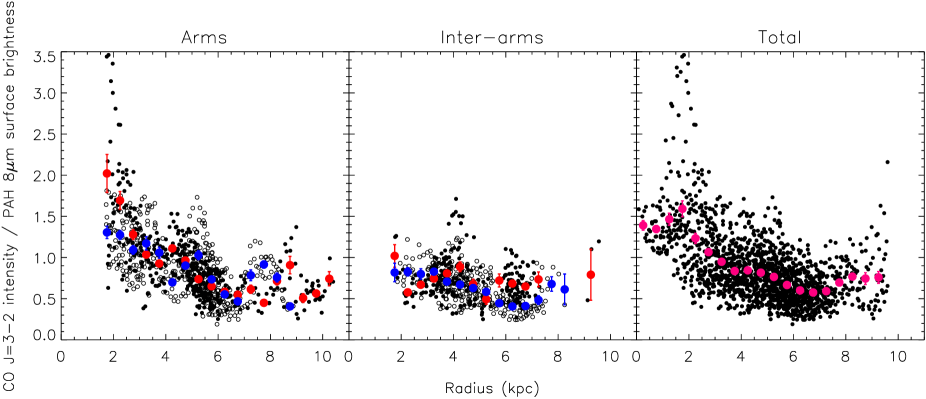
Following Bendo et al. (2010) we used the CO =3-2 integrated intensity and PAH 8µm surface brightness images presented in Figures 1 and 3 to produce a map and radial profile of the CO =3-2/PAH 8µm emission ratio (left-hand panel of Figure 15 and the top panel of Figure 16, respectively). The two input images are in units of K km s-1 and MJy sr-1, respectively. As before, only pixels detected above 3 in the input images are shown.
The CO =3-2/PAH 8µm ratio ranges from 0.04 to 3.5 across M 51, with a median value of 0.8 and standard deviation of 14.1.
The CO =3-2/PAH 8µm ratio appears to broadly follow the spiral structure, with the highest values in the spiral arms and the lowest values in the inter-arm regions.
In the spiral arms we find a mean CO =3-2/PAH 8µm ratio of unity, and values of 0.7 in the inter-arm regions. The ratio appears to decrease with radius for the spiral arms, falling by a factor of about two between 2 and 6 kpc. There appears to be no obvious overall trend with radius for the inter-arm regions, but we note, however, that the presence of strong features in the inter-arm profile at 4 and 6 kpc, which are similar to features in the spiral arms, suggests that the spiral arms traced in PAH 8µm emission may be broader than for CO emission. It is clear that the variation of the ratio of CO =3-2 to PAH 8µm emission in M 51 is very different to the profile that was found for NGC 2403 by Bendo et al. (2010), who showed that in that galaxy the ratio increases with radius but decreases sharply in the central region; NGC 2403 typically has lower ratio values than found for M 51. It seems likely that the CO =3-2 and PAH 8µm properties for M 51 are very different from those for NGC 2403. While Bendo et al. (2010) showed that, for NGC 2403, the CO =3-2 and PAH 8µm emission does not trace the same structures on small spatial scales, in the present work for M 51 we find that the CO =3-2 and PAH 8µm emission do trace the same structures on sub-kiloparsec scales, as is also clear from simple visual inspection of Figures 3–5.
The most striking feature is that the highest values of the CO =3-2/PAH 8µm ratio are located 1.5–2 kpc to the south-west, in Arm I (see Figure 15). Here, ratio values are up to a factor of two higher than typically seen elsewhere in the spiral arms. From inspection of Figure 3, it is evident that this region of enhanced CO =3-2-to-PAH 8µm emission corresponds to a region of reduced PAH 8µm and 24µm surface brightness. Here, there are no strong features apparent in the H image, but an integral field spectroscopy study of nebular emission lines in the central regions by Blanc et al. (2009) does show an H emission feature at this location after extinction correction and subtraction of a contribution from diffuse ionised gas. This is also just south along the spiral arm from the location where we have noted the highest CO =3-2 and CO =2-1 arm/inter-arm contrast (Section 3). Conversely, two obvious regions of low CO =3-2/PAH 8µm ratio occur at symmetrically opposite locations 6 kpc to the north-east (Arm I) and south-west (Arm II) that are coincident with the locations of bright peaks in the PAH 8µm, 24µm and H images that are not peaks in CO.
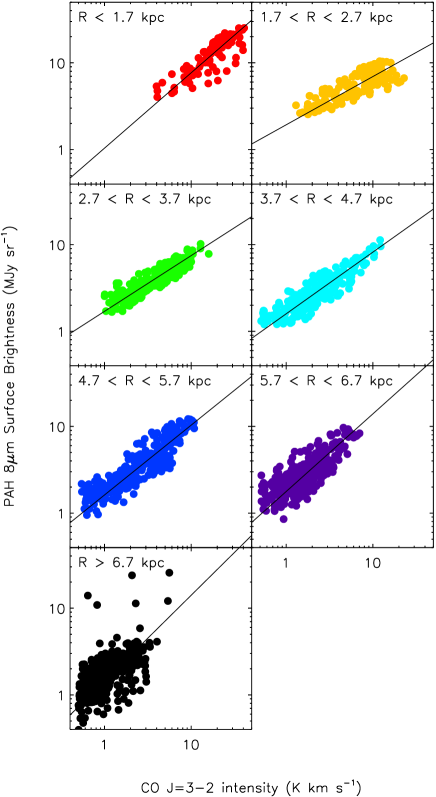
In the top panel of Figure 17 we plot the relationship between CO =3-2 and PAH 8µm surface brightness, colour-coded for different radial intervals as in previous figures. We find a strong correlation, with a Pearson correlation coefficient of 0.89 and the best-fitting bi-variate least squares relation is described by
| (3) |
. The largest scatter arises at the largest radii, both from the outermost parts of the galaxy disk and from inter-arm region II at large radii. The extreme outliers correspond to pixels in the outer-most regions of the disk. The remainder of the scatter appears to arise from a more subtle dependence of the relationship on radius. We examine this further in Figure 18 by fitting separate linear relationships to different radial intervals, whose parameters are given in Table 6. We find strong correlations (Pearson’s correlation coefficients of 0.8–0.9) in every radial interval with the exception of the largest radii (0.45 at R6.7 kpc). We note that the extreme outliers in the R6.7 kpc radial bin correspond to pixels in the outer-most regions of the disk.
With the exception of the innermost bin, , the slope of the relationship increases with increasing radius. The steep innermost bin corresponds to the region of the nuclear disk which is rich in molecular gas and exhibits high CO =3-2/PAH 8µm ratios over most of the region, as seen in the left-hand panel of Figure 15. The outliers below the fitted relation in this bin (red points) correspond to the region of highest CO =3-2/PAH 8µm ratios (and also the region of highest CO arm-interarm contrast) described above.
The results in the present work support the idea that PAH emission is a good tracer of molecular gas, and that, for M 51 at least, the correlation between CO =3-2 and PAH 8µm emission holds on sub-kpc scales and across different physical regions (whether in the nuclear region, spiral arms or inter-arm regions) in the galaxy. With the exception of one region of enhanced CO =3-2/PAH 8µm ratio, the dependence of the relationship appears to be one of galactocentric radius.
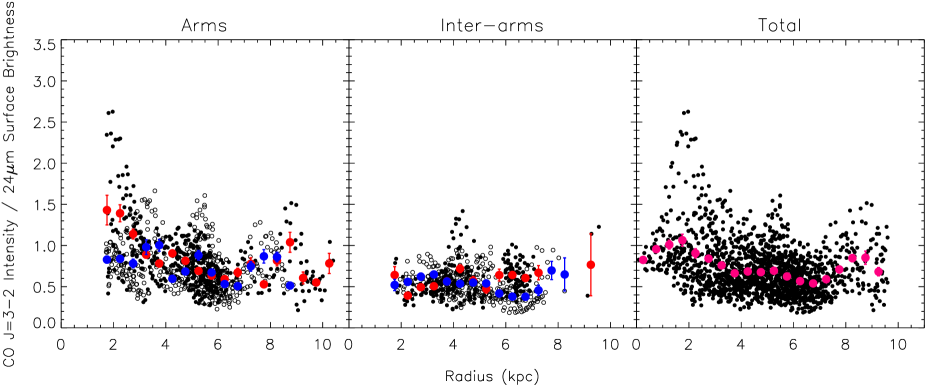
One explanation for the relationship between CO =3-2 and PAH 8µm emission could be if the formation of molecular clouds occurs in regions with stellar potential wells (Leroy et al., 2008). The CO emission then arises from the new molecular clouds and the increase in stellar emission in the potential wells heats the diffuse ISM, with enhanced PAH emission occurring in the regions where the strength of the interstellar radiation field is increased (e.g. Bendo et al., 2008). If this is the case in M 51, then the strong correlation between PAH and CO emission on sub-kiloparsec scales suggests that the two processes are occurring in physically similar locations. Further evidence of this is the similar behaviour of CO =3-2 with 24µm emission, shown in the centre panels of Figures 15 and 16. The relationship between CO =3-2 and 24µm emission (lower panel of Figure 17, again colour coded for different radial intervals) is described by the best-fitting bi-variate least squares relation
| (4) |
with a Pearson correlation coefficient of 0.89. The relationship appears to vary with radius in a very similar way to that seen for PAH 8µm emission. Again, the extreme outliers in the R6.7 kpc radial bin correspond to pixels in the outer-most regions of the disk. An explanation of the decrease of both the CO =3-2/PAH 8µm and 24µm/PAH 8µm ratios with radius would be if the PAHs are excited not only by UV photons (from massive star-forming regions and hence traced by CO =3-2 and 24µm emission) but also by softer optical photons which become relatively more important in the outer regions of the galaxy (see e.g. Uchida et al., 1998; Li & Draine, 2002).
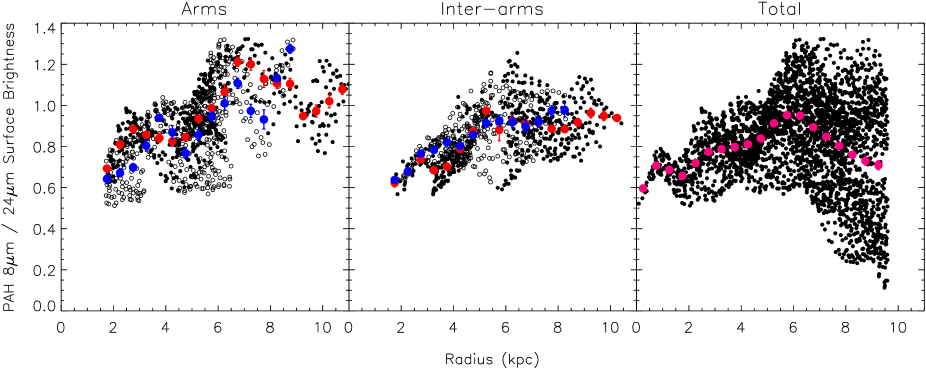
6.6.2 The relationship between PAH 8µm and 24µm emission
Previous authors have found that PAH emission does not trace star formation on sub-kiloparsec scales. We investigate this for the case of M 51 via the relationship between PAH 8µm and 24µm surface density. It is thought that PAHs originate in the outflows of carbon-rich AGB stars and their descendants or in interstellar shocks (e.g. Tielens, 2008, and references therein). 24µm emission traces recent dust enshrouded star formation, though may also include a component of diffuse emission that is not associated with recent star formation. We examine the relationship between PAH 8µm and 24µm emission in the right-hand panel of Figure 15 and the lower panel of Figure 16, which respectively show a map of the ratio of PAH 8µm to 24µm surface density (using images that both have units of MJy sr-1) and the radial profile of this ratio. The median ratio is 0.78, with a standard deviation of 0.28, and values for individual pixels range from 0.1 to 1.8. There are several things that are immediately striking. First, the surface density of PAH 8µm emission dominates over 24µm emission (i.e. PAH 8µm to 24µm surface density ratios greater than unity) in the two outer spiral arms and in regions of prominent spurs bridging the two spiral arms. Elsewhere in the spiral arms there are are few pixels with values of about unity, but none within the central 2 kpc. Second, apart from the two outer arms, regions dominant in PAH 8µm emission appear to be concentrated to the south of the galaxy, away from the companion. Third, 24µm surface density is larger than the surface density of PAH 8µm emission at the locations of all the bright 24 µm peaks, but there are nonetheless some 24µm peaks at whose locations PAH 8µm surface density appears to be dominate. It is also clear that the ratio of PAH 8µm emission to 24µm emission increases with radius (lower panel of Figure 16), which is contrary to the findings of Bendo et al. (2010) for NGC 2403. Lastly, it is also striking that the variation of this ratio as a function of distance along the spiral arms and interarms is most similar to the radial profile of the H i emission (see Figure 10).
7 Summary
We have presented a new CO =3-2 molecular line map of the nearby grand-design spiral galaxy M 51 obtained with HARP-B on the JCMT. This map, covering an area of 1410 kpc and having a spatial resolution of 600 pc, is the first CO map in the CO =3-2 transition to cover the full extent of the disk in M 51.
We have used the CO =3-2 map together with CO =2-1 and CO =1-0 data and other data from the literature to investigate the molecular gas properties of M 51 as a function of distance along the spiral arms, adopting a simple approach for defining the spiral structure. We have found the following results:
-
•
We detect CO =3-2 emission over an area of 2114 kpc, across the entire disk of M 51 out to its companion NGC 5195. The distribution of CO =3-2 emission follows a clear two-armed spiral structure with broad (1 kpc) arms, and is in close agreement with the distribution of CO =2-1 emission. We detect inter-arm CO =3-2 emission everywhere within a central area of 1410 kpc, as well as several spurs, or bridges, of CO emission connecting the spiral arms.
-
•
We find that the contamination of submm continuum by in-band CO =3-2 emission ranges from up to 20% in the spiral arms to 10% in the inter-arm regions.
-
•
By projecting the CO integrated intensity maps of M 51 to various edge-on orientations, we have shown that the major axis profile of a galaxy with bright molecular gas rich spiral arms can mimic a molecular ring for some viewing angles.
-
•
For the CO =3-2 and CO =2-1 transitions there is a clear difference between the variation of arm and inter-arm emission with galactocentric radius, with the spiral arm emission decreasing with radius and the inter-arm emission relatively constant with radius. Conversely, for CO =1-0 line and H i emission the arm and inter-arm regions appears to follow a similar trend with radius.
-
•
The contrast between spiral arm and inter-arm CO =3-2 intensity decreases with galactocentric radius, falling by a factor of 3 over two kiloparsecs, There is a similar but less pronounced trend for CO =2-1 line emission, but for CO =1-0 and H i emission the arm–inter-arm contrast appears relatively constant with radius.
-
•
At this spatial resolution, the CO =3-2/=2-1 line ratio varies from 0.1–1.0, with average values of 0.5 over the whole disk, 0.5 in the spiral arms, and 0.6 in the central 1′. In the inter-arm regions, values range from 0.2–0.6.
-
•
There is no clear evidence that the CO line ratios vary as a function of distance along the spiral arms, but there does appear to be a trend for CO line ratios in the inter-arm regions to increase with radius.
-
•
We find a strong relationship between the CO =3-2 integrated intensity and the PAH 8µm surface brightness. The ratio of CO =3-2 to PAH 8µm emission decreases with radius, and we find a strong relationship between this ratio and the CO =3-2 intensity that varies with galactocentric radius.
-
•
A similar but slightly steeper relationship is found between CO =3-2 and 24µm surface brightness, with the ratio of PAH 8µm to 24µm surface brightness increasing with radius.
Acknowledgments
The James Clerk Maxwell Telescope is operated by The Joint Astronomy Centre on behalf of the Science and Technology Facilities Council of the United Kingdom, the Netherlands Organisation for Scientific Research, and the National Research Council of Canada. The HARP-B data was obtained under program ID M06BN005. This work made use of THINGS, ‘The HI Nearby Galaxy Survey’ (Walter et al., 2008).
References
- Aalto et al. (1999) Aalto, S., Hüttemeister, S., Scoville, N. Z., & Thaddeus, P. 1999, ApJ, 522, 165
- Arimoto et al. (1996) Arimoto, N., Sofue, Y., & Tsujimoto, T., 1996, PASJ, 48, 275
- Bastian et al. (2005) Bastian, N., Gieles, M., Efremov, Y. N., & Lamers, H. J. G. L. M. 2005, A&A, 443, 79
- Bell et al. (2006) Bell, T. A., Roueff, E., Viti, S., & Williams, D. A. 2006, MNRAS, 371, 1865
- Bendo et al. (2006) Bendo, G. J., et al. 2006, ApJ, 652, 283
- Bendo et al. (2008) Bendo, G. J., et al. 2008, MNRAS, 389, 629
- Bendo et al. (2010) Bendo, G. J., et al. 2010, MNRAS, 402, 1409
- Blanc et al. (2009) Blanc, G.A., Heiderman, A., Gebhardt K., Evans II, N.J., Adams, J. 2009, ApJ, 704, 842
- Buckle et al. (2009) Buckle, J. V., Hills, R. E., Smith, H., et al. 2009, MNRAS, 399, 1026
- Calzetti et al. (2005) Calzetti, D., et al. 2005, ApJ, 633, 871
- Currie et al. (2008) Currie, M. J., Draper, P. W., Berry, D. S., Jenness, T., Cavanagh, B., & Economou, F. 2008, in Astronomical Data Analysis Software and Systems, ASP Conference Series, Vol. 394, eds. R. W., Argyle, P. S. Bunclark, & J. R. Lewis, 650
- Dumke et al. (2001) Dumke, M., Nieten, C., Thuma, G., Wielebinski, R., & Walsh, W. 2001, A&A, 373, 853
- de Vaucouleurs et al. (1991) de Vaucouleurs G., de Vaucouleurs, A., Corwin, H. J., et al. 1991, Third Reference Catalogue of Bright Galaxies, Springer-Verlag, New York
- Egusa et al. (2009) Egusa, F., et al., 2009, ApJ, 697, 1870
- Freedman et al. (2001) Freedman W. L., et al. 2001, ApJ, 553, 47
- Foyle et al. (2010) Foyle, K., Rix, H. -W., Walter, F., & Leroy, A. 2010, ApJ, 725, 534
- Garcia-Burillo et al. (1993a) Garcia-Burillo, S., Guélin, M., & Cernicharo, J. 1993, A&A, 274, 123
- Garcia-Burillo et al. (1993b) Garcia-Burillo, S., Combes, F., & Gerin, M. 1993, A&A, 274, 148
- Gordon et al. (2008) Gordon, K. D., Engelbracht, C.W., Rieke, G. H., Misselt, K. A., Smith, J. -D., T., Kennicutt, R. C., Jr. 2008, ApJ, 682, 336
- Guélin et al. (1995) Guélin, M., Zylka, R., Mezger, P.G., Haslam, C.G.T., & Kreysa, E. 1995, A&A, 298, L29
- Helfer et al. (2003) Helfer, T. T. et al. 2003, ApJS, 145, 327
- Helou et al. (2004) Helou, G., et al. 2004, ApJS, 154, 253
- Hitschfeld et al. (2009) Hitschfeld, M., Kramer, C., Schuster, K.F., Garcia-Burillo, S., & Stutzki, J. 2009, A&A, 495, 795
- Ho et al. (1997) Ho, L., Fillipenko, A., & Sargent, W. 1997,ApJ, 112, 315
- Iono et al. (2009) Iono, D., et al. 2009, ApJ, 695, 1537
- Irwin et al. (2011) Irwin, J. A., et al. 2011, MNRAS, 410, 1423
- Israel & Baas (2002) Israel, F. P., & Baas, F. 2002, A&A, 383, 82
- Israel (2005) Israel, F. P., 2005, A&A, 438, 855
- Israel et al. (2006) Israel, F.P., Tilanus, R.P.J., & Baas, F. 2006, A&A, 445, 907
- Kennicutt et al. (2003) Kennicutt Jr., R. C., Armus, L., Bendo, G. et al. 2003, PASP, 115, 928
- Kennicutt et al. (2007) Kennicutt JR., R.C. et al. 2007, AJ, 671, 348
- Kohno et al. (1996) Kohno, K., Kawabe, R., Tosaki, T., & Okumura, S. 1996, ApJ, 461, 29
- Koda et al. (2012) Koda, J., et al., 2012, ApJ, 761, 41
- Koda et al. (2011) Koda, J., et al., 2011, ApJS, 193, 19
- Koda et al. (2009) Koda, J., et al. 2009, ApJ, 700, L132
- Knapen & Beckman (1996) Knapen, J. H., & Beckman, J. E. 1996, MNRAS, 283, 251
- Kramer et al. (2005) Kramer, C., Mookerjea, B., Bayet ,E., et al. 2005, A&A, 441, 961
- Krist (2002) Krist, J., 2002, Tiny Tim/SIRTIF USer’s Guide, SSC, Pasadena
- Kuno et al. (2007) Kuno, N. et al. 2007, PASJ, 59, 117
- Kuno & Nakai (1997) Kuno, N. & Nakai, N. 1997, PASJ, 49, 279
- Kuno et al. (1995) Kuno, N., Nakai, N., Handa, T., & Sofue, Y. 1995, PASJ, 47, 745
- Leroy et al. (2008) Leroy, A. K., Walter, F., Brinks, E., Bigiel, F., de Blok, W. J. G., Madore, B., & Thornley, M. D. 2008, AJ, 136, 2782
- Li & Draine (2002) Li, A. & Draine, B. T. 2002, ApJ, 572, 232
- Lo et al. (1987) Lo, K. Y., Ball, R., Masson, T. G., Phillips, Scott, S., & Woody, D. P., 1987, ApJ, 317, L63
- Louie, Koda & Egusa (2013) Louie, M., Koda, J. & Egusa, F., et al., 2013, ApJ, 763, 94
- Matsushita et al. (2004) Matsushita, S., et al. 2004, ApJ, 616, 55
- Matsushita et al. (1998) Matsushita, S., Kohno, K., Vila-Vilaro, B., Tosaki, T. & Kawabe, R. 1998, ApJ, 495, 267
- Mauersberger et al. (1999) Mauersberger, R., et al. 1999, A&A, 341, 256
- Meidt et al. (2008) Meidt, S. E., Rand, R. J., Merrifield, M. R., Shetty, R., & Vogel, S. N. 2008, ApJ, 688, 224
- Meijerink et al. (2005) Meijerink, R., et al. 2005, A&A, 430, 427
- Mentuch Cooper et al. (2012) Mentuch Cooper, E., et al., 2012, ApJ, 755, 165
- Muraoka et al. (2009) Muraoka, K., et al. 2009, ApJ,
- Nakai et al. (1994) Nakai, N., Kun, N., Handa, T., & Sofue, Y. 1994, PASJ, 46, 527
- Nakai & Kuno (1994) Nakai, N., Kuno, N. 1994, PASJ, 46, 527
- Nakai & Kuno (1995) Nakai, N., Kuno, N. 1995, PASJ, 47, 761
- Nikola et al. (2001) Nikola, T., Geis, N., Herrmann, F., Madden, S. C., Poglitsch, A., Stacey, G. J., & Townes, C. H. 2001, ApJ, 561, 203
- Rand & Kulkarni (1990) Rand, R.J., & Kulkarni, S.R. 1990, ApJ, 349, L43
- Reach et al. (2005) Reach, W. T., et al. 2005, PASP, 117, 978
- Regan et al. (2001) Regan, M., et al. 2001, ApJ, 561, 218
- Regan et al. (2006) Regan, M., et al. 2006, ApJ, 652, 1112
- Sakamoto et al. (1999) Sakamoto, K. et al. 1999, ApJ, 616, L59
- Schinnerer et al. (2010) Schinnerer, E., Weiß, A., Aalto, S., & Scoville, N. Z. 2010, ApJ, 719, 1588
- Schuster et al. (2007) Schuster, K. F., Kramer, C., Hitschfeld, M., Garcia-Burillo, S., & Mookerjea, B. 2007, A&A, 461, 143
- Shetty et al. (2007) Shetty, R., Vogel, S. N., Ostriker, E. C., & Teuben, P. J. 2007, ApJ, 665, 1138
- Tielens (2008) Tielens, A. G. G. M., 2008, ARAA, 46, 289
- Tilanus & Allen (1991) Tilanus, R. P. J., & Allen, R. J. 1991, A&A, 244, 8
- Thornley & Wilson (1994) Thornley, M. D., & Wilson, C. D. 1994, ApJ, 421, 458
- Toomre & Toomre (1972) Toomre, A., & Toomre, J. 1972, ApJ, 178, 623
- Tully (1974) Tully, R. B., 1974, ApJS, 27, 437
- Tully (1988) Tully, R.B., 1988, Nearby Galaxies Catalog (Cambridge University Press)
- Uchida et al. (1998) Uchida, K. I., Sellgren, K. & Werner, M. 1998, ApJ, 493, L109
- Walter et al. (2008) Walter, F., Brinks, E., de Blok, W. J. G., bigiel, F., Kennicutt, R. C., Jr., Thornley, M. D., & Leroy, A. K. 2008, AJ, 136, 2563
- Warren et al. (2010) Warren, B. E., et al. 2010, ApJ, 714, 571
- Wielebinski et al. (1999) Wielebinski, R., Dunke, M., & Nieten, Ch. 1999, A&A, 347, 634
- Williams et al. (1994) Williams, et al. 1994, ApJ, 428, 693
- Wilson et al. (2009) Wilson, C. D., et al. 2009, ApJ, 693, 1736
- Zhu et al. (2008) Zhu, Y. -N., Wu, H., Cao C., Li H. -N. 2008, ApJ, 686, 155