Physical Conditions in the Interstellar Medium of High-Redshift Galaxies:
Mass Budget and Gas Excitation
Abstract
Following the first pioneering efforts in the 1990s that have focused on the detection of the molecular interstellar medium in high redshift galaxies, recent years have brought great advances in our understanding of the actual physical properties of the gas that set the conditions for star formation. Observations of the ground-state CO =10 line have furnished crucial information on the total masses of the gas reservoirs, as well as reliable dynamical mass and size estimates. Detailed studies of rotational ladders of CO have provided insight on the temperature and density of the gas. Investigations of the very dense gas associated with actively star-forming regions in the interstellar medium, most prominently through HCN and HCO+, have enabled a better understanding of the nature of the extreme starbursts found in many high-redshift galaxies, which exceed the star formation rates of their most active present-day counterparts by an order of magnitude. Key progress in this area has been made through targeted studies of few, well-selected systems with current facilities. With the completion of the Karl G. Jansky Very Large Array and the Atacama Large (sub)Millimeter Array, it will become possible to develop a more general framework for the interpretation of these investigations based on unbiased studies of “normal” star-forming galaxies back to the earliest cosmic epochs.
1 Introduction
The past two decades have shown tremendous progress in studies of galaxy evolution out to high redshift. We have now understood that galaxies formed a lot more stars in the past than they do today (by an order of magnitude or more by 1; e.g., Madau et al. 1996; Lilly et al. 1996), and that the buildup of stellar mass in galaxies through cosmic times took place through both brief, but very intense starburst periods lasting tens to 100 Myr and steady, more quiescent rates of star formation lasting typically half a Gyr or longer (e.g., Daddi et al. 2010a, Genzel et al. 2010). In many cases, the most infrared-luminous starbursts are driven by major mergers. The most extreme starbursts observed at earlier cosmic times are typically by an order of magnitude more infrared-luminous than the most extreme examples observed today (e.g., Blain et al. 2002). In addition, the luminosity threshold above which star-forming galaxies are dominantly major mergers has likely been higher by an order of magnitude or more in the past as well (e.g., Daddi et al. 2007). In recent years, it has been found that this increased activity in galaxies at high redshift can be understood in the context of a higher gas content of galaxies on average, and that even fairly typical high-redshift galaxies contain high fractions of molecular gas (e.g., Daddi et al. 2008, 2010b; Tacconi et al. 2010). Thus, studies of molecular gas in distant galaxies have become an important means towards understanding cosmic star formation at early epochs.
Molecular gas is an important probe of the physical conditions in distant galaxies. Great progress has been made since the initial detections of CO at high redshift more than two decades ago (Brown & Vanden Bout 1991; Solomon et al. 1992). Significant samples of different high-redshift galaxy populations have been detected in CO emission, and detailed follow-up campaigns of subsamples at spatial resolutions of up to 1 kpc have provided detailed insight on the spatial distribution, mass density, and dynamical structure of the gas. Studies of the gas excitation have constrained the physical properties of the interstellar medium, and the detection of other molecules such as HCN, HCO+, HNC, CN, and H2O has enabled studies of the chemical composition (see Solomon & Vanden Bout 2005; Omont 2007; Carilli & Walter 2013 for comprehensive reviews of the subject). The future of the field is bright, now that we have entered a new era in such investigations with the advent of powerful new facilities such as the Karl G. Jansky Very Large Array (JVLA) and the Atacama Large sub/Millimeter Array (ALMA). In the context of this volume, this article highlights some key aspects related to the determination of total molecular gas masses in high- galaxies, and discusses what physical properties can be probed through studies of the gas composition and excitation.
2 Detections of Molecular Gas at High Redshift: a Brief Summary
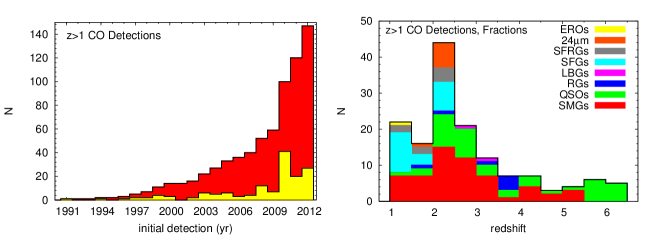
To date,111This census is based on data published in the peer-reviewed literature by the end of 2012, and updates previous compilations shown by Riechers (2011a, 2012). It does not contain galaxies detected in [CII] emission but not CO (e.g., Stacey et al. 2010; Venemans et al. 2012). molecular gas (most commonly CO) has been detected in 150 galaxies at 1 (Fig. 1), back to only 870 million years after the Big Bang (corresponding to =6.42; e.g., Walter et al. 2003, 2004; Bertoldi et al. 2003; Riechers et al. 2009a). Except for few sources highly magnified by strong gravitational lensing (e.g., Baker et al. 2004; Coppin et al. 2007; Riechers et al. 2010a), these are massive galaxies hosting large molecular gas reservoirs (typically 1010 M⊙ or more), commonly with high gas fractions of (at least) tens of per cent. Approximately 20% of the detected systems are massive, gas-rich optically/near-infrared selected star forming galaxies (SFGs; e.g., Daddi et al. 2010b; Tacconi et al. 2010), and 30% each are far-infrared-luminous, star-bursting quasars (QSOs; e.g., Wang et al. 2010; Riechers et al. 2006a; Riechers 2011b) and submillimeter galaxies (SMGs; e.g., Greve et al. 2005; Tacconi et al. 2008; Riechers et al. 2010b; Fig. 1). The rest of CO-detected high-redshift galaxies are limited samples of galaxies selected through a variety of techniques, such as Extremely Red Objects (EROs), Star-Forming Radio-selected Galaxies (SFRGs), 24 m-selected galaxies, gravitationally lensed Lyman-break galaxies (LBGs), and radio galaxies (RGs; see Carilli & Walter 2013 for a recent summary). Besides CO, the high-density gas tracers HCN, HCO+, HNC, CN, and H2O were detected towards a small subsample of these galaxies (e.g., Solomon et al. 2003; Vanden Bout et al. 2004; Riechers et al. 2006b, 2007a, 2010c, 2011a; Guelin et al. 2007; Omont et al. 2011).
3 Total Molecular Gas Masses
Molecular gas is the fuel for star formation, and thus, a key aspect in studies of galaxy evolution. Measurements of total molecular gas masses (and thereby, gas fractions) of galaxies provide the means to understand in what phase of their evolution galaxies are, as they place direct constraints on the amount of material that is left for future star formation, and thus, on how long star formation can be maintained at the current rate, and on how much stellar mass can be assembled without a source of external gas supply.
In the nearby universe, molecular gas masses are most commonly determined based on observations of CO(=10) emission. To determine the mass in H2 gas from the CO(=10) luminosity is not trivial, as the conversion factor () between both quantities depends on the physical conditions in the gas, as well as on the gas phase metallicity (see review by Bolatto et al. 2013). Values for range from 0.3–1.3 M⊙ (K km s-1 pc2)-1 in the most intense starbursts (e.g., Downes & Solomon 1998) to 3.5–4.6 M⊙ (K km s-1 pc2)-1 in quiescently star-forming galaxies (e.g., Solomon & Barrett 1991), and can be even higher in low-metallicity galaxies (e.g., Leroy et al. 2011). However, the CO(=10) line luminosity is still the best-calibrated estimator available in the local universe, and given the limited direct constraints available at high redshift, the most reliable diagnostic to be utilized in distant galaxies as well. Also, our theoretical understanding of variations in among galaxies near and far has been improving in recent years (see, e.g., Narayanan 2013, this volume). Due to the redshifting of molecular lines, high- galaxies are most commonly detected in 3 CO lines, which are shifted to the 3 mm observing window that is accessible with telescopes that are used for the detection of CO(=10) emission in nearby galaxies. Besides , the determination of gas masses from 3 CO lines bears the additional uncertainty of gas excitation, which needs to be known to infer the CO(=10) line luminosity based on the brightness of higher- lines. Without a correction, the CO(=10) line luminosity, and thus, the gas mass, may be underestimated by up to a factor of a few.
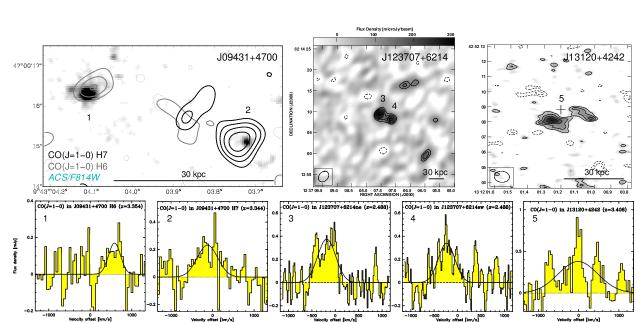
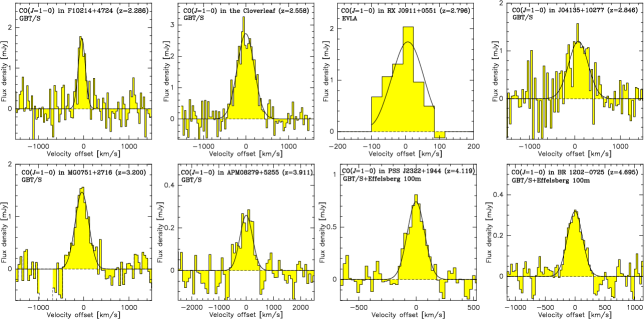
To overcome this limitation, direct studies of CO(=10) emission in high-redshift galaxies, redshifted down to short radio wavelengths (6 mm–2 cm) accessible with the Green Bank Telescope (GBT) and the JVLA have become more common in recent years. After initial detections in less than a handful of galaxies (e.g., Carilli et al. 2002; Riechers et al. 2006a; Hainline et al. 2006), the increased frequency coverage and spectroscopic capabilities of the JVLA upgrade, and the availability of the Zpectrometer wide-band instrument with stable spectral baselines at the GBT have yielded tens of detections in galaxies at redshifts of 1.5, encompassing quasar host galaxies,222Based on higher spatial resolution CO(=32) observations than previously available, the CO emission in J4135+10277 shown in Fig. 2 has recently been found to not be directly associated with the quasar host, but with a nearby, optically faint dust-obscured starburst at the same redshift. This gas-rich star-forming galaxy will likely merge with the quasar host galaxy in the future (Riechers 2013; see Hainline et al. 2004 for original CO =32 detection). SMGs, LBGs, SFGs, and RGs (e.g., Figs. 2, 3; Riechers et al. 2010a, 2011b, 2011c, 2011d, 2011e; Ivison et al. 2010, 2011, 2012; Harris et al. 2010, 2012; Frayer et al. 2011; Aravena et al. 2010). These studies have revealed a wide range in gas excitation properties, showing that the gas masses derived based on the brightness of higher- CO lines were biased low by factors of two or more for many of the systems (e.g., Riechers et al. 2011c, 2011d; Ivison et al. 2011), while others are highly excited, and thus, did not require significant corrections (typically quasar hosts; e.g., Riechers et al. 2006a, 2009b, 2011b; see next section). Spatially resolved mapping with the JVLA also shows that submillimeter-selected galaxies commonly show gas reservoirs that are significantly more spatially extended in CO(=10) than in higher- lines, indicating the presence of significant amounts of cold gas with low excitation (e.g., Riechers et al. 2011c; Ivison et al. 2011). This potentially requires a different conversion factor for different components of the gas, which would imply an even larger correction to gas masses derived from 3 CO lines alone. It also implies that accurate sizes of the gas reservoirs and gas dynamical masses for these galaxies can only be derived based on CO(=10) imaging. In contrast, quasar host galaxies typically do not show evidence for significant fractions of spatially extended, low-excitation gas, which may suggest that gas masses derived from 3 CO lines require little corrections (Riechers et al. 2006a, 2011b). Studies of more quasar host galaxies at high spatial resolution in both low- and high- CO transitions are desirable to investigate this apparent difference between quasars and SMGs with comparable far-infrared luminosities in more detail, and to better understand the role of both populations in the context of the evolution of massive galaxies. The JVLA and ALMA are the ideal tools for such investigations.
4 Molecular Gas Excitation
4.1 CO
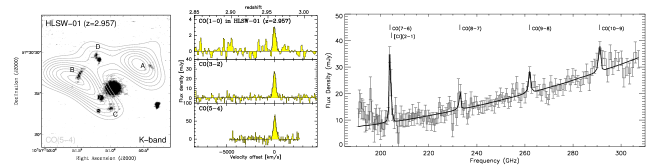
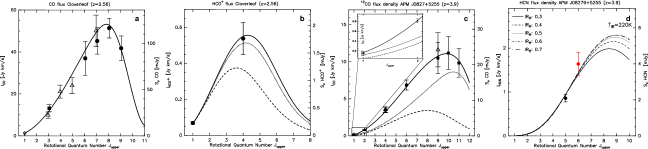
To understand the excitation properties of the molecular gas reservoirs of high-redshift galaxies in more detail, it is necessary to observe multiple molecular lines, most commonly by covering three or more transitions of the rotational ladder of CO. In most cases, these studies are currently limited to the study of spatially integrated properties, rather than variations between different regions of galaxies as done in the most detailed studies of nearby galaxies (e.g., Weiß et al. 2005). In the four best-studied high-redshift systems, all of which are strongly gravitationally lensed, seven or more CO lines have been detected (e.g., Fig. 4; Riechers et al. 2006a, 2011b, 2011e; Weiß et al. 2007; Bradford et al. 2009, 2011; Scott et al. 2011; Danielson et al. 2011). By modeling the intensity of different rotational levels of CO relative to equilibrium (in which case all lines would have the same brightness temperature, and the line fluxes would scale with ), it is possible to constrain the physical properties of the gas (in particular its density and kinetic temperature). The CO lines, when observed in emission, can be excited either by collisions with other molecules, or by the ambient radiation field (e.g., Meijerink & Spaans 2005). In lack of detailed constraints on the gas distribution and local radiation field, the most common approach is to model the collisional excitation of CO using the large velocity gradient (LVG) approximation (e.g., Scoville & Solomon 1974; Goldreich & Kwan 1974). This method utilizes an escape probability formalism (i.e., photons produced locally can only be absorbed locally) resulting from a strong velocity gradient, which helps to minimize the number of free parameters in models of the collisional line excitation. LVG models appear to describe the CO excitation in high-redshift galaxies on global scales fairly well.
As examples, the CO excitation ladders and LVG models for the Cloverleaf quasar (=2.56) and APM 08279+5255 (=3.91) are shown in Fig. 5a and 5c. Like all high- quasars studied in detail so far, the interstellar medium in the host galaxies of these systems is dominated by high-excitation gas components, suggesting that the molecular gas is comparatively dense and warm, with characteristic gas kinetic temperatures of =50 K and densities of typically few times 104 cm-3 (e.g., Riechers et al. 2006a, 2011b; Ao et al. 2008). APM 08279+5255 is an outlier among high- quasars, with evidence for a warm, dense gas component with =220 K (Weiß et al. 2007). Typically, the high-excitation gas components in quasars can account for all of the flux measured in the CO(=10) line as well, showing little evidence for the existence of significant cold, low-excitation components from the CO excitation ladders alone. For comparison, SFGs appear to be dominated by colder, less dense gas components with characteristic =25 K and densities of typically few times 103 cm-3 (Dannerbauer et al. 2009; Aravena et al. 2010). Given the integrated star formation rates of SFGs, the presence of some higher excitation gas is expected, but the relative strength of such components is not constrained well at present. The CO excitation in SMGs is typically intermediate between SFGs and quasars, containing a mix of dense, high excitation gas (even though somewhat lower excitation than in quasars on average) and spatially extended, low excitation gas (e.g., Riechers et al. 2011c). The high-excitation gas components are responsible for the dominant fraction of the line flux in the 2 transitions, but the low-excitation components likely constitute a significant, and sometimes dominant fraction of the total gas mass (Riechers et al. 2011c; Ivison et al. 2011). The emerging picture is that the high-excitation gas components are associated with the regions that are actively forming stars, while the low-excitation gas is found outside these regions and represents cold, commonly diffuse and spatially more extended reservoirs for future star formation.
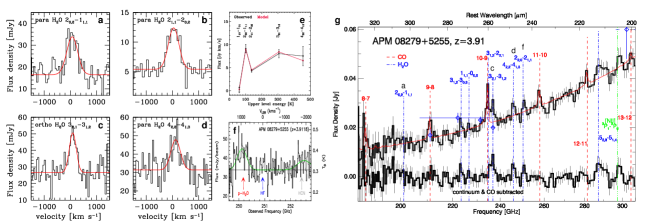
Active Galactic Nuclei (AGN) may contribute to the excitation of CO through their intense radiation fields as well (e.g., Spaans & Meijerink 2008). Studies of 10 CO lines in nearby quasars show evidence for a likely AGN contribution to the excitation of very high- CO lines, but the contribution to lower- CO lines is typically minor (e.g., van der Werf et al. 2010). The only high- system with detected 10 CO lines currently is APM 08279+5255 (Weiß et al. 2007), and its CO excitation is not representative of other high- quasars or SMGs with AGN in them. As such, the role of high- AGN for the excitation of molecular gas in their hosts remains subject to further study. ALMA will be the ideal instrument for such investigations.
4.2 HCN and HCO+
CO is the most commonly employed tracer of molecular gas in galaxies, and a good tracer for the full amount of molecular gas that is present, but it is not a particular tracer of the dense gas that is found in actively star-forming regions. The most common tracers of dense molecular gas in galaxies are HCN and HCO+, as the critical densities of their low- transitions333The critical densities of high- CO lines can approach those of HCN and HCO+(=10), but their excitation temperatures are by at least 1–2 orders of magnitude higher. Thus, they do not necessarily trace the same gas phase. are significantly higher than those of CO (of order 105 cm-3, as compared to 103 cm-3 for CO), and more similar to the densities found in star-forming cores. As such, the study of HCN and HCO+ excitation in combination with that of CO can provide valuable constraints on the excitation mechanisms, and it can also help to reduce the partial degeneracies between model parameters. The only high-redshift galaxies in which the excitation of the dense gas has been studied to date are the Cloverleaf and APM 08279+5255 (Fig. 5b and 5d; Riechers et al. 2006b, 2010c, 2011a; Weiß et al. 2007). The HCO+ excitation in the Cloverleaf suggest that CO and HCO+ trace the same warm, dense gas phase, with HCO+ tracing the densest 15%–20% of the gas (Riechers et al. 2011a). The HCO+ excitation is comparable to what is found in the nuclei of nearby starburst and ultra-luminous infrared galaxies. Interestingly, the HCN excitation in APM 08279+5255 is poorly represented by models assuming purely collisional excitation, but instead suggests significant enhancement by the intense, warm infrared radiation field (=220 K) in this galaxy (Riechers et al. 2010c). This is also consistent with the detection of bright emission from multiple submillimeter H2O lines, which have critical densities of 108 cm-3, and thus are unlikely to be collisionally excited (Fig. 6; Lis et al. 2011; Bradford et al. 2011; van der Werf et al. 2011). These case studies exemplify the importance of studies of dense gas excitation to understand the conditions for star formation in high-redshift galaxies better than possible based on the study of CO alone.
5 Relation between Dense Molecular Gas and the Star Formation Rate
Several recent studies have concentrated on attempting to develop an understanding for the appearance of the classical “star formation law”, i.e., the relation between the surface densities of the gas and star formation rate in galaxies (e.g., Daddi et al. 2010a; Genzel et al. 2010). Given the limited availability of high-resolution studies to directly constrain gas and star formation rate surface densities in high-redshift galaxies, the spatially-integrated version of this relation still lies at the basis of much of the interpretation beyond the local universe. For infrared-luminous galaxies, the total gas mass and star formation rate that enter the integrated relation are most commonly determined based on the CO line luminosity () and the far-infrared luminosity (; e.g., Greve et al. 2005; Riechers et al. 2006a).
Besides the – relation, there is another key relation based on spatially integrated properties. In nearby galaxies, the relation between the HCN luminosity () and was found to be linear (Fig. 7; e.g., Gao & Solomon 2004a, 2004b). This linear relation holds over 7–8 orders of magnitude, ranging from Galactic dense cores to ultra-luminous infrared galaxies (Wu et al. 2005). A similar relation has been observed between the HCO+ luminosity and as well (Riechers et al. 2006b). The relation between the CO and far-infrared luminosities is much steeper, following a power-law slope of typically 1.4 when averaging over different galaxy populations (e.g., Riechers et al. 2006a). This may be due to an averaging over galaxies with both long-lasting star formation (as typically found in disk galaxies) and merger-driven starbursts, which perhaps represent a different mode of star formation (e.g., Daddi et al. 2010a, Genzel et al. 2010). Galaxies with both modes of star formation can have high gas fractions, but a different fraction of the gas itself may be actively involved in star formation. The latter can be constrained based on spatially resolved observations of multiple CO transition lines, which allow to differentiate between relatively cold and diffuse gas and the denser gas more directly related to ongoing star formation (e.g., Riechers et al. 2011c; Ivison et al. 2011). Dense gas tracers like HCN (and HCO+) offer an alternative, independent method to understand this difference in lieu of detailed, spatially resolved information.
This method is based on the linear – relation. The origin of this relation is thought to be that HCN traces only the dense fraction of the gas that is associated with the star-forming regions, which also exhibit the far-infrared emission, but not the more diffuse cold gas not directly associated with these regions. As such, a combination of CO (tracing all gas) and HCN (tracing only the dense gas in star-forming regions) can provide a more comprehensive understanding of the nature of the “star formation law”. Consistent with this picture, nearby “normal” spiral galaxies show low / of typically only 4%, while the most luminous nearby starburst show ratios of typically 17% (e.g., Gao & Solomon 2004b, Riechers et al. 2007b). / thus may be considered a tracer of the dense gas fraction, and its increase towards galaxies with higher star formation rates can explain the elevated / in starbursts, as well as the overall non-linearity of the – relation. As a result, there is no clear indication for separate trends for spirals and starbursts in the – relation, and the overall relation appears linear. Thus, we expect that high- disk galaxies show lower / ratios than nearby starbursts with comparable and/or star formation rates. Such measurements will become possible with ALMA in the near future.
Interestingly, the handful of high-redshift galaxies that were detected in HCN emission, along with a number of upper limits, indicate that the most luminous high-redshift star-forming galaxies show a higher per unit than expected based on the linear relation for nearby galaxies (Fig. 7; Gao et al. 2007; Riechers et al. 2007b). These galaxies are all starbursts, and the majority of them are quasar hosts. This rising trend can be understood if the median gas density in the luminous high-redshift galaxies is higher than in the nearby systems, and approaches or exceeds the critical density of the HCN(=10) transition. In this case, HCN no longer traces just the dense, star-forming cores (which have similar / ratios), but rather traces the bulk of the molecular gas, in a similar fashion as CO does in galaxies with lower, more typical gas densities (Krumholz & Thompson 2007). This picture is supported by the finding that /, on average, appears to increase with for nearby galaxies, but does not further increase between nearby ultra-luminous infrared galaxies and the more far-infrared-luminous high-redshift systems (Riechers et al. 2007b). More detailed studies of dense gas excitation in distant galaxies and an extension to multiple dense gas tracers, as possible with the JVLA and ALMA, will be crucial to further investigate this issue.

6 Outlook
Due to the completion of powerful new observatories such as the JVLA and ALMA, progress in the field of high-redshift molecular line studies in the coming years will be multifold. Beyond a rapid increase in the number of galaxies detected in CO emission (e.g., Riechers et al., in prep.; Tacconi et al. 2013; Weiß et al. 2013; see also Vieira 2013, this volume), in-depth studies at high spatial and spectral resolution (to probe the gas distribution, morphology and dynamics) and in multiple molecular tracers (to probe the gas composition and excitation) will be key to develop a deeper physical understanding of the gas properties of distant galaxies, and of their relation to galaxies in the present-day universe (e.g., Riechers et al. 2013). Another key aspect will be to study the gas content of distant galaxies not exclusively based on CO observations of individual, specifically selected samples, but also in a more unbiased fashion. This will provide direct constraints on the CO luminosity function of galaxies at high redshift, and thus, the “cold gas history of the universe” (i.e., the gas mass per unit cosmic volume as a function of redshift). Such investigations require observations of molecular deep fields, i.e., “blind” CO redshift scans over substantial cosmic volumes. Using the full capabilities of the recently completed JVLA correlator, the first such studies are currently underway, and will provide unique new constraints on the evolution of galaxies through cosmic times.
Acknowledgments
I would like to thank the organizers for the kind
invitation to this workshop in honor of Paul Vanden Bout, and Paul for
his countless contributions to this exciting area of research, which
have influenced my path in the field both directly and indirectly on
many occasions – and they will certainly continue to do so. I would
also like to thank my collaborators on studies related to this
subject, in particular Manuel Aravena, Frank Bertoldi, Chris Carilli,
Pierre Cox, Emanuele Daddi, Roberto Neri, Jeff Wagg, Fabian Walter,
Ran Wang, and Axel Weiß.
References
- (1) Ao, Y., Weiß, A., Downes, D., Walter, F., Henkel, C., & Menten, K. M. 2008, A&A, 491, 747
- (2) Aravena, M., et al. 2010, ApJ, 718, 177
- (3) Baker, A. J., Tacconi, L. J., Genzel, R., Lehnert, M. D., & Lutz, D, 2004, ApJ, 604, 125
- (4) Bertoldi, F., et al. 2003, A&A, 409, L47
- (5) Blain, A. W., Smail, I., Ivison, R. J., Kneib, J.-P., & Frayer, D. T. 2002, PhR, 369, 111
- (6) Bolatto, A. D., Wolfire, M., & Leroy, A. K. 2013, ARA&A, in press (arXiv:1301.3498)
- (7) Bradford, C. M., et al. 2009, ApJ, 705, 112
- (8) Bradford, C. M., et al. 2011, ApJ, 741, L37
- Brown & Vanden Bout (1991) Brown, R. L., & Vanden Bout, P. A. 1991, AJ, 102, 1956
- (10) Carilli, C. L., et al. 2002, ApJ, 575, 145
- (11) Carilli, C. L., & Walter, F. 2013, ARA&A, in press (arXiv:1301.0371)
- (12) Coppin, K. E. K., et al. 2007, ApJ, 665, 936
- (13) Daddi, E., et al. 2007, ApJ, 670, 156
- (14) Daddi, E., et al. 2008, ApJ, 673, L21
- (15) Daddi, E., et al. 2010a, ApJ, 714, L118
- (16) Daddi, E., et al. 2010b, ApJ, 713, 686
- (17) Danielson, A. L. R., et al. 2011, MNRAS, 410, 1687
- (18) Dannerbauer, H., et al. 2009, ApJ, 698, L178
- (19) Downes, D., & Solomon, P. M. 1998, ApJ, 507, 615
- (20) Frayer, D. T., et al. 2011, ApJ, 726, L22
- (21) Gao, Y., & Solomon, P. M. 2004a, ApJS, 152, 63
- (22) Gao, Y., & Solomon, P. M. 2004b, ApJ, 606, 271
- (23) Gao, Y., Carilli, C. L., Solomon, P. M., & Vanden Bout, P. A. 2007, ApJ, 660, L93
- (24) Genzel, R., et al. 2010, MNRAS, 407, 2091
- (25) Goldreich, P., & Kwan, J. 1974, ApJ, 189, 441
- (26) Greve, T. R., et al. 2005, MNRAS, 359, 1165
- (27) Guelin, M., et al. 2007, A&A, 462, L45
- (28) Hainline, L. J., et al. 2004, ApJ, 609, 61
- (29) Hainline, L. J., et al. 2006, ApJ, 650, 614
- (30) Harris, A. I., et al. 2010, ApJ, 723, 1139
- (31) Harris, A. I., et al. 2012, ApJ, 752, 152
- (32) Ivison, R. J., et al. 2010, MNRAS, 404, 198
- (33) Ivison, R. J., et al. 2011, MNRAS, 412, 1913
- (34) Ivison, R. J., et al. 2012, MNRAS, 425, 1320
- (35) Krumholz, M. R., & Thompson, T. A. 2007, ApJ, 669, 289
- (36) Leroy, A. K., et al. 2011, ApJ, 737, 12
- (37) Lilly, S. J., Le Fevre, O., Hammer, F., & Crampton, D. 1996, ApJ, 460, L1
- (38) Lis, D. C., Neufeld, D. A., Phillips, T. G., Gerin, M., & Neri, R. 2011, ApJ, 738, L6
- (39) Madau, P., et al. 1996, MNRAS, 283, 1388
- (40) Meijerink, R., & Spaans, M. 2005, A&A, 436, 397
- (41) Omont, A. 2007, RPPh, 70, 1099
- (42) Omont, A., et al. 2011, A&A, 530, L3
- (43) Riechers, D. A., et al. 2006a, ApJ, 650, 604
- (44) Riechers, D. A., et al. 2006b, ApJ, 645, L13
- (45) Riechers, D. A., et al. 2007a, ApJ, 666, 778
- (46) Riechers, D. A., et al. 2007b, ApJ, 671, L13
- (47) Riechers, D. A., et al. 2009a, ApJ, 703, 1338
- (48) Riechers, D. A., Walter, F., Carilli, C. L., & Lewis, G. F. 2009b, ApJ, 690, 463
- (49) Riechers, D. A., Carilli, C. L., Walter, F., & Momjian, E. 2010a, ApJ, 724, L153
- (50) Riechers, D. A., et al. 2010b, ApJ, 720, L131
- (51) Riechers, D. A., Weiß, A., Walter, F., & Wagg, J. 2010c, ApJ, 725, 1032
- (52) Riechers, D. A. 2011a, ASPC, 446, 355
- (53) Riechers, D. A. 2011b, ApJ, 730, 108
- (54) Riechers, D. A. 2012, ASPC, in press (arXiv:1202.2096)
- (55) Riechers, D. A. 2013, ApJ, 765, L31
- (56) Riechers, D. A., et al. 2011a, ApJ, 726, 50
- (57) Riechers, D. A., et al. 2011b, ApJ, 739, L32
- (58) Riechers, D. A., Hodge, J., Walter, F., Carilli, C. L., & Bertoldi, F. 2011c, ApJ, 739, L31
- (59) Riechers, D. A., et al. 2011d, ApJ, 733, L11
- (60) Riechers, D. A., et al. 2011e, ApJ, 733, L12
- (61) Riechers, D. A., et al. 2013, Nature, 496, 329
- (62) Scott, K. S., et al. 2011, ApJ, 733, 29
- (63) Scoville, N. Z., & Solomon, P. M. 1974, ApJ, 187, L67
- (64) Solomon, P. M., & Barrett, J. W. 1991, IAUS, 146, 235
- (65) Solomon, P. M., Downes, D., & Radford, S. J. E. 1992, ApJ, 398, L29
- (66) Solomon, P., Vanden Bout, P., Carilli, C., & Guelin, M. 2003, Nature, 426, 636
- (67) Solomon, P. M., & Vanden Bout, P. A. 2005, ARA&A, 43, 677
- (68) Spaans, M., & Meijerink, R. 2008, ApJ, 678, L5
- (69) Stacey, G. J., et al. 2010, ApJ, 724, 957
- (70) Tacconi, L. J., et al. 2008, ApJ, 680, 246
- (71) Tacconi, L. J., et al. 2010, Nature, 463, 781
- (72) Tacconi, L. J., et al. 2013, ApJ, 768, 74
- (73) Vanden Bout, P. A., Solomon, P. M., & Maddalena, R. J. 2004, ApJ, 614, L97
- (74) van der Werf, P. P., et al. 2010, A&A, 518, L42
- (75) van der Werf, P. P., et al. 2011, ApJ, 741, L38
- (76) Venemans, B. P., et al. 2012, ApJ, 751, L25
- (77) Walter, F., et al. 2003, Nature, 424, 406
- (78) Walter, F., et al. 2004, ApJ, 615, L17
- (79) Wang, R., et al. 2010, ApJ, 714, 699
- (80) Weiß, A., et al. 2005, A&A, 438, 533
- (81) Weiß, A., et al. 2007, A&A, 467, 955
- (82) Weiß, A., et al. 2013, ApJ, 767, 88
- (83) Wu, J., et al. 2005, ApJ, 635, L173