Creation of a homogeneous plasma column by means of
hohlraum radiation for ion-stopping measurements
Abstract
In this work, we present the results of two-dimensional radiation-hydrodynamics simulations of a hohlraum target whose outgoing radiation is used to produce a homogeneously ionized carbon plasma for ion-beam stopping measurements. The cylindrical hohlraum with gold walls is heated by a frequency-doubled ( m) ns long laser pulse with the total energy of J. At the laser spot, the peak matter and radiation temperatures of, respectively, eV and eV are observed. X-rays from the hohlraum heat the attached carbon foam with a mean density of mg/cm3 to a temperature of eV. The simulation shows that the carbon ionization degree () and its column density stay relatively stable (within variations of about %) long enough to conduct the ion-stopping measurements. Also, it is found that a special attention should be paid to the shock wave, emerging from the X-ray heated copper support plate, which at later times may significantly distort the carbon column density traversed by the fast ions.
keywords:
2D radiation hydrodynamics , hohlraum radiation and spectra , creation of homogeneous plasma conditions , ion stopping in dense plasmasurl]http://th.physik.uni-frankfurt.de/faik/
1 Introduction
Today, the heavy-ion stopping in matter at normal conditions [1] is a rather well understood phenomenon. The combination of a high-power Petawatt laser facility and a large-scale accelerator for heavy ions at GSI111GSI Helmholtzzentrum für Schwerionenforschung GmbH, Planckstr.1, 64291 Darmstadt, Germany, http://www.gsi.de. offers the unique opportunity to extend this knowledge to dense plasmas at high temperatures. Corresponding experiments with laser-generated plasmas [2, 3, 4, 5] are of crucial importance for the indirect drive scenario of heavy ion fusion [6] and for the ion-driven fast ignition concept [7, 8], but inevitably the biggest challenge for those experiments is always to avoid spatial non-uniformities in the plasma layer within a sufficiently long lifetime — on the order of a few nanoseconds — to measure the stopping power for a bunch of fast ions.
One straightforward way to form a uniformly ionized plasma layer with a constant column density might be to heat a planar foil target — as usually being used for the measurements with cold matter — by intense direct laser radiation. Although at a first glance spatial non-uniformities, resulting from the strongly non-uniform intensity distribution across the laser focal spot, seem to be a formidable obstacle, recent theoretical research [9] confirmed by experiments [10, 11] has shown that under appropriate conditions sufficiently uniform plasma states, suitable for ion-stopping measurements, can nevertheless be achieved in the direct irradiation scheme.
Another attractive way to generate a uniform plasma state is to heat a sample indirectly with the radiation of a millimeter-scale hohlraum. The hohlraum — a cavity usually made of a high-Z material, which provides high diffusive resistivity for thermal X-rays — thereby is directly heated by intense laser pulses to X-ray temperatures of tens and hundreds of electronvolts [12, 13, 14]. The sample may be either placed inside or close to such a hohlraum, usually in the form of a low-density foam. Then the inertial and thermal confinement of the uniformly heated high-temperature plasma can be guaranteed either by the hohlraum itself or by an additional enclosure for a limited period of time.
Theoretical modeling of a hohlraum target is a challenging task for computational physics since it combines multidimensional hydrodynamic simulations with the solution of the spectral transfer equation for thermal radiation. In 2011, 2D (two-dimensional) simulations of two hohlraum configurations, one of them already used in experiments with the NHELIX and PHELIX lasers at GSI [15], were reported [16]. In the present work, we present the results of new 2D simulations of another hohlraum target which is representative for undergoing experiments with the PHELIX laser and the UNILAC ion accelerator at GSI [17]. The configuration consists of a simple cylindrical hohlraum with gold walls and an empty interior. One hole of the hohlraum serves as the laser beam entrance. At the other hole, a low-density CHO foam inside a copper holder is attached to measure the ion stopping in a partially ionized carbon plasma at moderate temperatures of eV. A similar setup was already used in earlier experiments at the OMEGA laser facility (LLE, Rochester) to perform X-ray scattering measurements of the heating and cooling dynamics of a carbon foam at higher plasma densities and temperatures [18].
This paper is organized as follows. In Section 2 the employed radiation-hydrodynamics code RALEF-2D together with the equation of state and spectral opacities are briefly described. Section 3 gives an overview of the target geometry used in the experiments and of the corresponding numerical setup for the simulations, which have been performed in two steps. In the first step, in Section 4, the heating and radiation of the empty hohlraum without the foam sample are analyzed. In the second step, in Section 5, the plasma evolution of the foam sample is studied and the implications for the ion-stopping experiment are discussed.
2 RALEF-2D
2.1 Two-dimensional radiation hydrodynamics
All presented results have been obtained with a newly developed radiation-hydrodynamics code RALEF-2D (Radiative Arbitrary Lagrangian-Eulerian Fluid dynamics in two Dimensions) [19], whose hydrodynamics part is based on an updated version of the CAVEAT hydrodynamics package [20]. The one-fluid one-temperature hydrodynamic equations are solved in two spatial dimensions (in either Cartesian or axisymmetric coordinates) on a multi-block structured quadrilateral grid by a second-order Godunov-type numerical scheme. Mesh rezoning and remapping is performed within the Arbitrary Lagrangian-Eulerian (ALE) approach to numerical hydrodynamics.
Thermal conduction and radiation transport have been implemented by newly developed algorithms within the unified symmetric semi-implicit approach [21] with respect to time discretization. For the thermal conduction, a conservative, second-order accurate symmetric scheme on a 9-point stencil [22] is used. For the radiation energy transport, the quasi-static transfer equation
| (1) |
for the spectral radiation intensity is solved numerically in order to couple the radiative heating term
| (2) |
to the hydrodynamic energy equation. Within the quasi-static approximation the term (where is the speed of light) is omitted in equation (1). Spatial discretization and integration of equation (1) is achieved by the classical method [23] to treat the angular dependence of the radiation intensity , and by the method of short characteristics [24], which ensures that every grid cell automatically receives the same number of light rays. The correct reproduction of the diffusion limit on distorted non-orthogonal grids [25] is guaranteed by a special combination of the first- and second-order interpolation schemes in the finite-difference approximations to equations (1) and (2).
Energy deposition by a monochromatic laser beam is described by means of the inverse bremsstrahlung absorption. Numerically, propagation of the laser light is treated within the same algorithm as the radiation energy transport — which means without refraction.
2.2 Equation of state and opacities
The equation of state, thermal conductivity, and spectral opacities used in the present work were provided by the THERMOS code [26], which has been developed at the Keldysh Institute of Applied Mathematics (Moscow). The spectral opacities are generated by solving the Hartree-Fock-Slater equations for plasma ions under the assumption of equilibrium level population. In combination with the equilibrium Planckian intensity , used in (1) as the source function, the latter means that the radiation transport is treated in the local thermodynamic equilibrium (LTE) approximation. The applicability of the LTE approach to our problem is discussed below in section 4.
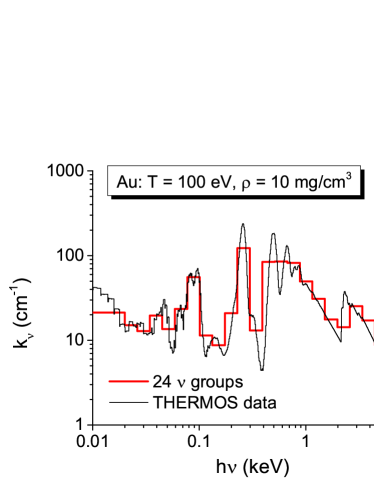
The transfer equation (1) is solved numerically for a selected number of discrete spectral groups , with the original THERMOS absorption coefficients averaged inside each group by using the Planckian weight function. Two different sets of frequency groups are prepared for each code run: the primary set with a smaller number of groups (24 in the present simulations) is used at every time step in a joint loop with the hydrodynamic module, while the secondary (diagnostics) set with a larger number of groups (300 in the present simulations) is used in the post-processor regime at selected times to generate the spectral output data. Figure 1 gives an example of the spectral dependence of for a gold plasma at eV and g cm-3, together with the 24 group-averaged values.
3 Target geometry and simulation setup
3.1 Three-dimensional experimental target geometry
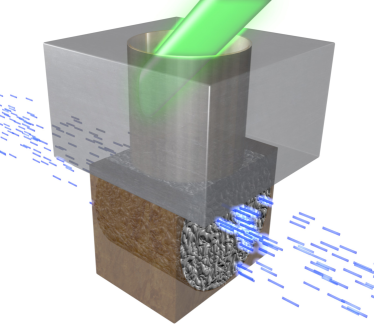
A three-dimensional (3D) configuration of the combined hohlraum-foam target which covers all of the essential physical processes involved in the experimentally used targets [17] is shown in Fig. 2. The hohlraum wall is a thin cylindrical gold layer with the inner diameter mm and the length mm, embedded inside a massive aluminum block. A -ns long frequency-doubled ( m) PHELIX laser pulse with ns long flanks (Figure 3) shoots at an angle of with the total pulse energy of J to the center of the hohlraum wall. In the simulations the spatial profile of the laser intensity was approximated by a Gaussian curve with a full width at half maximum of mm.
At the bottom of the hohlraum, a cylindrical sample made of a cellulose-triacetate (C12H16O8) foam with initial mean density mg/cm3, diameter mm, and length mm is attached. Except for the entrance and exit holes for the ion beam (blue dashes in the figure) and the connecting hole to the hohlraum, the foam is surrounded by a solid copper holder. The chosen foam density is, on the one hand, sufficiently low to ensure efficient propagation of the hohlraum radiation, and, on the other hand, high enough to allow fabrication of stable 3D samples by temperatures up to ∘C; the finest pore structure within the foams cellular network is on the order of m. Note, that the column density of the used foam configuration corresponds to that of a m thick solid carbon foil, but the combination of the low density and the large thickness of the foam provides the advantage of a diminished hydrodynamic expansion on the nanosecond time scale in comparison to the foil.
In the experiments, the ion bunches of duration ns and diameter mm probed the hot plasma, and the heavy-ion energy losses in the ionized sample measured by the time-of-flight method were compared with the previous ion shot through the cold foam. Simple evaluation of the corresponding Coulomb logarithms indicates that, for the -MeV/u titanium ions used in the experiments, the stopping power of the hot foam (approximated as 3.75-times ionized pure carbon at mg/cm3 and eV) should exceed the corresponding cold value by some 75%.
3.2 Two-dimensional simulation setup
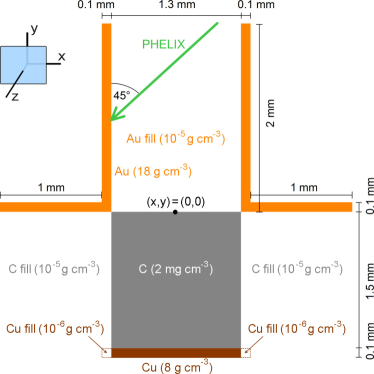
Theoretical modeling of the above described target with an oblique (with respect to the hohlraum axis) incidence of the laser beam is intrinsically a 3D problem. Having no 3D radiation-hydrodynamics code at hand, we had to reduce it to two dimensions. Figure 4 shows the corresponding lateral cut of the actually simulated 2D target.

Numerical simulations were performed in the Cartesian coordinates, where the 3D extension of the simulated region spreads to infinity along the -axis. The 2D hohlraum wall is represented by two gold plates, each with the initial density g/cm3. The cellulose-triacetate foam was modeled as a homogeneous block of pure carbon with the initial foam density of mg/cm3, supported from below by a copper plate with g/cm3. Two additional horizontal gold plates are added to confine the lateral plasma expansion. All the dimensions indicated in Fig. 4 coincide with the 3D experimental values. The supposedly empty parts of the simulated domain were initially filled with corresponding gases at sufficiently low densities, so that their overall dynamic and thermal influence were negligible. Simulations started from the initial state of pressure equilibrium among all the target parts; the boundary condition of free outflow was applied at all the outer edges.
Spectral energy transport by thermal radiation was treated with 24 logarithmically equidistant (except for the first group) discrete frequency groups delimited by the photon energies
| (3) |
as is shown in Fig. 1. The delimiting frequencies for the 300 diagnostics groups were logarithmically uniformly distributed between keV and keV. The angular dependence of the radiation intensity was calculated with the method, which offers 960 discrete ray directions over the entire solid angle.
3.3 Rescaling of the laser input energy from 3D to 2D
In 2D simulations we used the same spatial and temporal laser power profiles as in the experiments, and only the total input energy was rescaled to ensure that in two dimensions the hohlraum walls absorb approximately the same amount of energy per unit surface area and exhibit similar dynamics of wall evaporation as in the original 3D configuration. For the 3D input energy of J our rescaling procedure, described in A, yields (after one iteration) a 2D input energy of J/mm, which was used in all 2D simulations. The 2D runs needed to iterate were performed for the isolated hohlraum without the attached carbon block. The corresponding areas of the hohlraum walls and holes, entering the equations (10) and (13), are
| (4) | |||
| (5) |
In Section 4 we present the results for the isolated hohlraum obtained with the first-order input energy on a rectangular mesh with cells in the purely Eulerian mode. The simulation which included the carbon plasma was performed in the ALE mode with Lagrangian interfaces at the material boundaries on a mesh of cells and is discussed in Section 5.
4 Radiative properties of the isolated hohlraum
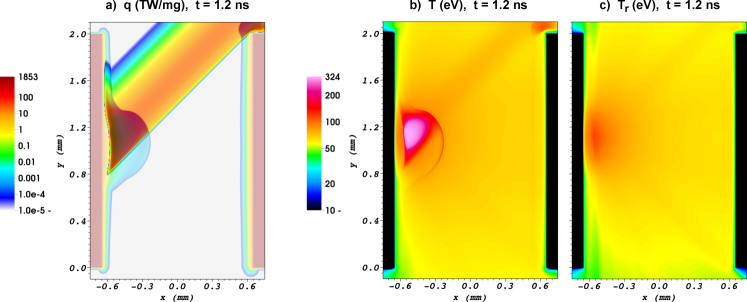
The heating of the carbon plasma is determined by the thermal history of the hohlraum, especially during the laser pulse. Figure 5a demonstrates how the laser light is absorbed near the end of the laser pulse, at ns; Figs. 5b and 5c show the matter and radiation temperatures inside the hohlraum at this moment. A plume of hot laser-ablated gold plasma rises from the left wall with an average velocity of cm/s. Also, some plasma is evaporated from the upper corner of the right wall “licked” by the periphery of the laser beam. In the simulated case the net shielding effect of this edge plasma was negligible: it blocked less than 1% of the total laser pulse energy.
It should be noted here that actual experiments were performed with different beam-hohlraum configurations — including those where the laser beam entered the hohlraum horizontally through a hole in the side wall — and always a special care was taken for the edge plasma not to hinder penetration of the laser light into the hohlraum. The focus position was adjusted such that the laser beam had negligible divergence along the last mm of its path (In the experiment a lens was used with a focal length of m and a Rayleigh length above mm.); accordingly, the simulated beam was always assumed to be purely cylindrical without any spatial divergence.
The temperature inside the expanding gold plasma cloud reaches its peak value keV at ns, the density varies in the range g/cm3, and the LTE ionization degree amounts to , which implies a free electron density in the range of cm-3. Recall that the critical electron density for a nm laser light is cm-3. For , the critical density of free electrons in a gold plasma corresponds to the mass density of g/cm3.
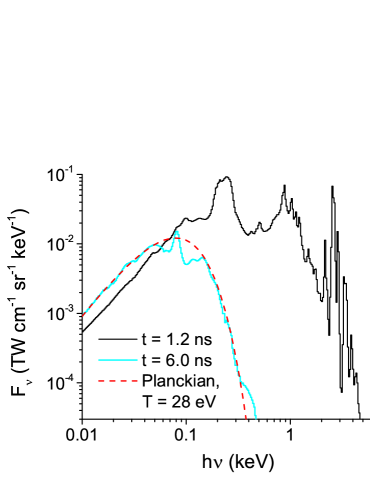
The calculated X-ray spectra, as would have been observed through the lower hohlraum hole at and ns, are shown together with a Planckian fit of the second spectrum for eV in Fig. 6. This figure displays the spectral power [TW cm-1 sr-1 keV-1] per unit cylinder length, obtained by integrating the spectral intensity along an imaginary observation slit (perpendicular to the y-axis) over the range mm mm. Taking its origin from the groups of strong emission lines of gold (cf. Fig. 1), the highly non-Planckian spectrum at ns exhibits three peaks between keV, keV, and keV. As will be shown in the next section, such a spectrum is quite favorable for the efficient supersonic and quasi-volumetric heating of the carbon foam.
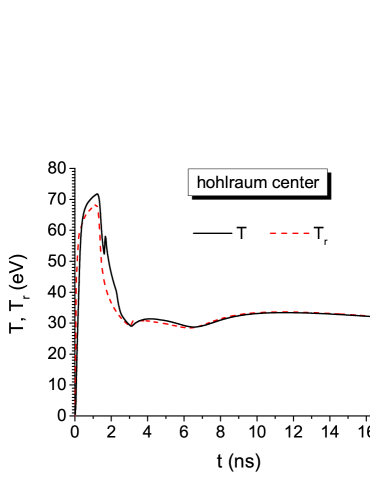
On a longer time scale, displayed in Fig. 7, the matter and radiation temperatures inside the hohlraum come close to equilibrium shortly after the laser is off, and for ns stabilize at eV: at this stage the hohlraum gradually cools down due to the radiative energy loss and the calculated X-ray spectrum at ns approaches the Planckian shape. The average matter and radiation temperatures near the hohlraum center, plotted in Fig. 7 for times ns, were calculated by averaging over the grid-cell masses in the central region ( mm mm, mm mm).
These results allow us to assess the applicability of the LTE model to our problem. In general, non-LTE effects may only become significant when (and where) the local radiation spectrum strongly deviates from that of a black-body with the local matter temperature . In our case this happens only during the short period ns of laser illumination and only in the vicinity of the laser spot. As a consequence, the non-LTE physics can be expected to affect the ionization equilibrium of gold in the laser focal spot and to modify the spectral details (especially the line features at keV) of the primary hard X-ray flash, generated at ns. However, once we focus our attention on later times ns when the radiation field everywhere (including the carbon foam discussed below) comes close to local equilibrium with matter (see Figs. 6 and 7), the use of the LTE approximation is fully justified.
At ns, the central region of the hohlraum is slightly reheated to eV due to the collision of the expanding clouds of the ablated material from the two hohlraum walls. Such a collision leads to the formation of a strongly radiating shock front [27] with a practically full conversion of the kinetic energy into thermal radiation, accompanied by a strong plasma compression. As a result, a thin and dense filament of shock-compressed gold plasma — clearly visible in Figs. 10a and 10b below — is formed. In our case this filament stays close to the hohlraum center, which agrees well with the experimental X-ray pinhole images showing a bright spot at the hohlraums center [17, Fig. 4b].
5 Dynamics of the carbon plasma
5.1 Heating dynamics
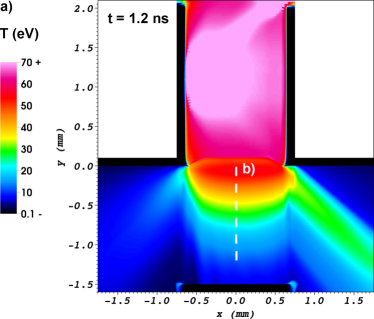
As may be expected, most of the energetic X-rays, originating from the focal laser spot plasma, enter and heat the carbon block already during the laser pulse. The distribution of the matter temperature by the end of the laser pulse at ns is shown in Fig. 8a. At this time a strong spatial variation of the carbon plasma temperature, ranging from values below 10 eV to those above 55 eV, can be observed. Furthermore, some X-rays, mainly those which originate from the laser spot at the left hohlraum wall, pass through the carbon block at its upper corners and “shine” into the low-density carbon vapor fill.
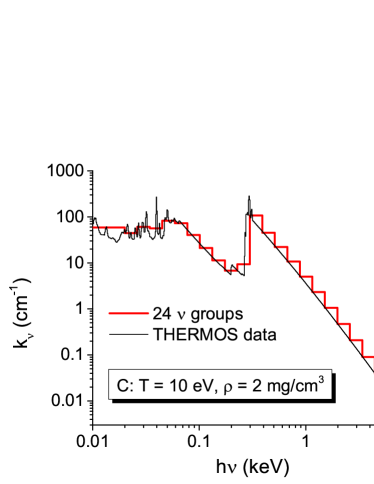
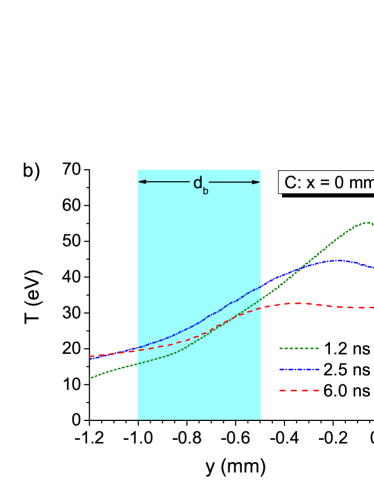
The vertical temperature gradient across the plasma and its relaxation in time are illustrated by three selected temperature profiles through the center of the carbon block in Fig. 8b. For a proper qualitative understanding of the carbon heating process one has to consider the spectral absorption coefficient of carbon, shown in Fig. 9 for eV and mg cm-3. By comparing the plots in Figs. 6 and 9 one sees that the first spectral peak of strong emission from the hot ( eV) gold plasma in the laser spot practically coincides with the transparency window –0.3 keV of carbon just below its -edge, where mm-1; the photons with keV from the second spectral emission peak also have mm-1. In other words, for a large portion of the hohlraum radiation emitted during the laser pulse the carbon foam has an optical thickness of . The latter means that the carbon foam is practically instantaneously (i.e. synchronously with the temporal laser power profile) heated by a flash of X-rays from the laser spot over the entire foam volume to an average temperature of eV, varying by about a factor 4 across a distance of 1 mm. At the same time, about 20% of the hohlraum X-ray emission, generated during the laser pulse, passes through the foam and directly hits the copper support plate.
Note that the described heating dynamics of our low-density carbon foam is in many respects similar to that diagnosed by Gregori et al. [18] in earlier experiments at the OMEGA facility — though the latter used a 100 times denser foam and about 50 times more powerful laser pulses. In both cases the foam is heated in a clearly supersonic regime by quasi-thermal X-rays, whose effective radiation temperature significantly exceeds the peak electron temperature of the heated sample.
5.2 Temperature equilibration phase
After the laser is turned off, the hohlraum continues to glow in soft X-rays on a time scale of tens of nanoseconds, letting out the energy accumulated in its wall material during the laser pulse. Figure 10 shows the 2D distributions of the density , the matter temperature , and the LTE ionization degree for the whole experimental configuration at and 14 ns. From these plots some important observations can be made for the ion-stopping measurements.
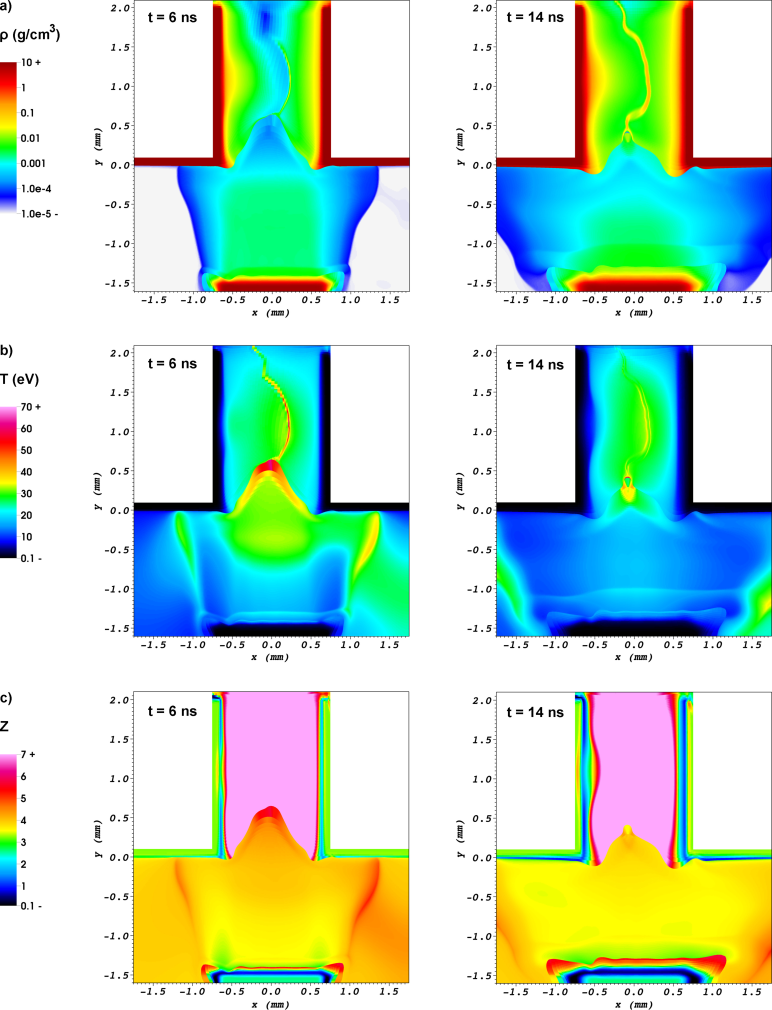
Firstly, one can clearly see that the expanding carbon plasma pushes back the gold plasma from the hohlraum, which means that one should not fear the ablated gold to get into the way of the ion beam. Secondly, as a significant energy portion of the main X-ray flash, generated by the laser pulse, penetrates through the translucent carbon foam and is absorbed by the copper holder, the resulting pressure discontinuity between copper and foam launches a shock wave into the foam. This shock front propagates towards the hohlraum and enters the ion-beam aperture mm mm at ns, i.e. late enough to perform the measurements at earlier times. Finally, the simulation shows that a reasonably homogeneous plasma volume with –3.8 and –27 eV is created along the ion beam path, quite suitable for the ion-stopping measurements within a certain limited time window.
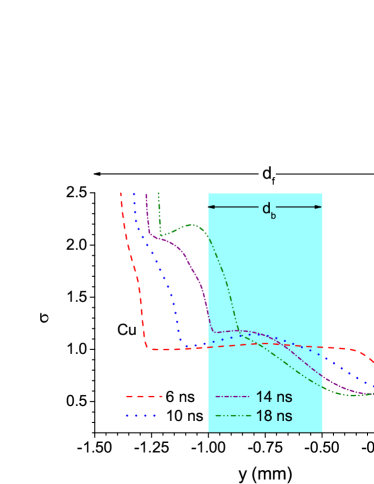
The appropriate time window for the ion-stopping measurements can be evaluated by inspecting the data presented in Figs. 11 and 12. Figure 11 shows the normalized column density
| (6) |
along the supposed ion trajectories parallel to the x-axis (see Figs. 2 and 4) as a function of the -coordinate at four selected times , 10, 14, and 18 ns. For high-quality ion stopping measurements, it is important to have the values of as close to 1 as possible for the entire ion pulse duration ns over the entire beam aperture mm mm. The eventual significant departures of from 1 are caused by three effects: (i) the 2D lateral expansion of the carbon plasma beyond the confining walls of the copper holder, (ii) compression of the foam material by the shock front propagating from the bottom of the carbon block, and (iii) swelling of the gold walls near the hohlraum edges. Our results indicate that for ns the maximum deviations of from unity within the diameter of the ion beam do not exceed 10%. The and 18 ns profiles in Fig. 11 are already significantly perturbed by the effects (i) and (ii).
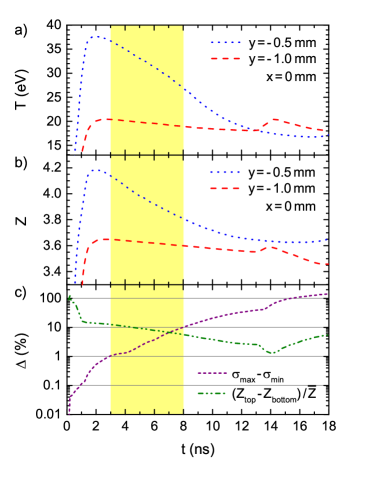
Figures 12 a) and b) show the temporal evolution of the matter temperature and the ionization degree at two points and that are of special interest from the point of view of the ion-stopping measurements. Figure 12 c) shows the difference between both ionization degree values and the maximum spatial variation of within the ion beam aperture. One sees that the temperature and ionization become quite uniform for ns — which would be a good time for the ion bunch to arrive if not already significant perturbations to the values occurred.
Finally, as a result of complex interplay between the above discussed physical effects, the best compromise for the ion measurements in the analyzed configuration should roughly fall into the range 3 ns ns — as is indicated in Fig. 12 with a shaded vertical strip. Note that the upper boundary of this window can easily be expanded by increasing the size of the foam block: every extra 100 m of the foam size would add roughly 1 ns to the favorable time span.
6 Conclusion
The results of a 2D radiation-hydrodynamic study of a combined hohlraum-foam target used to perform ion-stopping measurements in a quasi-homogeneously ionized plasma are presented. Our principal goal was to investigate how uniform and for how long a sample plasma column can be created in this type of laser-driven targets. We have analyzed the principal physical processes, which determine the spatial structure and dynamics of the sample plasma, and demonstrated how their combined effect defines an optimum — to ensure clean ion-stopping measurements in a plasma — time window for accepting a -ns long bunch of fast ions. For the target parameters used in this work, this time interval turns out to be between ns and ns after the onset of the laser pulse. We find that within this window the time and space variations of such key parameters as the column mass density along the ion trajectories and the plasma ionization degree do not exceed . On the basis of our analysis one can readily identify the guidelines for target modifications that could improve the quality of the ion-stopping measurements in this type of laser-plasma targets.
At the same time we have to admit serious limitations of the present 2D simulations in what concerns direct comparison with the experimental data. First of all, it can hardly be expected that the simulated 2D configuration sufficiently accurately represents the essentially 3D experimental arrangement: the qualitative parameters of the carbon plasma uniformity may be significantly modified by the 3D effects in the hydrodynamic motion and the radiation transport. Secondly, the experimentally used cellulose-triacetate (C12H16O8) foam contains a significant fraction of oxygen atoms, which noticeably modify the spectral absorption coefficient around the K-edges of carbon and oxygen. Hence, more accurate opacity data for the foam material are needed before a detailed comparison with the experiment is to be made.
Thirdly, some uncertainty arises from the fact that the radiation transport was simulated with the LTE spectral absorption and emission coefficients. Although the LTE approximation appears to be well justified for times after the end of the laser pulse, the non-LTE effects in the laser-ablated gold plasma with –400 eV during the laser pulse may noticeably alter the X-ray spectrum emerging from the hohlraum at ns. Finally, since we used a simplified model for the laser light transport without refraction and reflection, no estimate can be given for possible effects of the reflected (off the hohlraum wall) laser light hitting directly the carbon foam and other parts of the hohlraum. To study such effects, a more advanced laser propagation package is needed than presently available in the RALEF code.
Acknowledgments
This work was supported by the ExtreMe Matter Institute EMMI in the framework of the Helmholtz Alliance Program HA216/EMMI, by the Bundesministerium für Bildung und Forschung BMBF (Project 05P12RFFTR), by the Helmholtz International Center for FAIR (HIC for FAIR), and by the Jülich Supercomputing Centre JSC.
Appendix A Reduction of a 3D hohlraum to a 2D configuration
Reduction of an intrinsically 3D problem to two dimensions requires an additional spatial symmetry to be imposed on the original 3D configuration, which may be either a translational invariance (along the -axis) or an invariance with respect to rotation around a fixed -axis. In result one would want the new 2D configuration to reproduce as closely as possible all the main dynamic features of the original 3D problem. In our case it means that the simulated 2D configuration must represent a certain 2D cut of the original 3D hohlraum with all the key dimensions taken from the latter. Having preserved the temporal and spatial shapes of the driving laser pulse, we are left with only one undetermined parameter for the 2D case, namely, the total input laser energy, which we will denote as for the 2D case, and as for the original 3D case. Note that the original value must be recalculated (rescaled) to the “equivalent” 2D value already because in the case of translational invariance these two quantities have different physical dimensions.
Since in hohlraum-type targets both the matter motion and the intensity (as well as the spectrum) of the hohlraum radiation are controlled by the incident radiation-energy fluxes per unit surface area of the hohlraum interior, we assume that the “physically equivalent” 2D hohlraum must on average accept the same amount of energy per unit inner surface area as the original 3D hohlraum. Mathematically this condition can be expressed as the following two equations of the global energy balance in a hohlraum
| (7) | |||||
| (8) |
Here and are, respectively, the total surface areas of the inner 3D hohlraum wall and of all its holes, and are the corresponding quantities in the 2D hohlraum, is the radiation-energy fluence (measured in J/cm2) absorbed by the inner hohlraum walls, and is the radiation-energy fluence which escapes the hohlraum through its holes. If the hohlraum radiation is characterized by the equivalent black-body temperature , then can be calculated as
| (9) |
where is the Stefan-Boltzmann constant. As a word of caution it should be noted that, because it is only the time- and space-averaged quantities and that are ensured to have the same values in the original 3D hohlraum and its 2D counterpart, one cannot expect that all the details of the 3D problem should be adequately reproduced by a corresponding 2D simulation.
Since the surface areas , , , and are all known, Eqs. (7) and (8) yield the following expression for the rescaled input energy
| (10) |
where
| (11) |
is an unknown dimensionless factor. It can be found by the method of successive approximations as follows. In the zeroth approximation, one can set , i.e. assume that , and perform a 2D simulation with
| (12) |
Making use of the results of this simulation, one can evaluate the first-order value of as
| (13) |
where is the total amount of radiative energy, which escapes the hohlraum in the zero-order 2D run. Equation (13) is a direct consequence of the global energy balance relation (8) combined with
| (14) |
Having substituted into Eq. (10), one obtains a first-order estimate for the rescaled input energy . Higher-order approximations are usually not needed. Note that hohlraums with walls of a heavy metal typically have –3.
References
- Sigmund [2006] P. Sigmund, Particle Penetration and Radiation Effects: General Aspects and Stopping of Swift Point Charges, Springer, 2006.
- Couillaud et al. [1994] C. Couillaud, R. Deicas, P. Nardin, M. A. Beuve, J. M. Guihaumé, M. Renaud, M. Cukier, C. Deutsch, G. Maynard, Ionization and stopping of heavy ions in dense laser-ablated plasmas, Physical Review E 49 (1994) 1545–1562.
- Roth et al. [2000] M. Roth, C. Stöckl, W. Süß, O. Iwase, D. O. Gericke, R. Bock, D. H. H. Hoffmann, M. Geissel, W. Seelig, Energy loss of heavy ions in laser-produced plasmas, Europhysics Letters 50 (2000) 28–35.
- Ogawa et al. [2001] M. Ogawa, Y. Oguri, U. Neuner, K. Nishigori, A. Sakumi, K. Shibata, J. Kobayashi, M. Kojima, M. Yoshida, J. Hasegawa, Laser heated dE/dX experiments in Japan, Nuclear Instruments and Methods in Physics Research Section A 464 (2001) 72–79.
- Frank et al. [2010] A. Frank, A. Blažević, P. L. Grande, K. Harres, T. Heßling, D. H. H. Hoffmann, R. Knobloch-Maas, P. G. Kuznetsov, F. Nürnberg, A. Pelka, G. Schaumann, G. Schiwietz, A. Schökel, M. Schollmeier, D. Schumacher, J. Schütrumpf, V. V. Vatulin, O. A. Vinokurov, M. Roth, Energy loss of argon in a laser-generated carbon plasma, Physical Review E 81 (2010) 026401.
- Hofmann and Plass [1998] I. Hofmann, G. Plass, The HIDIF-Study, GSI Report 98-06, GSI Helmholtzzentrum für Schwerionenforschung GmbH, 1998.
- Tabak et al. [1994] M. Tabak, J. Hammer, M. E. Glinsky, W. L. Kruer, S. C. Wilks, J. Woodworth, E. M. Campbell, M. D. Perry, R. J. Mason, Ignition and high gain with ultrapowerful lasers@f—, Physics of Plasmas 1 (1994) 1626–1634.
- Roth et al. [2001] M. Roth, T. E. Cowan, M. H. Key, S. P. Hatchett, C. Brown, W. Fountain, J. Johnson, D. M. Pennington, R. A. Snavely, S. C. Wilks, K. Yasuike, H. Ruhl, F. Pegoraro, S. V. Bulanov, E. M. Campbell, M. D. Perry, H. Powell, Fast Ignition by Intense Laser-Accelerated Proton Beams, Physical Review Letters 86 (2001) 436–439.
- An. Tauschwitz et al. [2013] An. Tauschwitz, M. Basko, A. Frank, V. Novikov, A. Grushin, A. Blažević, M. Roth, J. A. Maruhn, 2D radiation-hydrodynamics modeling of laser-plasma targets for ion stopping measurements, High Energy Density Physics 9 (2013) 158–166.
- Frank et al. [2013] A. Frank, A. Blažević, V. Bagnoud, M. M. Basko, M. Börner, W. Cayzac, D. Kraus, T. Heßling, D. H. H. Hoffmann, A. Ortner, A. Otten, A. Pelka, D. Pepler, D. Schumacher, An. Tauschwitz, M. Roth, Energy Loss and Charge Transfer of Argon in a Laser-Generated Carbon Plasma, Physical Review Letters 110 (2013) 115001.
- Börner et al. [2012] M. Börner, J. Fils, A. Frank, A. Blažević, T. Hessling, A. Pelka, G. Schaumann, A. Schökel, D. Schumacher, M. M. Basko, J. Maruhn, An. Tauschwitz, M. Roth, Development of a Nomarski-type multi-frame interferometer as a time and space resolving diagnostics for the free electron density of laser-generated plasma, Review of Scientific Instruments 83 (2012) 043501.
- Löwer et al. [1994] T. Löwer, R. Sigel, K. Eidmann, I. B. Földes, S. Hüller, J. Massen, G. D. Tsakiris, S. Witkowski, W. Preuss, H. Nishimura, H. Shiraga, Y. Kato, S. Nakai, T. Endo, Uniform multimegabar shock waves in solids driven by laser-generated thermal radiation, Physical Review Letters 72 (1994) 3186–3189.
- Lindl [1995] J. D. Lindl, Development of the indirect-drive approach to inertial confinement fusion and the target physics basis for ignition and gain, Physics of Plasmas 2 (1995) 3933–4024.
- Lindl [1998] J. D. Lindl, Inertial Confinement Fusion: The Quest for Ignition and Energy Gain Using Indirect Drive, Springer, AIP-Press, 1998.
- Schumacher et al. [2011] D. Schumacher, A. Blažević, A. Frank, T. Hessling, G. Schaumann, M. Roth, First hohlraum shots with the frequency doubled PHELIX laser beam, GSI Report 2011-1, p. 411, GSI Helmholtzzentrum für Schwerionenforschung GmbH, 2011.
- Basko et al. [2011] M. M. Basko, J. A. Maruhn, An. Tauschwitz, V. G. Novikov, A. S. Grushin, 2D simulations of hohlraum targets for laser-plasma experiments and ion stopping measurements in hot plasmas, GSI Report 2011-03, GSI Helmholtzzentrum für Schwerionenforschung GmbH, 2011.
- Rosmej et al. [2011] O. N. Rosmej, V. Bagnoud, U. Eisenbarth, V. Vatulin, N. Zhidkov, N. Suslov, A. Kunin, A. Pinegin, D. Schäfer, T. Nisius, T. Wilhein, T. Rienecker, J. Wiechula, J. Jacoby, Y. Zhao, G. Vergunova, N. Borisenko, N. Orlov, Heating of low-density CHO-foam layers by means of soft X-rays, Nuclear Instruments and Methods in Physics Research Section A 653 (2011) 52–57.
- Gregori et al. [2008] G. Gregori, S. H. Glenzer, K. B. Fournier, K. M. Campbell, E. L. Dewald, O. S. Jones, J. H. Hammer, S. B. Hansen, R. J. Wallace, O. L. Landen, X-Ray Scattering Measurements of Radiative Heating and Cooling Dynamics, Physical Review Letters 101 (2008) 045003.
- Basko et al. [2010] M. M. Basko, J. A. Maruhn, An. Tauschwitz, Development of a 2D radiation-hydrodynamics code RALEF for laser plasma simulations, GSI Report 2010-1, p. 410, GSI Helmholtzzentrum für Schwerionenforschung GmbH, 2010.
- Addessio et al. [1992] F. L. Addessio, J. R. Baumgardner, J. K. Dukowicz, N. L. Johnson, B. A. Kashiwa, R. M. Rauenzahn, C. Zemach, CAVEAT: A Computer Code for Fluid Dynamics Problems With Large Distortion and Internal Slip, Report LA-10613-MS-Rev. 1, UC-32, Los Alamos National Laboratory, 1992.
- Livne and Glasner [1985] E. Livne, A. Glasner, A finite difference scheme for the heat conduction equation, Journal of Computational Physics 58 (1985) 59–66.
- Basko et al. [2009] M. M. Basko, J. A. Maruhn, An. Tauschwitz, An efficient cell-centered diffusion scheme for quadrilateral grids, Journal of Computational Physics 228 (2009) 2175–2193.
- Carlson [1963] B. G. Carlson, in Methods in Computational Physics, Academic Press, New York and London, 1963.
- Dedner and Vollmöller [2002] A. Dedner, P. Vollmöller, An Adaptive Higher Order Method for Solving the Radiation Transport Equation on Unstructured Grids, Journal of Computational Physics 178 (2002) 263–289.
- Larsen et al. [1987] E. W. Larsen, J. E. Morel, W. F. Miller Jr., Asymptotic solutions of numerical transport problems in optically thick, diffusive regimes, Journal of Computational Physics 69 (1987) 283–324.
- Nikiforov et al. [2005] A. F. Nikiforov, V. G. Novikov, V. B. Uvarov, Quantum-Statistical Models of Hot Dense Matter: Methods for Computation Opacity and Equation of State (Progress in Mathematical Physics), Birkhäuser Basel, 1 edition, 2005.
- Zeldovich and Raizer [2002] Y. B. Zeldovich, Y. P. Raizer, Physics of Shock-Waves and High-Temperature Hydrodynamic Phenomena, Dover Pubn Inc, illustrated edition, 2002.