Water-Trapped Worlds
Abstract
Although tidally-locked habitable planets orbiting nearby M-dwarf stars are among the best astronomical targets to search for extrasolar life, they may also be deficient in volatiles and water. Climate models for this class of planets show atmospheric transport of water from the dayside to the nightside, where it is precipitated as snow and trapped as ice. Since ice only slowly flows back to the dayside upon accumulation, the resulting hydrological cycle can trap a large amount of water in the form of nightside ice. Using ice sheet dynamical and thermodynamical constraints, I illustrate how planets with less than about a quarter the Earth’s oceans could trap most of their surface water on the nightside. This would leave their dayside, where habitable conditions are met, potentially dry. The amount and distribution of residual liquid water on the dayside depend on a variety of geophysical factors, including the efficiency of rock weathering at regulating atmospheric CO2 as dayside ocean basins dry-up. Water-trapped worlds with dry daysides may offer similar advantages as land planets for habitability, by contrast with worlds where more abundant water freely flows around the globe.
1 Introduction
Tidally-locked terrestrial planets orbiting in the habitable zone of nearby M-dwarf stars are among the best astronomical targets for discovery and atmospheric characterization (e.g., Charbonneau & Deming 2007; Montgomery & Laughlin 2009; Seager & Deming 2010; Rojas-Ayala et al. 2013). Recent estimates based on Kepler results are encouraging in suggesting a high frequency of such planets around M-dwarfs (Dressing & Charbonneau 2013; Fressin et al. 2013; Kopparapu 2013; Morton & Swift 2013).
The climate on this class of planets is peculiar and interesting because of the permanent day-night insolation pattern many are expected to experience by the end of their tidal evolution, once they are captured in 1:1 spin-orbit resonance (e.g. Rodriguez et al. 2012; see Correia & Laskar 2011 for a review). Provided that large enough surface pressures are present, nightside atmospheric collapse can be avoided (Joshi et al. 1997). Various other studies have illustrated how habitable planets around M-dwarfs will typically find themselves in a climate regime with hot daysides, cold frozen nightsides and an atmospheric circulation connecting the two hemispheres (Joshi 2003; Merlis & Schneider 2010; Heng et al. 2011; Kite et al. 2011; Pierrehumbert 2011; Wordsworth et al. 2011; Edson et al. 2011,2012; Leconte et al. 2013).
Two aspects of the climate problem on these planets which have received less attention, however, are the possibilities that they are deficient in volatiles and that a significant fraction of their surface water inventory could be trapped as ice on their nightside. Indeed, Lissauer (2007) and Raymond et al. (2007) have argued on the basis of standard terrestrial planet formation scenarios that volatile deficiency may be a key attribute of these planets (see also Ogira & Ida 2009 for an alternate view). Even planets formed with abundant water could lose much of their surface inventory via atmospheric escape during an intense tidal heating phase preceding their spin-orbit resonant capture (Barnes et al. 2013). Heath et al. (1999) and Joshi (2003) have considered the nightside ice trap issue but they mostly emphasized how the ice layer would experience melting at its base on worlds with abundant water, thus making the ice trap inefficient. Recently, Leconte et al. (2013) have also discussed the nightside ice trap but mostly in the specific context of the climate bi-stability of planets found near the inner edge of their habitable zone.
Here, I interpret volatile deficiency as likely implying a small surface water inventory for these planets and I argue that the ice trap on the nightside of water-deficient planets around M-dwarfs could in fact be efficient and have a profound effect on their climate. In §2, I present new simulations of the climate on habitable planets around M-dwarfs which illustrate the rapid development of a nightside ice trap for surface water. In §3, I develop the argument about the effective nature of this ice trap on sufficiently water-deficient planets, before discussing some implications for their climate and concluding in §4.
2 Climate Simulations and Ice Trapping
I use PlanetSimulator, a flexible Earth-System simulator of intermediate complexity developed at the University of Hamburg,111www.mi.uni-hamburg.de/plasim to study the climate of tidally-locked habitable planets around M-dwarfs. PlanetSimulator relies on a pseudo-spectral atmospheric dynamical solver coupled to an accurate radiative transfer scheme. It includes detailed formulations to simulate the hydrological cycle on Earth-like planets, such as water evaporation and precipitation, diagnostic cloud formation, a 50m slab model for the ocean and a thermodynamic sea ice model (see Fraedrich et al. 2005 for details). Although these model elements have been tuned to simulate the Earth’s climate, they are expected to remain reasonably accurate for climates deviating only modestly from Earth’s conditions, as is the case here. I use PlanetSimulator in its T42L10 formulation (128 longitude nodes, 64 latitude nodes and 10 vertical levels).
I modified PlanetSimulator to enforce a permanent day-night insolation pattern and I set the planetary obliquity and orbital eccentricity to zero in all models, for consistency with the tidally-locked hypothesis investigated here. I adopt an Earth-like insolation of W m-2 in all models and a planet rotation period h by default, which corresponds to a tidally-locked planet around a M-dwarf (Edson et al. 2012). I also removed orography (relief over continents) from all models to make the results more general and after tests showed that it does not have a major impact on the main results. I use the current distribution of Earth continents in models with continents. All other model parameters take their standard Earth values, unless otherwise stated.222In particular, I have not accounted for the reduced ice and snow albedos expected on planets orbiting M-dwarfs (Joshi & Haberle 2012). This is expected to have only a minor quantitative impact on the main results of interest here because only a small fraction of the icy surface is actually exposed to insolation (see also Leconte et al. 2013).
Table 1 shows the list of models I have explored in this work. All models are run for 40 Earth months, which is sufficient for the surface temperature field to reach a steady-state under permanent insolation, starting from Earth-like initial conditions. Earth1, Earth2 and Earth3 are models with standard Earth parameters, the default rotation period h and a permanent insolation pattern centered on longitude deg (Greenwhich), deg (Bangladesh) and deg (central pacific ocean), respectively. Earth.lowP is similar to Earth1 except that the total atmospheric surface pressure is reduced to bar.333Volatile deficiency could in principle also result in a reduce N2 atmospheric content, which is captured by the lower surface pressure in this model. Note that improved modeling of low surface pressure scenarios would entail verifying the accuracy of the PlanetSimulator radiative scheme under these conditions, which was not done here. With a constant CO2 fraction of ppm, this also corresponds to a CO2 atmospheric content reduced by about a third. Earth.lowCO2 and Earth.highCO2 are similar to Earth1 except for CO2 fraction of ppm and ppm, respectively.444Lucarini et al. (2013) suggest that PlanetSimulator’s radiative transfer scheme should remain reasonably accurate over this range of CO2 atmospheric content values. Earth.fast and Earth.slow are similar to Earth1 except for their rotation periods h and h, respectively. SuperEarth is similar to Earth1 except that it uses larger values of the surface gravity and the planetary radius, corresponding to a super-Earth with a mass (see Table 1; Valencia et al. 2006). Finally, Aquaplanet is similar to the Earth1-3 models except that all the continents have been replaced by a global ocean.
I find that the general circulation regime in all these models is qualitatively consistent with what has been reported in the literature before for other tidally-locked habitable planet models (e.g., Joshi et al. 1997; Merlis & Schneider 2010; Heng et al. 2011; Edson et al. 2012). The majority of models listed in Table 1 exhibit a zonally-averaged zonal wind profile comparable to that of Earth, with two eastward jets streams at altitude and negative wind speeds at the equatorial ground. In three models, however (Earth.lowP, Earth.slow and SuperEarth), the general circulation is in a superrotating555Superrotation refers to a regime with positive equatorial winds, which imply “eddy” momentum transport towards the equator beyond what any type of axisymmetric meridional circulation can achieve (e.g., Showman et al. 2011). regime with positive zonal winds at the equatorial ground and a rather broad eastward jet at altitude. Maximum zonally-averaged wind speeds range from m s-1 (SuperEarth model) to m s-1 (Earth.highCO2). Interestingly, these results are not entirely consistent with the study of Edson et al. (2012), who reported faster wind speeds in their superrotating models and dynamical transitions to the superrotating regime at – h for land planets and – h for aquaplanets (i.e., at faster rotation rates than found here). It would be interesting to understand the origin of this discrepancy better. I simply note for now that it does not appear to have a major impact on the main results of interest here for nightside ice since all models in Table 1 exhibit comparable properties in that respect.
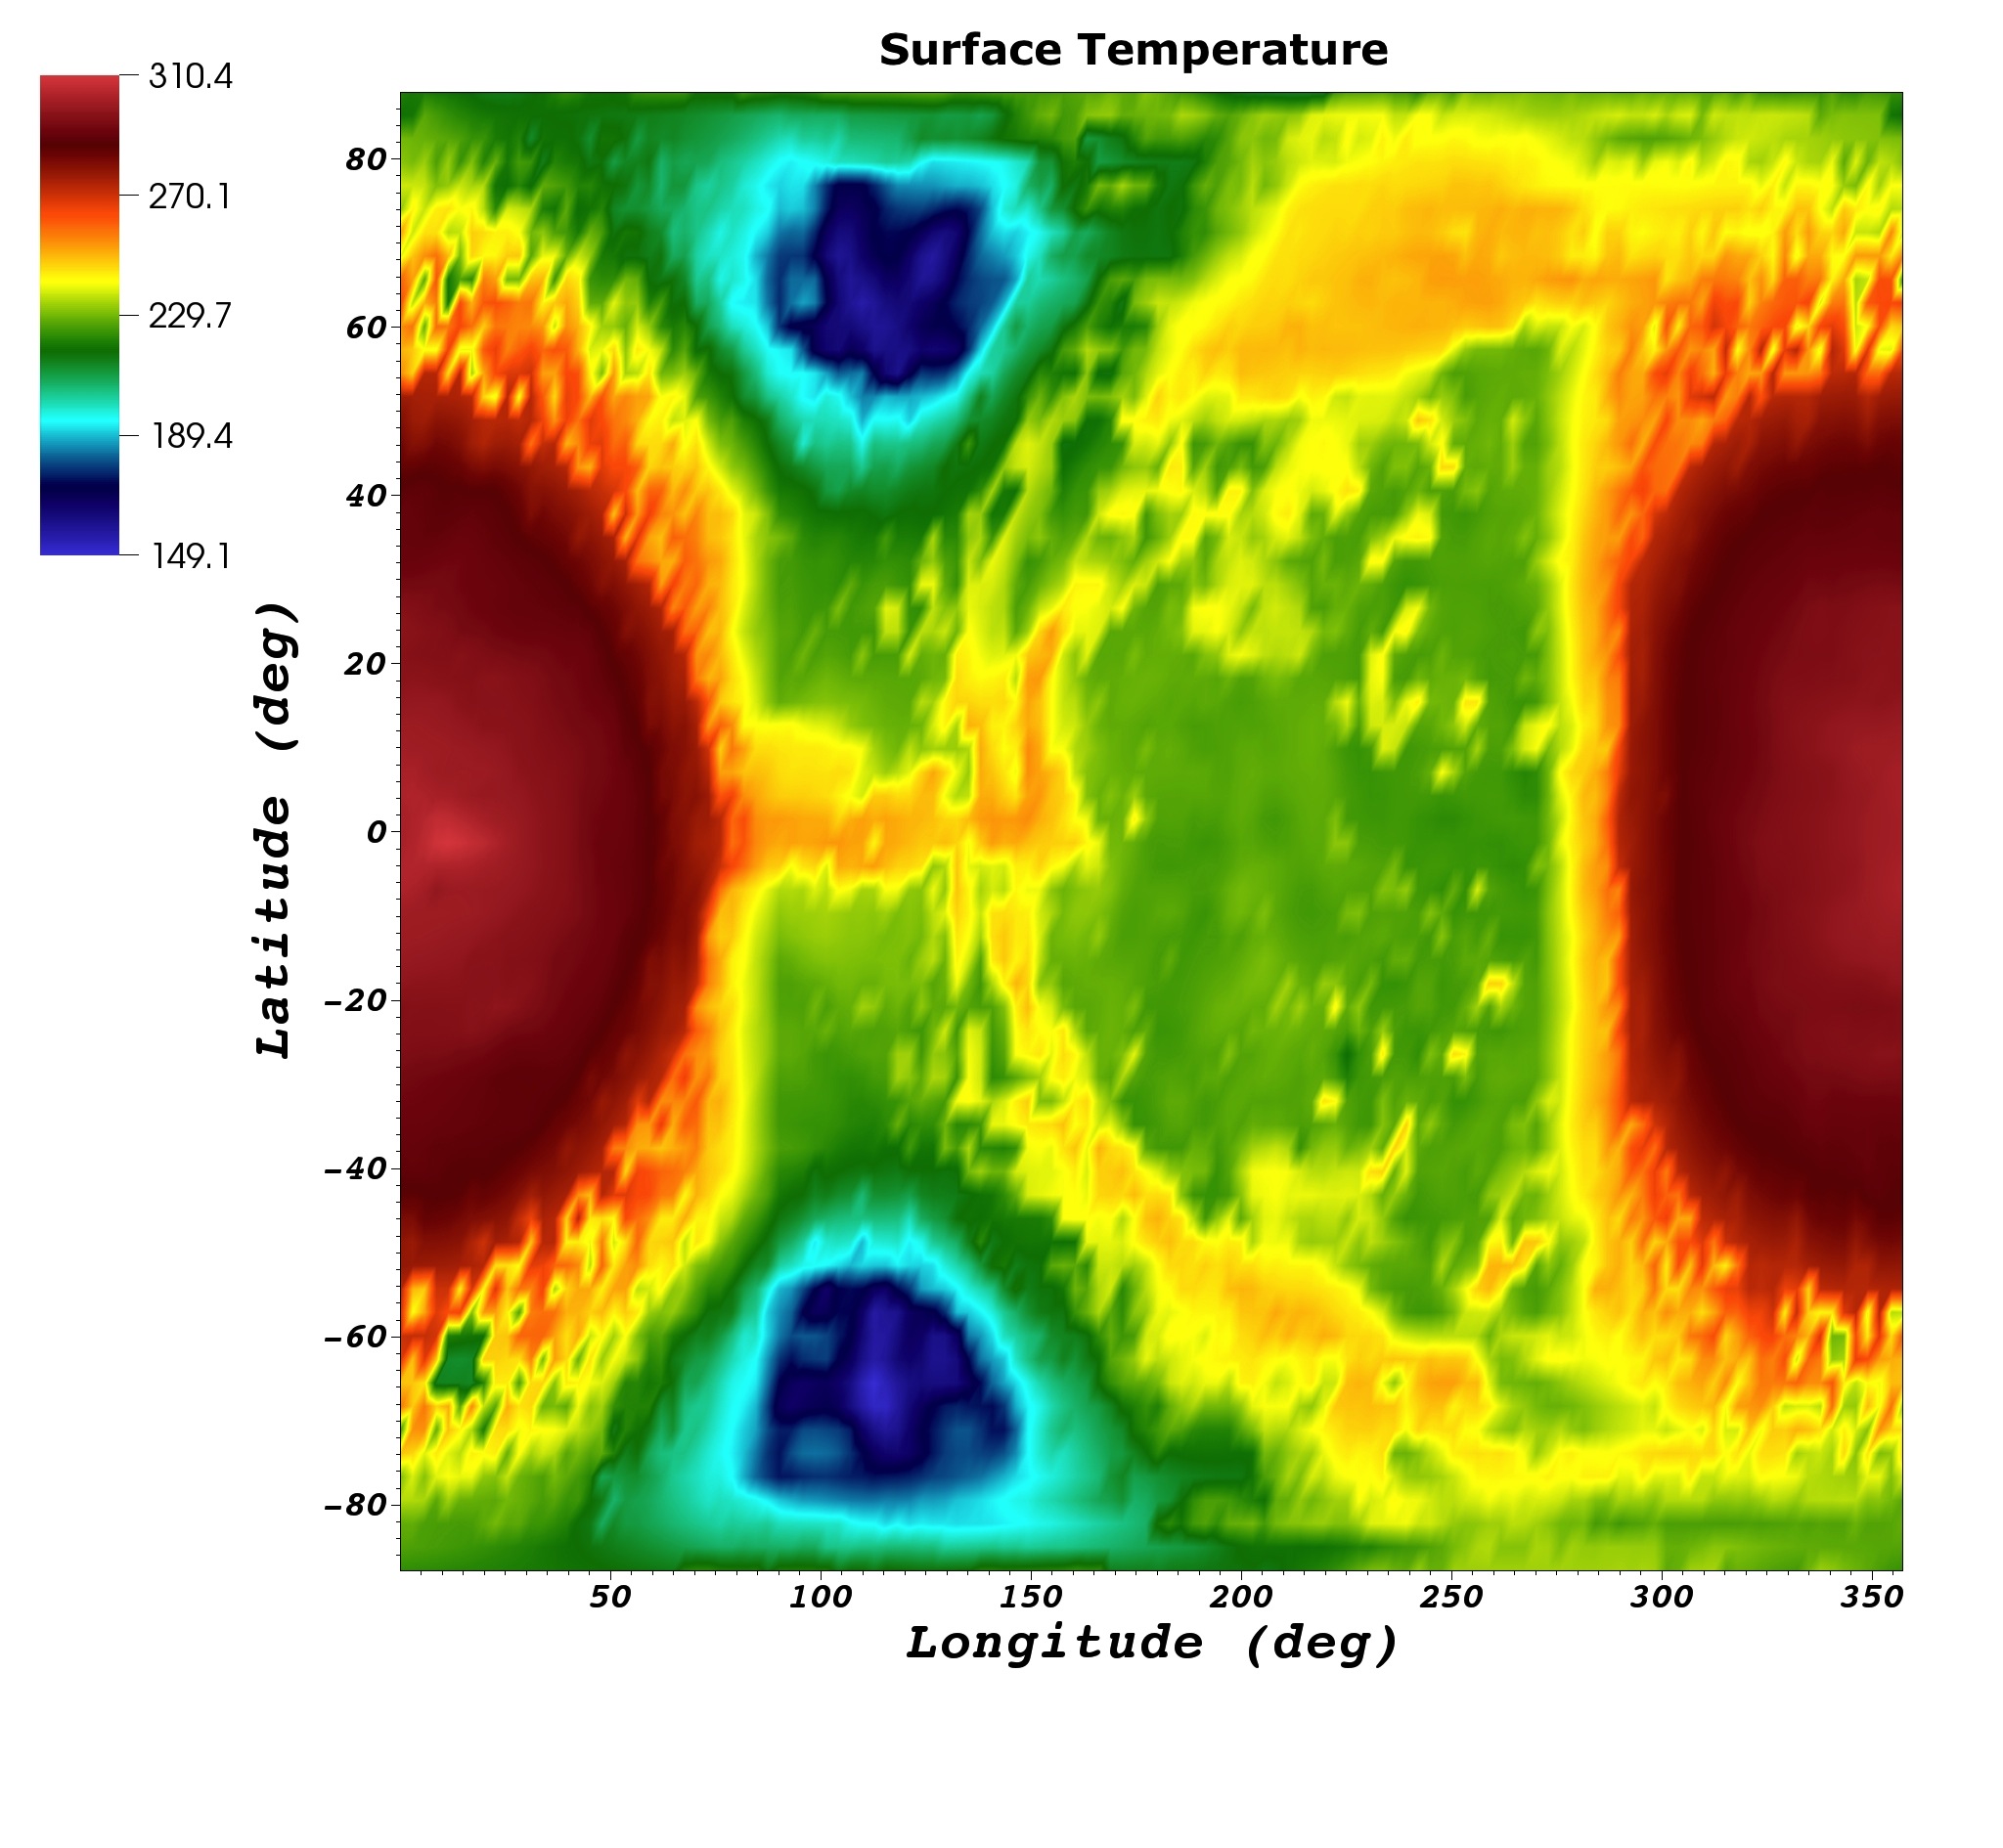
Figure 1 shows representative end results from the Aquaplanet model. The surface temperature field shows that liquid water conditions are confined to the dayside of the planet (see also Figure 4), making this model climate comparable to the eyeball climate discussed by Pierrehumbert (2011). On the nightside, the coldest surface conditions are offset from the poles and the equator is the hottest, as the region where the near-surface wind is the most efficient at carrying heat from the dayside and coupling it with the nightside surface.
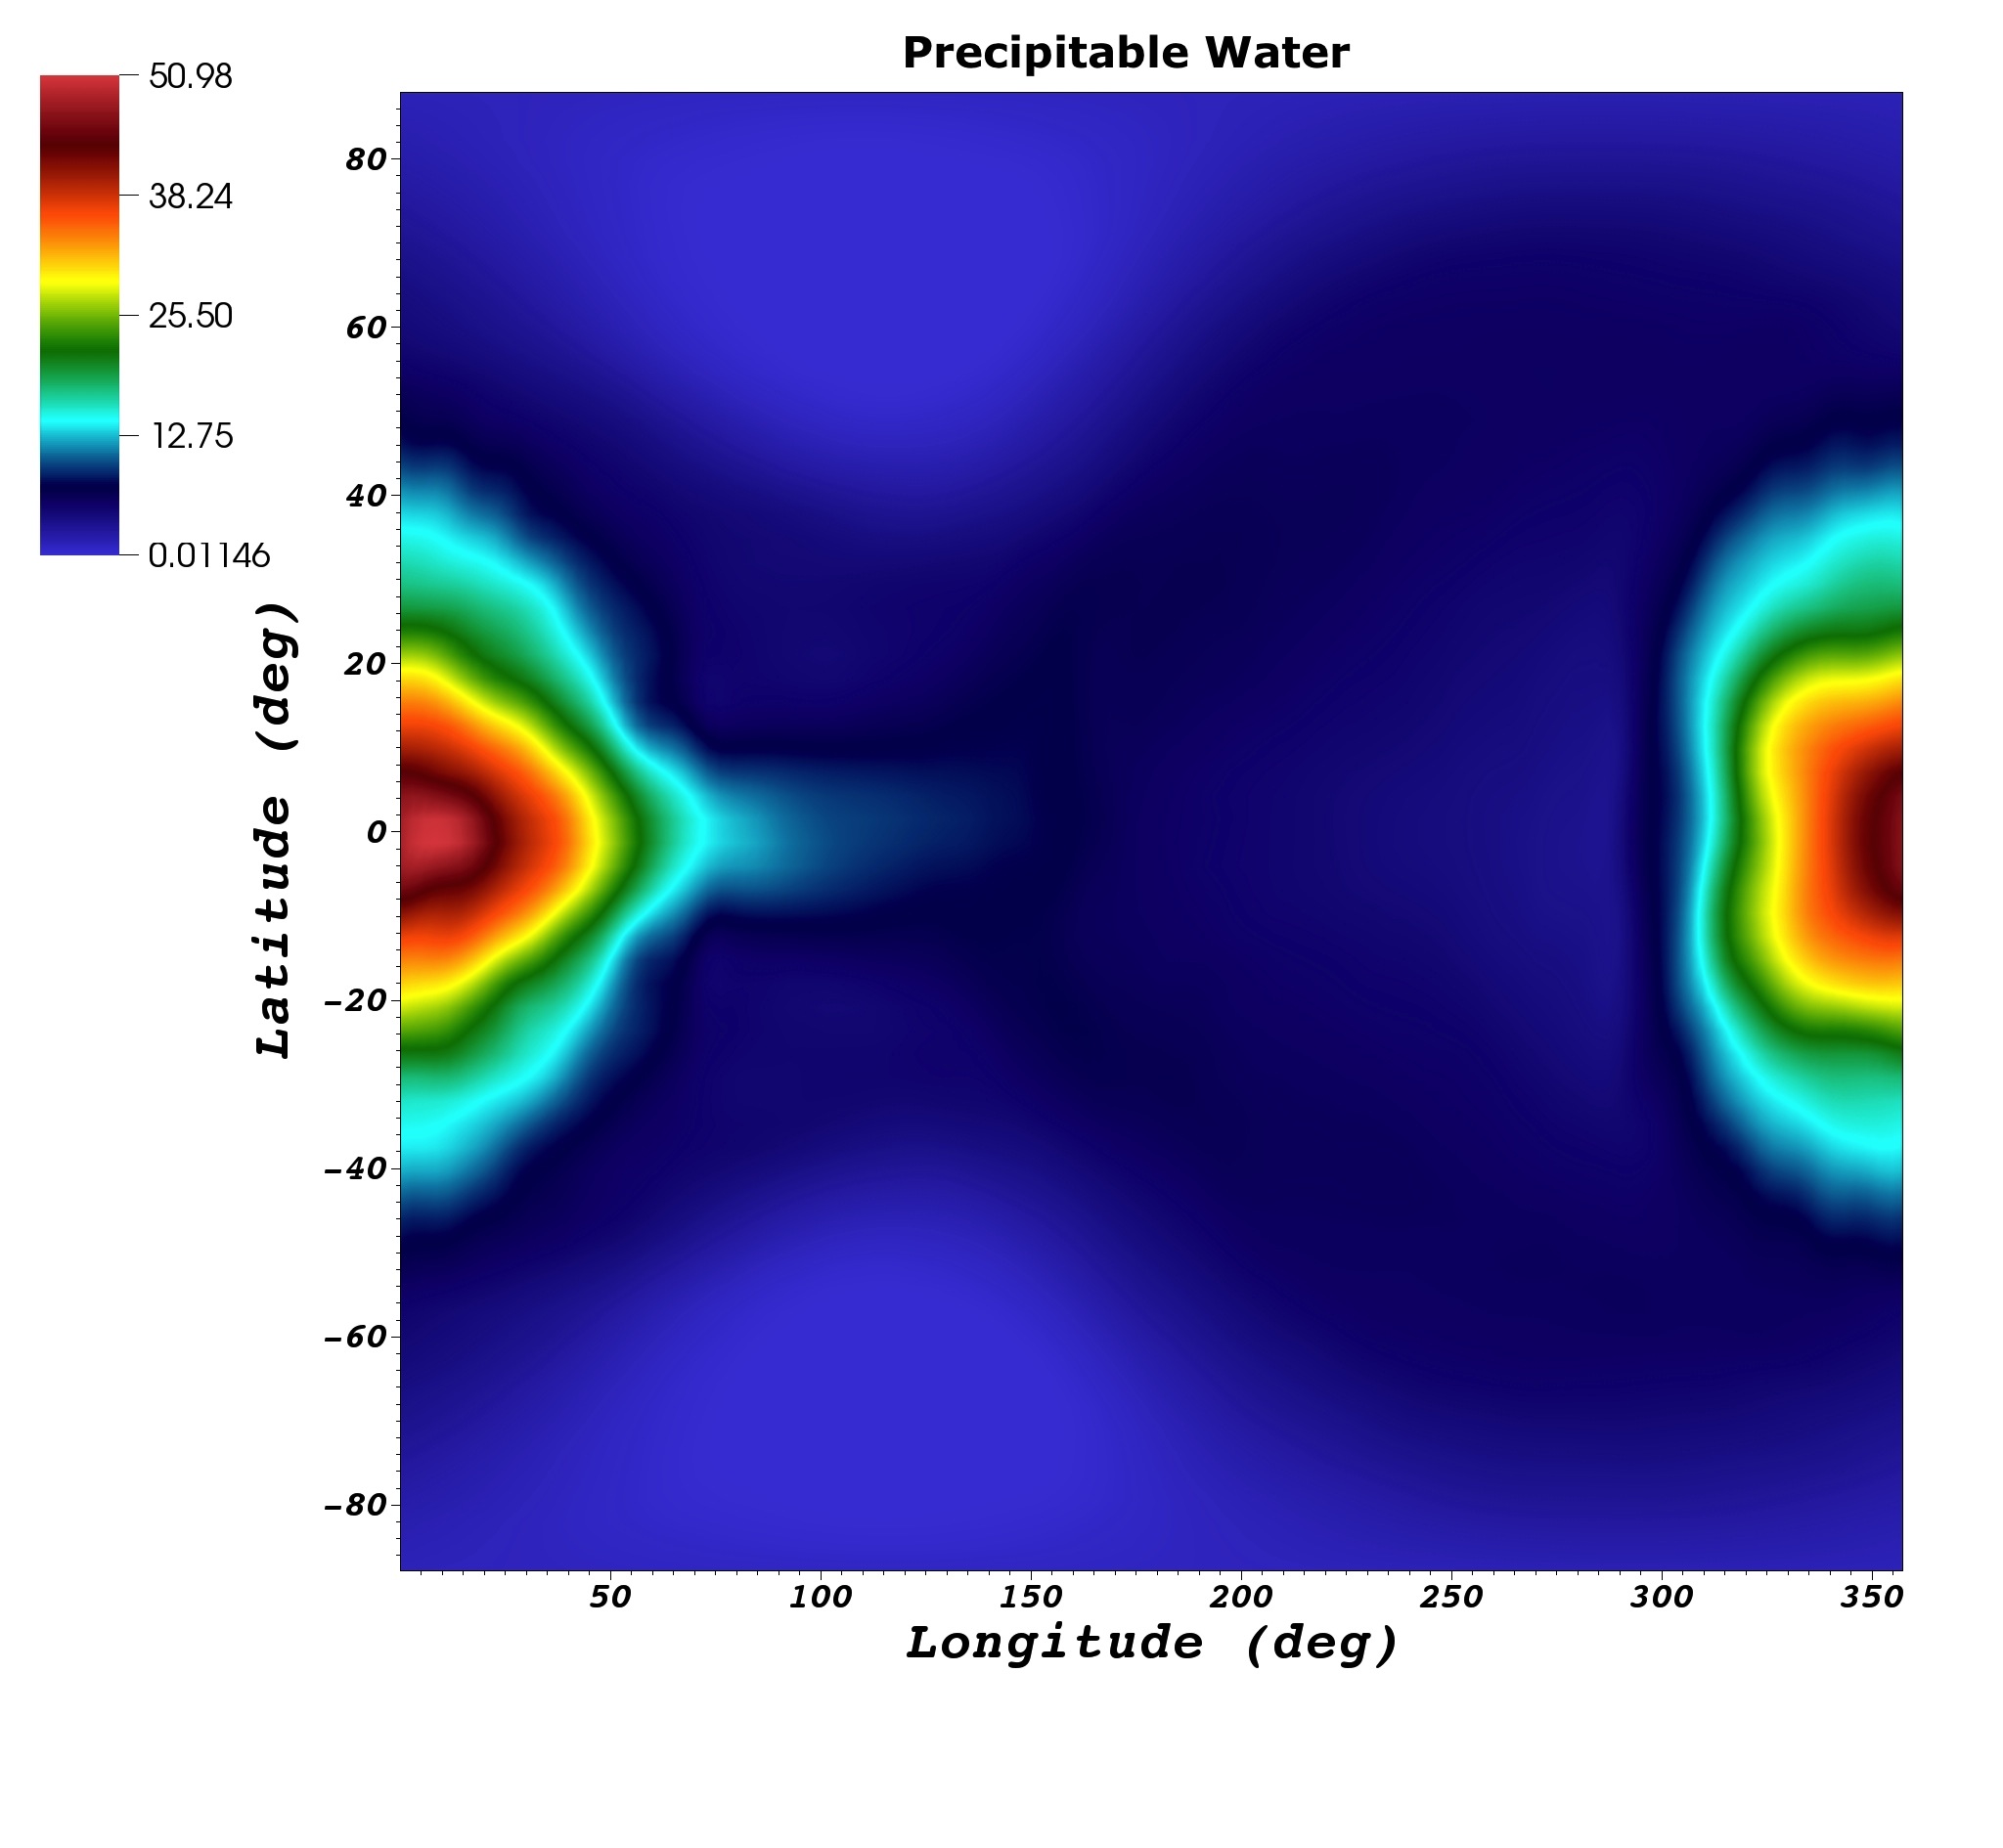
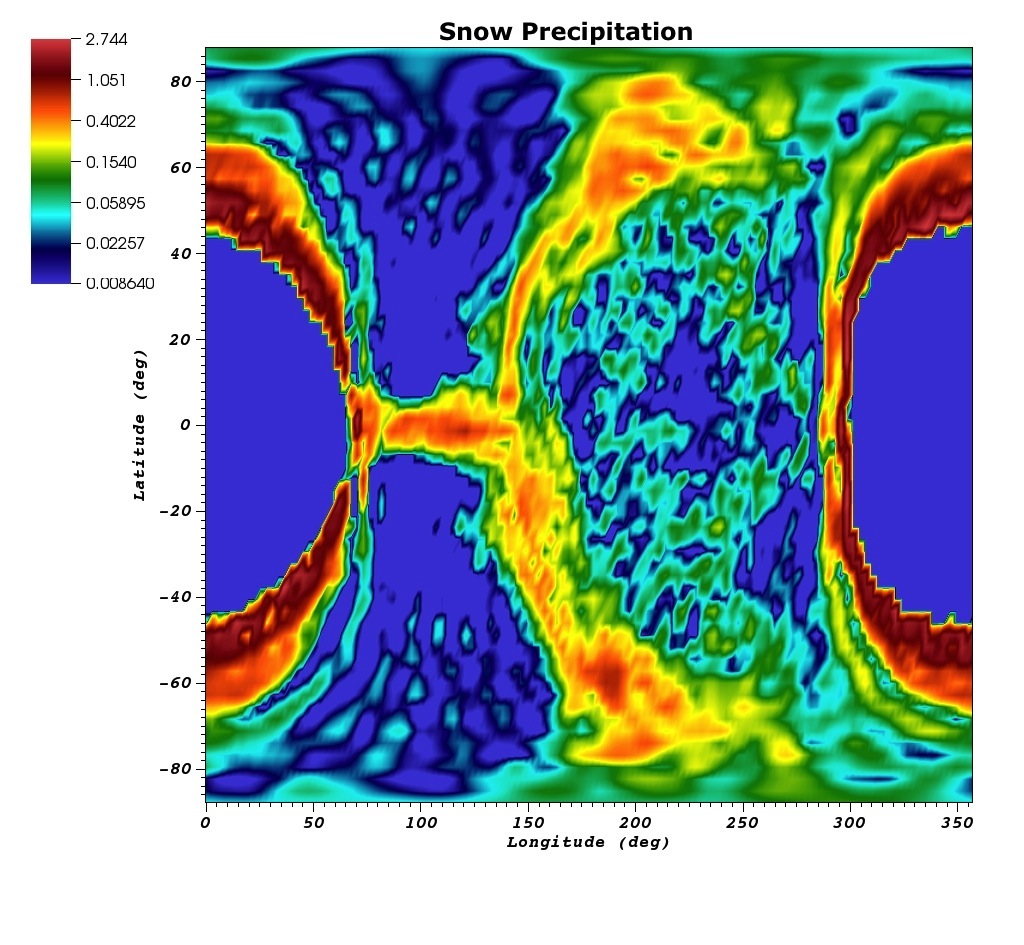
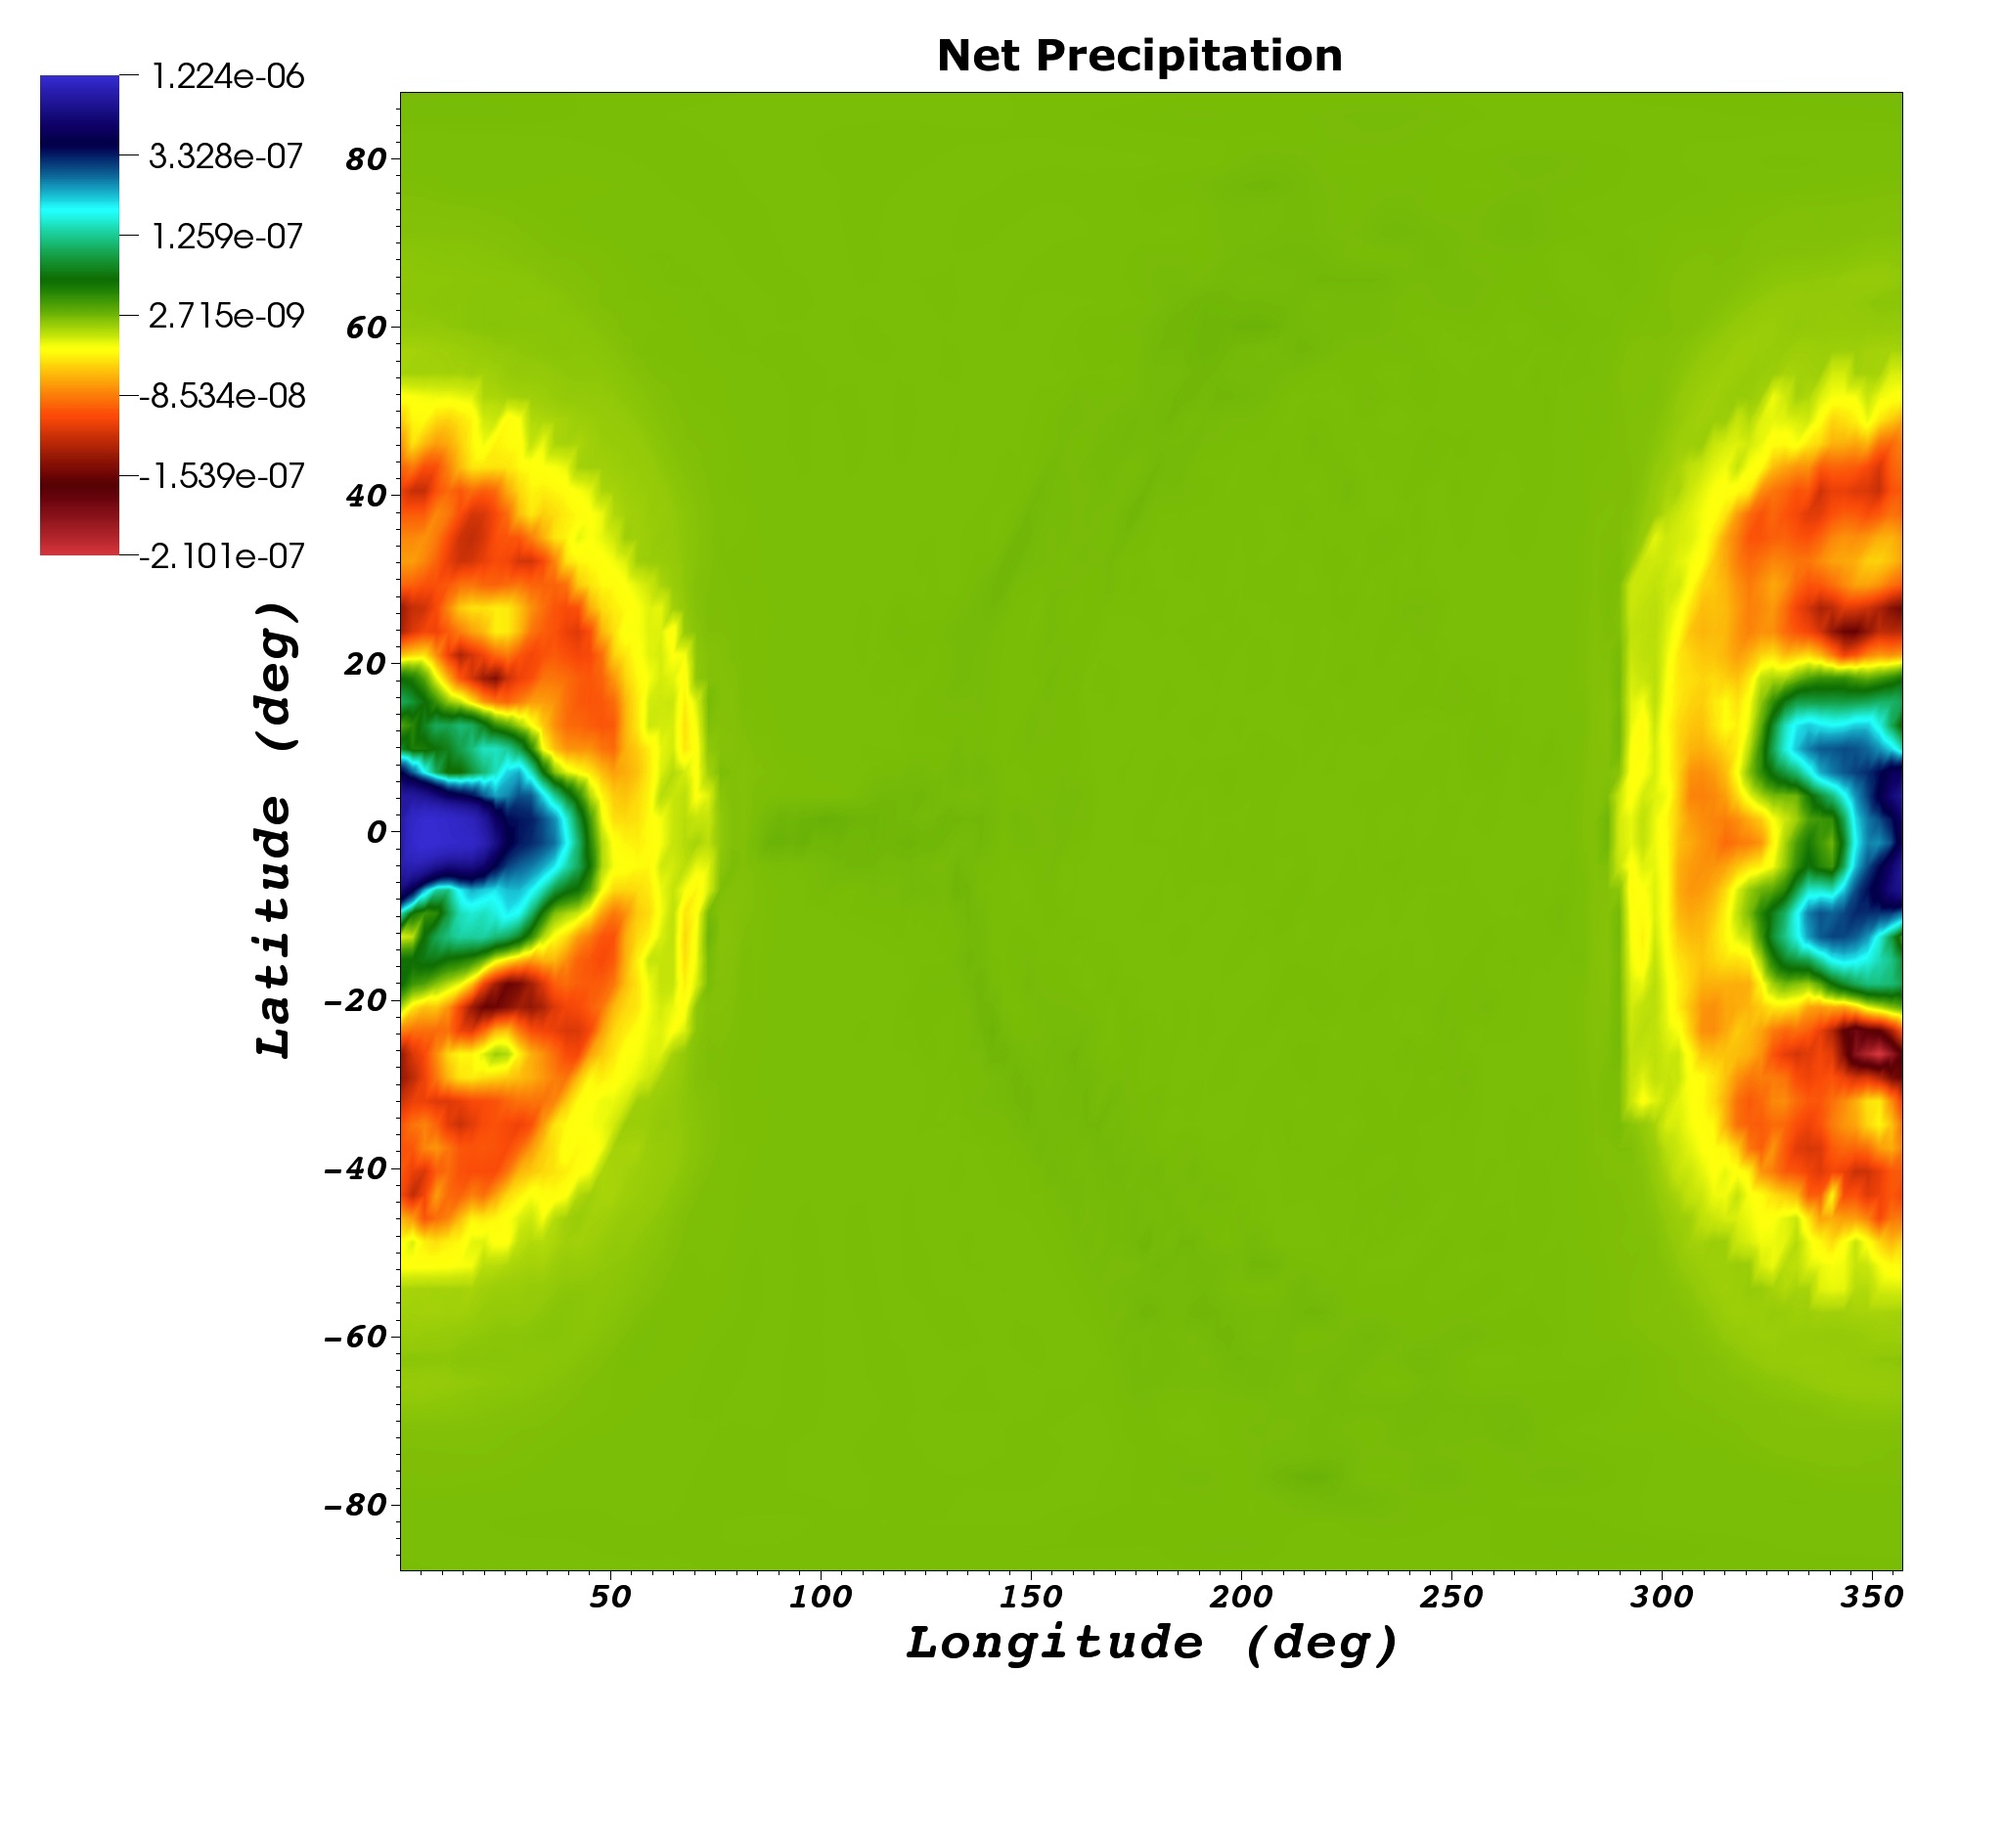
Precipitable water in the atmosphere is also largely confined to the dayside, where evaporation strongly peaks at the substellar point. The circulation is able to advect, preferentially eastward, a modest amount of moisture to the nightside, where it is precipitated as snow. Most of the snow precipitation occurs in an annulus on the dayside, but the weak snow precipitation rates on the nightside are nevertheless interesting in terms of the ice accumulation rates they imply (see below). As noted before by Merlis & Schneider (2010) in comparable simulations, strong net precipitation occurs in the vicinity of the substellar point, with net evaporation over most of the dayside. All of the properties illustrated in Figure 1 are qualitatively shared by the other models listed on Table 1, which suggest that they are rather general for tidally-locked habitable planets around M-dwarf stars.
For each of the models, Table 1 also lists the snow precipitation rate averaged over the planetary nightside. Values range from to mm day-1, in broad agreement with the mm day-1 nightside rate reported by Joshi (2003).666Note that Joshi’s simulations are not fully consistent for M-dwarf habitable planets in that they assume an Earth-like planetary rotation rate ( h). This range largely reflects the efficiency of the circulation at advecting moisture to the nightside, which is noticeably weaker in the Earth.slow model (see also Merlis & Schneider 2010). Nevertheless, with such precipitation rates, a layer of km of ice would take between and yr, and typically yr, to accumulate on the nightside (accounting for the factor difference between the density of snow and ice). These timescales are quite short and they suggest a rapid change in the hydrological cycle of planets with no more than a few km of ocean (such as Earth), following their capture into 1:1 spin-orbit resonance. It is thus important to understand the nature of this ice layer in detail if one is to address the climate of habitable planets around M-dwarfs.
3 Nightside Ice Sheet
3.1 General Considerations
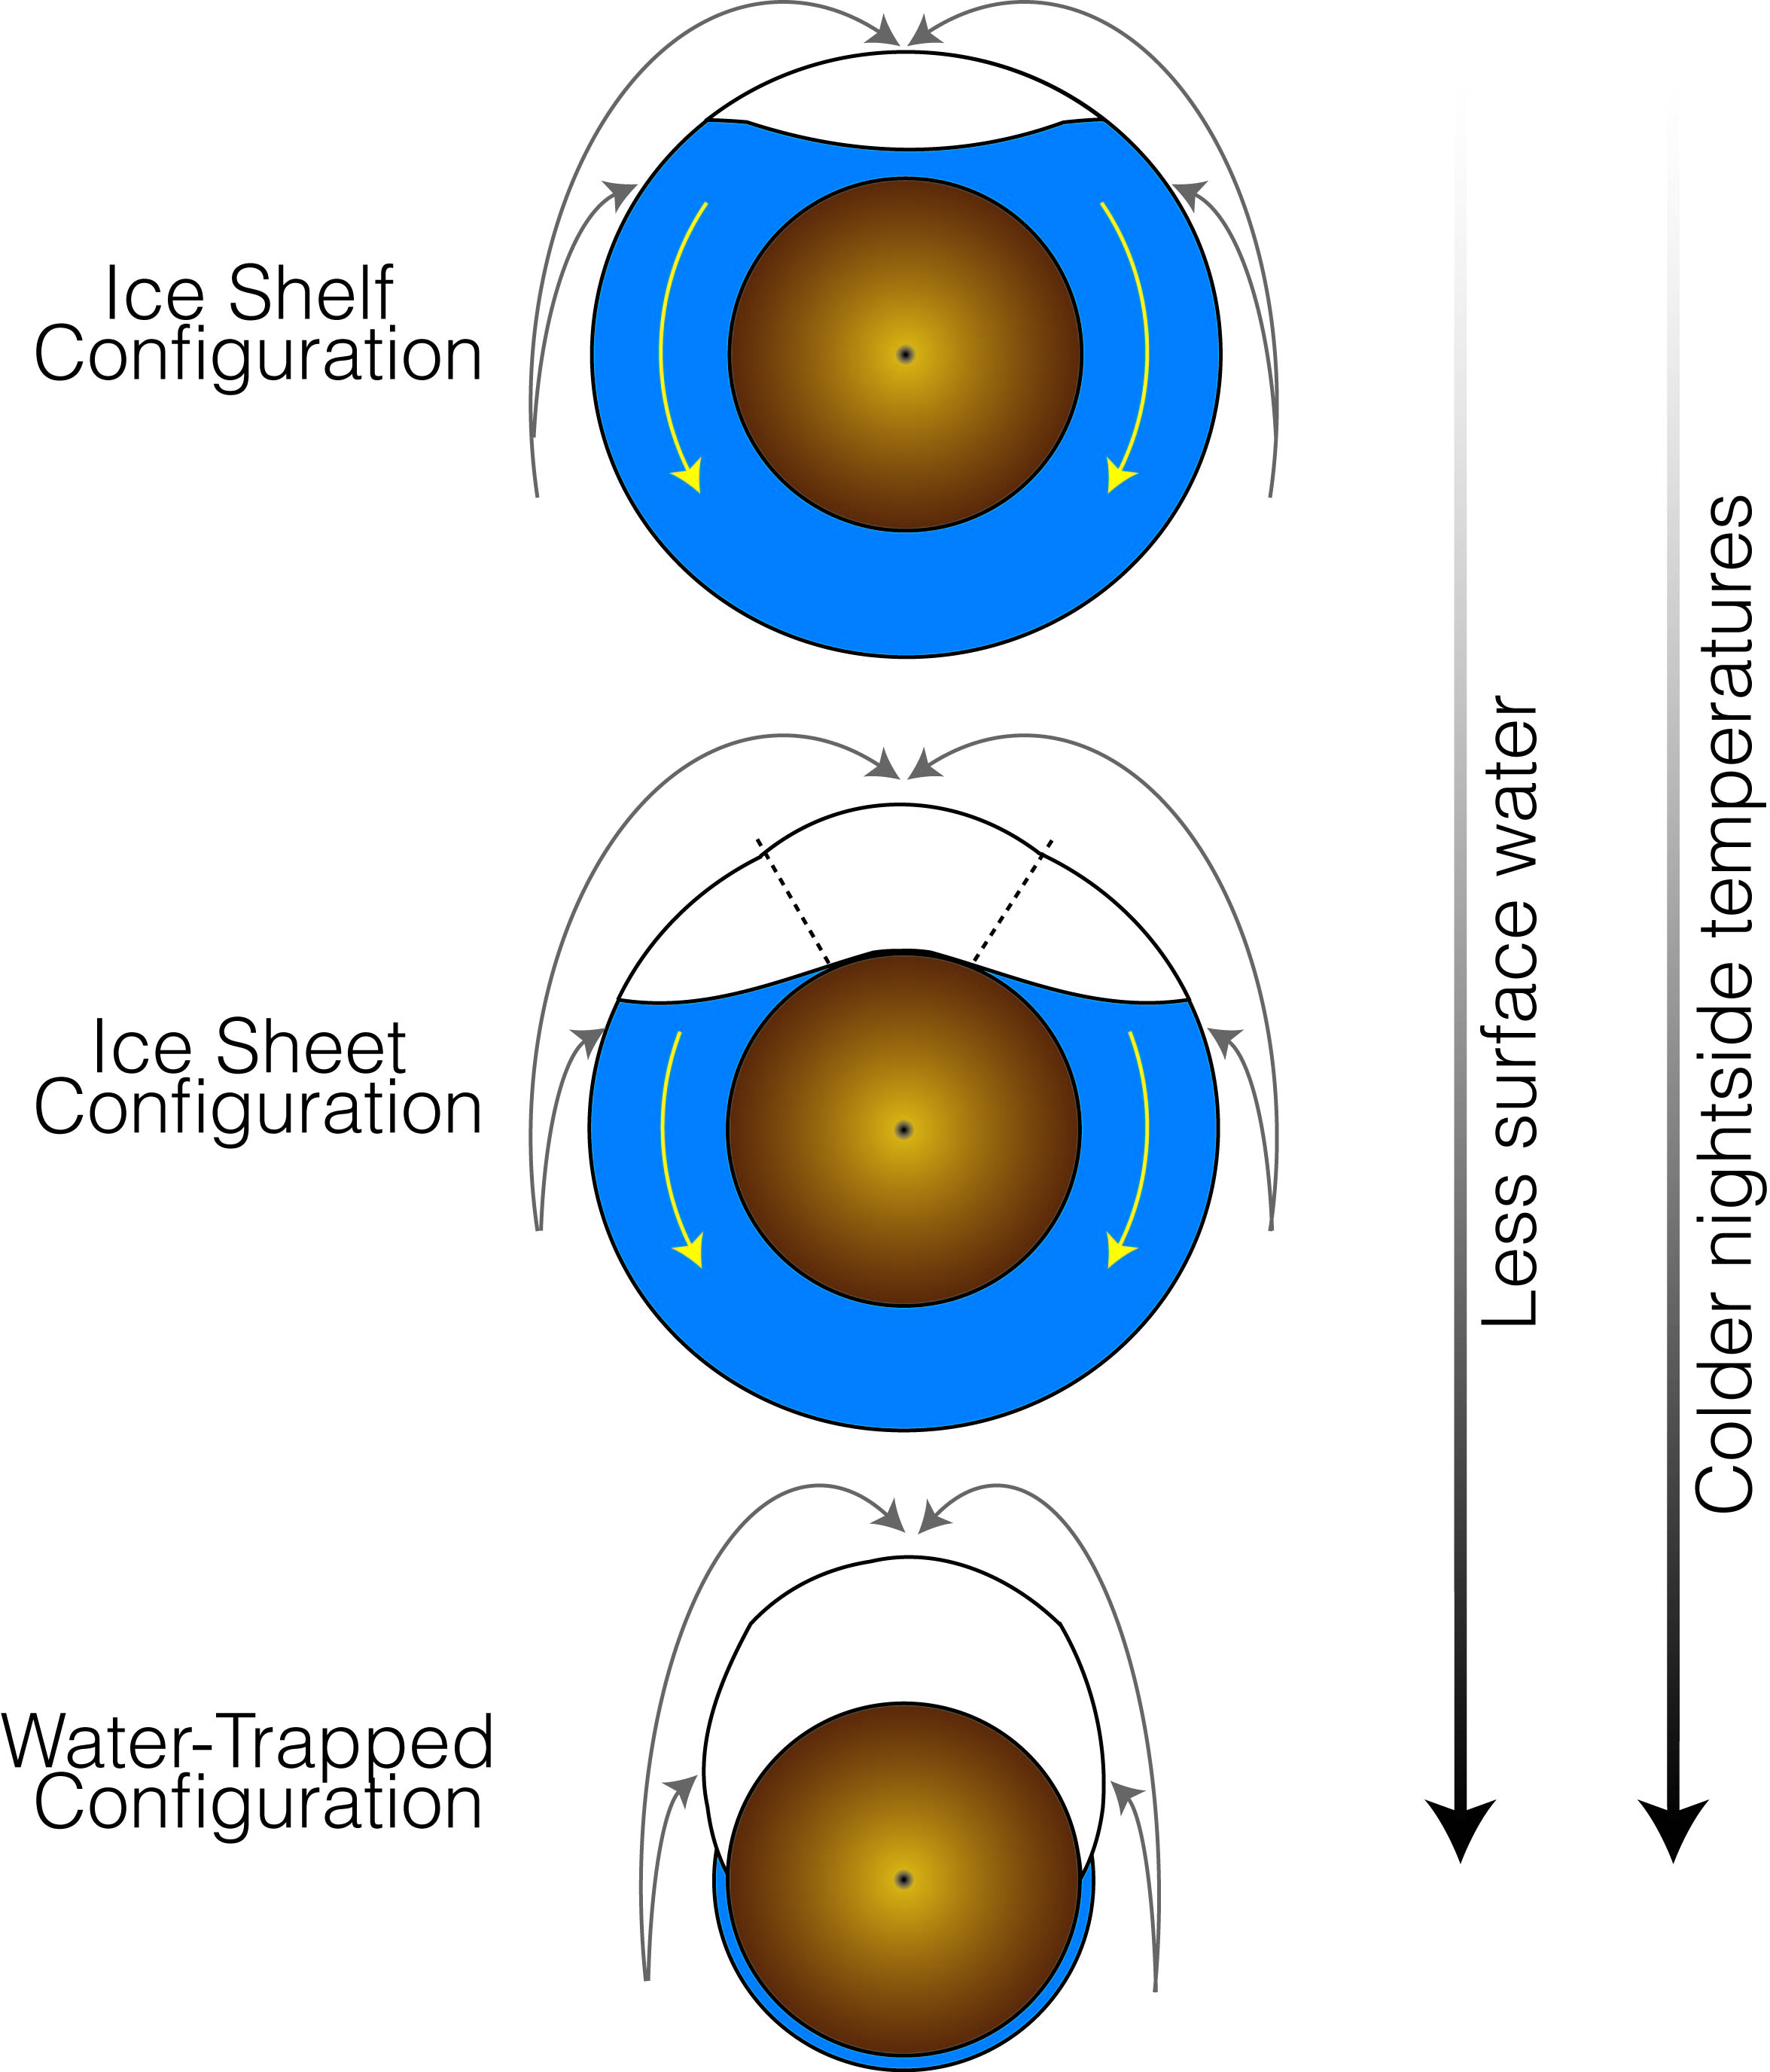
Figure 2 illustrates schematically three possible configurations for the nightside ice layer on a tidally-locked planet. For the sake of argument, a uniformly flat ocean basin has been assumed and continents have been ignored, though the consequences of lifting these assumptions are reconsidered in §4.
As discussed quantitatively in §3.3, a conducting ice layer carrying a given geothermal heat flux has a limited thickness because melting eventually occurs at its base.777At least for ice pressures s MPa, which is the relevant regime for the water-deficient planets of interest here. This limiting thickness is smaller for warmer surface temperatures at the top of the ice layer. Tidally-locked planets with relatively mild nightside temperatures and/or a large surface water inventory will thus have their nightside ice layer float over a sub-glacial ocean connecting to the dayside ocean. This scenario, which is the one emphasized by Health et al. (1999; see also Joshi 2003), is depicted in the first “ice shelf configuration” shown in Fig. 2. In this configuration, rain and snow precipitate on the nightside, as a result of moisture advection from the dayside (gray arrows). Snowfall does not add to the ice layer thickness, however, because the thickness is limited by basal melting. The steady-state hydrological cycle is closed with a return flow of water to the dayside via the sub-glacial ocean (yellow arrows). The ice+ocean layer thickness must be essentially uniform over the entire globe to satisfy lateral pressure equilibrium at the base, or rapid water flows would ensue to enforce this equilibrium.888Note that the thick ice shelf representation in Fig. 2 is highly idealized since ice shelves on Earth are known to spread out and thin out efficiently, and they can experience catastrophic break-ups (e.g., Tziperman et al. 2012, Scambos et al. 2009).
As depicted by the second“ice sheet configuration” in Fig. 2, on a planet with less surface water and/or colder nightside temperatures, it becomes possible for part of the ice layer not to exceed the critical thickness for melting. This region of the ice layer is then grounded, as shown in between the two radial dotted lines in Fig. 2. Rain and snow precipitation act the same as in the previous configuration, with the important exception of the grounded ice sheet. Ice is able to accumulate in this ice sheet and sustain a sizable pressure gradient at its base (indicated by a bulged ice layer in Fig. 2) because of the considerable ice viscosity. Ice flows down the basal pressure gradient in the ice sheet and, in steady state, the hydrological cycle must satisfy a new mass balance: over the grounded ice sheet, ice accumulation from snowfall must balance the flow of ice exiting the ice sheet at its boundary with the sub-glacial ocean. Since ice accumulation is made possible by the enormous difference of viscosity between the grounded ice flow (in the ice sheet) and the water flow (in the ocean) covering the rest of the globe, an ice sheet model describing the viscous flow of ice is necessary to evaluate the amount of ice present in the ice sheet.
The third “water-trapped configuration,” which is of particular interest to the present study, is essentially an extreme version of the “ice shelf configuration.” On a planet with even less surface water and/or even colder nightside temperatures, one can in principle have the great majority of the surface water trapped in the slowly flowing ice sheet, with little water present in liquid form on the dayside. A finite liquid dayside inventory remains a necessity to close the hydrological cycle. Indeed, it is the evaporation, advection and subsequent precipitation of this dayside water on the nightside that must balance the flux of ice flowing back to the dayside, but the size of this dayside liquid reservoir could in principle be very small, as depicted in Fig. 2. To evaluate how much water can potentially be trapped on the nightside in this configuration, I now turn to quantitative ice sheet models.
3.2 Isothermal Ice Sheet Models
Thermo-mechanical models of ice sheets exist (e.g. Bueler et al. 2007; Fowler 2011) but I find it convenient for the present purpose to consider separately mechanical and thermodynamical constraints to gain insight into the behavior of nightside ice on a tidally-locked planet. The use of a simple, isothermal ice sheet model can be justified by noting that a comparable diffusion equation can be derived for the non-isothermal case (e.g., Fowler 2011) and that ice sheets generally exhibit strong vertical shear preferentially near their bottom boundary, i.e. over a limited range of temperatures. The evolutionary equation satisfied by a thin isothermal ice sheet with a flat base and a no slip boundary condition at its bottom is (Fowler 2011)
| (1) |
where is the ice thickness, kg m-3 is the mean density of ice, is the surface gravity, Pa yr-1 is a typical value of the flow rate constant (related to the ice viscosity near the bottom of the ice sheet), is the typical value used in Glen’s ice flow law to model the non-Newtonian nature of the ice fluid and is the ice accumulation rate (assumed constant to model uniform snowfall over the ice sheet). This equation is a non-linear diffusion equation for the ice thickness, , satisfying the conservation of mass and momentum in the shallow ice approximation ( much less than the horizontal length-scale of the ice sheet). The quantity in bracket is the ice flux, with an effective diffusion coefficient that depends strongly on the ice thickness and its horizontal gradient.
Equation (1) admits analytical solutions (e.g., Bueler 2003) and I shall use such a simple solution here. I solve the adimensional, steady-state axisymmetric version of Eq (1) for the standard value in Glen’s law,
| (2) |
where is the adimensional cylindrical radius from the ice shelf center (located in ), marks the outer edge of the axisymmetric ice sheet (defined by dimensionally), is the adimensional ice thickness, and
| (3) |
is the ice thickness scale factor.
I integrate this equation a first time with respect to and use the central boundary condition in (the ice “ridge”). I integrate a second time with respect to and use a finite, arbitrary thickness for the boundary condition in . This boundary condition guarantees a finite ice flux at the point where the ice ceases to be grounded and reaches flotation over water (indicated by the radial dotted lines in the middle panel of Fig. 2), at which point the ice sheet equation ceases to be valid (fowler 2011). The resulting dimensional solution for the ice sheet thickness is
| (4) |
This solution generalizes the singular case already known in the literature (e.g., Bueller 2003). The case is more satisfactory for the present application in that it permits a finite ice flux at the outer edge (where flotation is reached) to balance the ice accumulation rate integrated over the entire ice sheet.
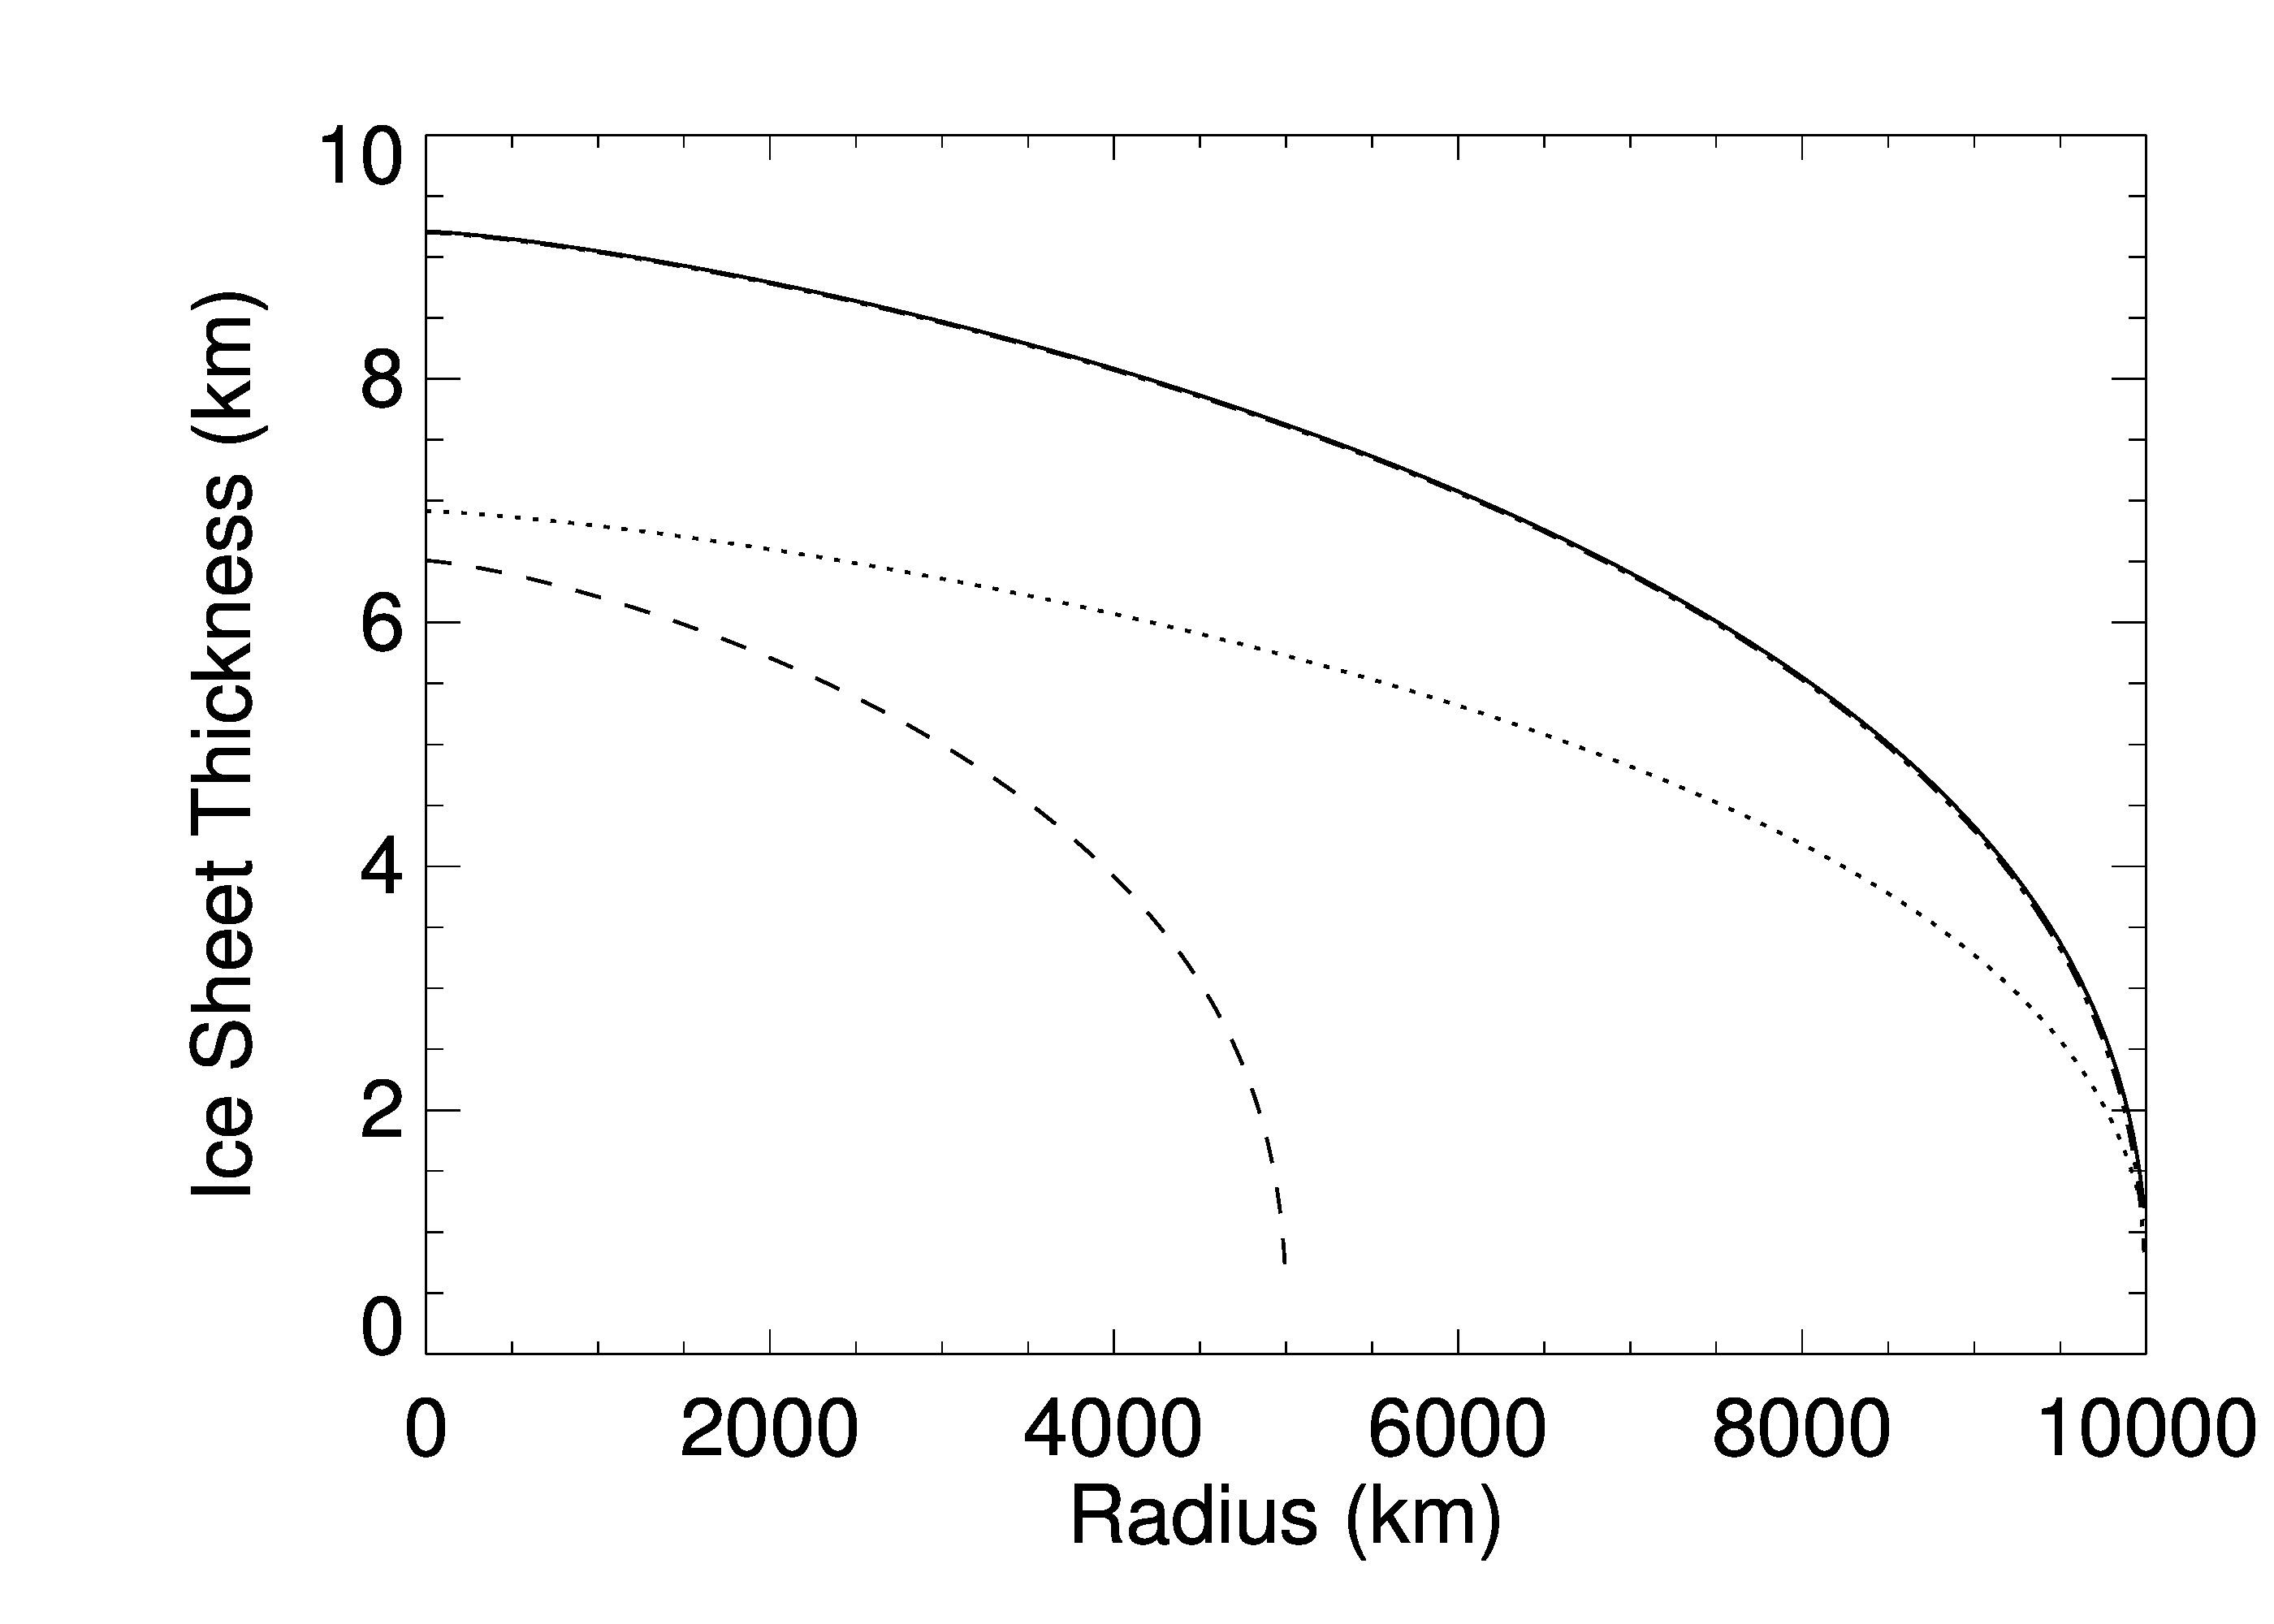
Figure 3 shows a few ice thickness profiles derived from Eq. (4). The solid line is the solution for an ice sheet of km in radius, a uniform ice accumulation rate999Note that ice accumulates at a rate approximately times slower than snow precipitates, in proportion to the ratio of ice to snow density. mm day-1 and a boundary thickness km. The dash-dotted line, which is nearly indistinguishable from the solid line, corresponds to a similar solution except for m, while the dotted line corresponds to a reduced accumulation rate mm day-1. The dashed line is the solution for an ice sheet of km in radius (with accumulation rate mm day-1 and m). The corresponding values of the ice thickness scale factor in these four solutions are , , and m, respectively.
An exploration of the parameter space of these simple ice sheet solutions shows that the value of has only a small impact on the global ice profile, as long as . The scale factor itself is a good indicator of the overall ice thickness across the profile (and thus the total mass in the ice sheet), as illustrated in Fig. 3. Stronger (weaker) ice accumulation rates lead to thicker/steeper (thinner/shallower) ice profiles, as expected from the ice sheet adopting a steady-state thickness profile such that the local ice flux at any radius carries an amount of ice equal to the integrated accumulation rate within that radius (Eq. (2)). It is this mass balance that sets the typical ice thickness in these models.
The climate models discussed in §2 do suggest the possibility of an ice sheet extending globally over the entire nightside, which corresponds to an ice sheet radius km on an Earth-size planet.101010All else being equal, a super-Earth has ice sheets times thinner from stronger gravity, although a global ice sheet could also be thicker from the extra horizontal scale factor in Eq. (3). For ice accumulation rates representatives of the average nightside precipitation in these same climate models (– mm/day of snow, see Table 1), a typical ice thickness is thus – km for an ice sheet of radius km (see also Eq. (3)). Such ice depths would imply a considerable amount of ice being trapped on the nightside. As we shall now see, such a massive ice trap may be limited by additional thermodynamical constraints.
3.3 Thermodynamic Melting Constraint
Ice thickness is also limited by the melting condition for ice at high pressure, at the base of the ice sheet. In its simplest form, this process is modeled as a vertical, steady-state conduction problem for the ice layer transporting a specified geothermal flux to the surface. Here, I adopt for concreteness the formalism of Abbot & Switzer (2011), which accounts for the important variation with temperature of the ice thermal conductivity. The resulting exponential temperature profile for the steady-state conductive ice layer yields a maximum thickness before melting,
| (5) |
where the water ice conductivity is given by , W m-1, is the ice temperature in K, is the thermal flux being conducted ( W m-2 for Earth’s geothermal flux),111111The geothermal flux may scale up with planet mass to the power one half, so that ice layers would be comparatively thinner on super-Earths (Abbot & Switzer 2011). K is a representative high-pressure water melting temperature and is the temperature boundary condition at the top of the ice layer. is determined by surface-atmosphere exchanges which are modeled explicitly in the climate simulations described in §2.
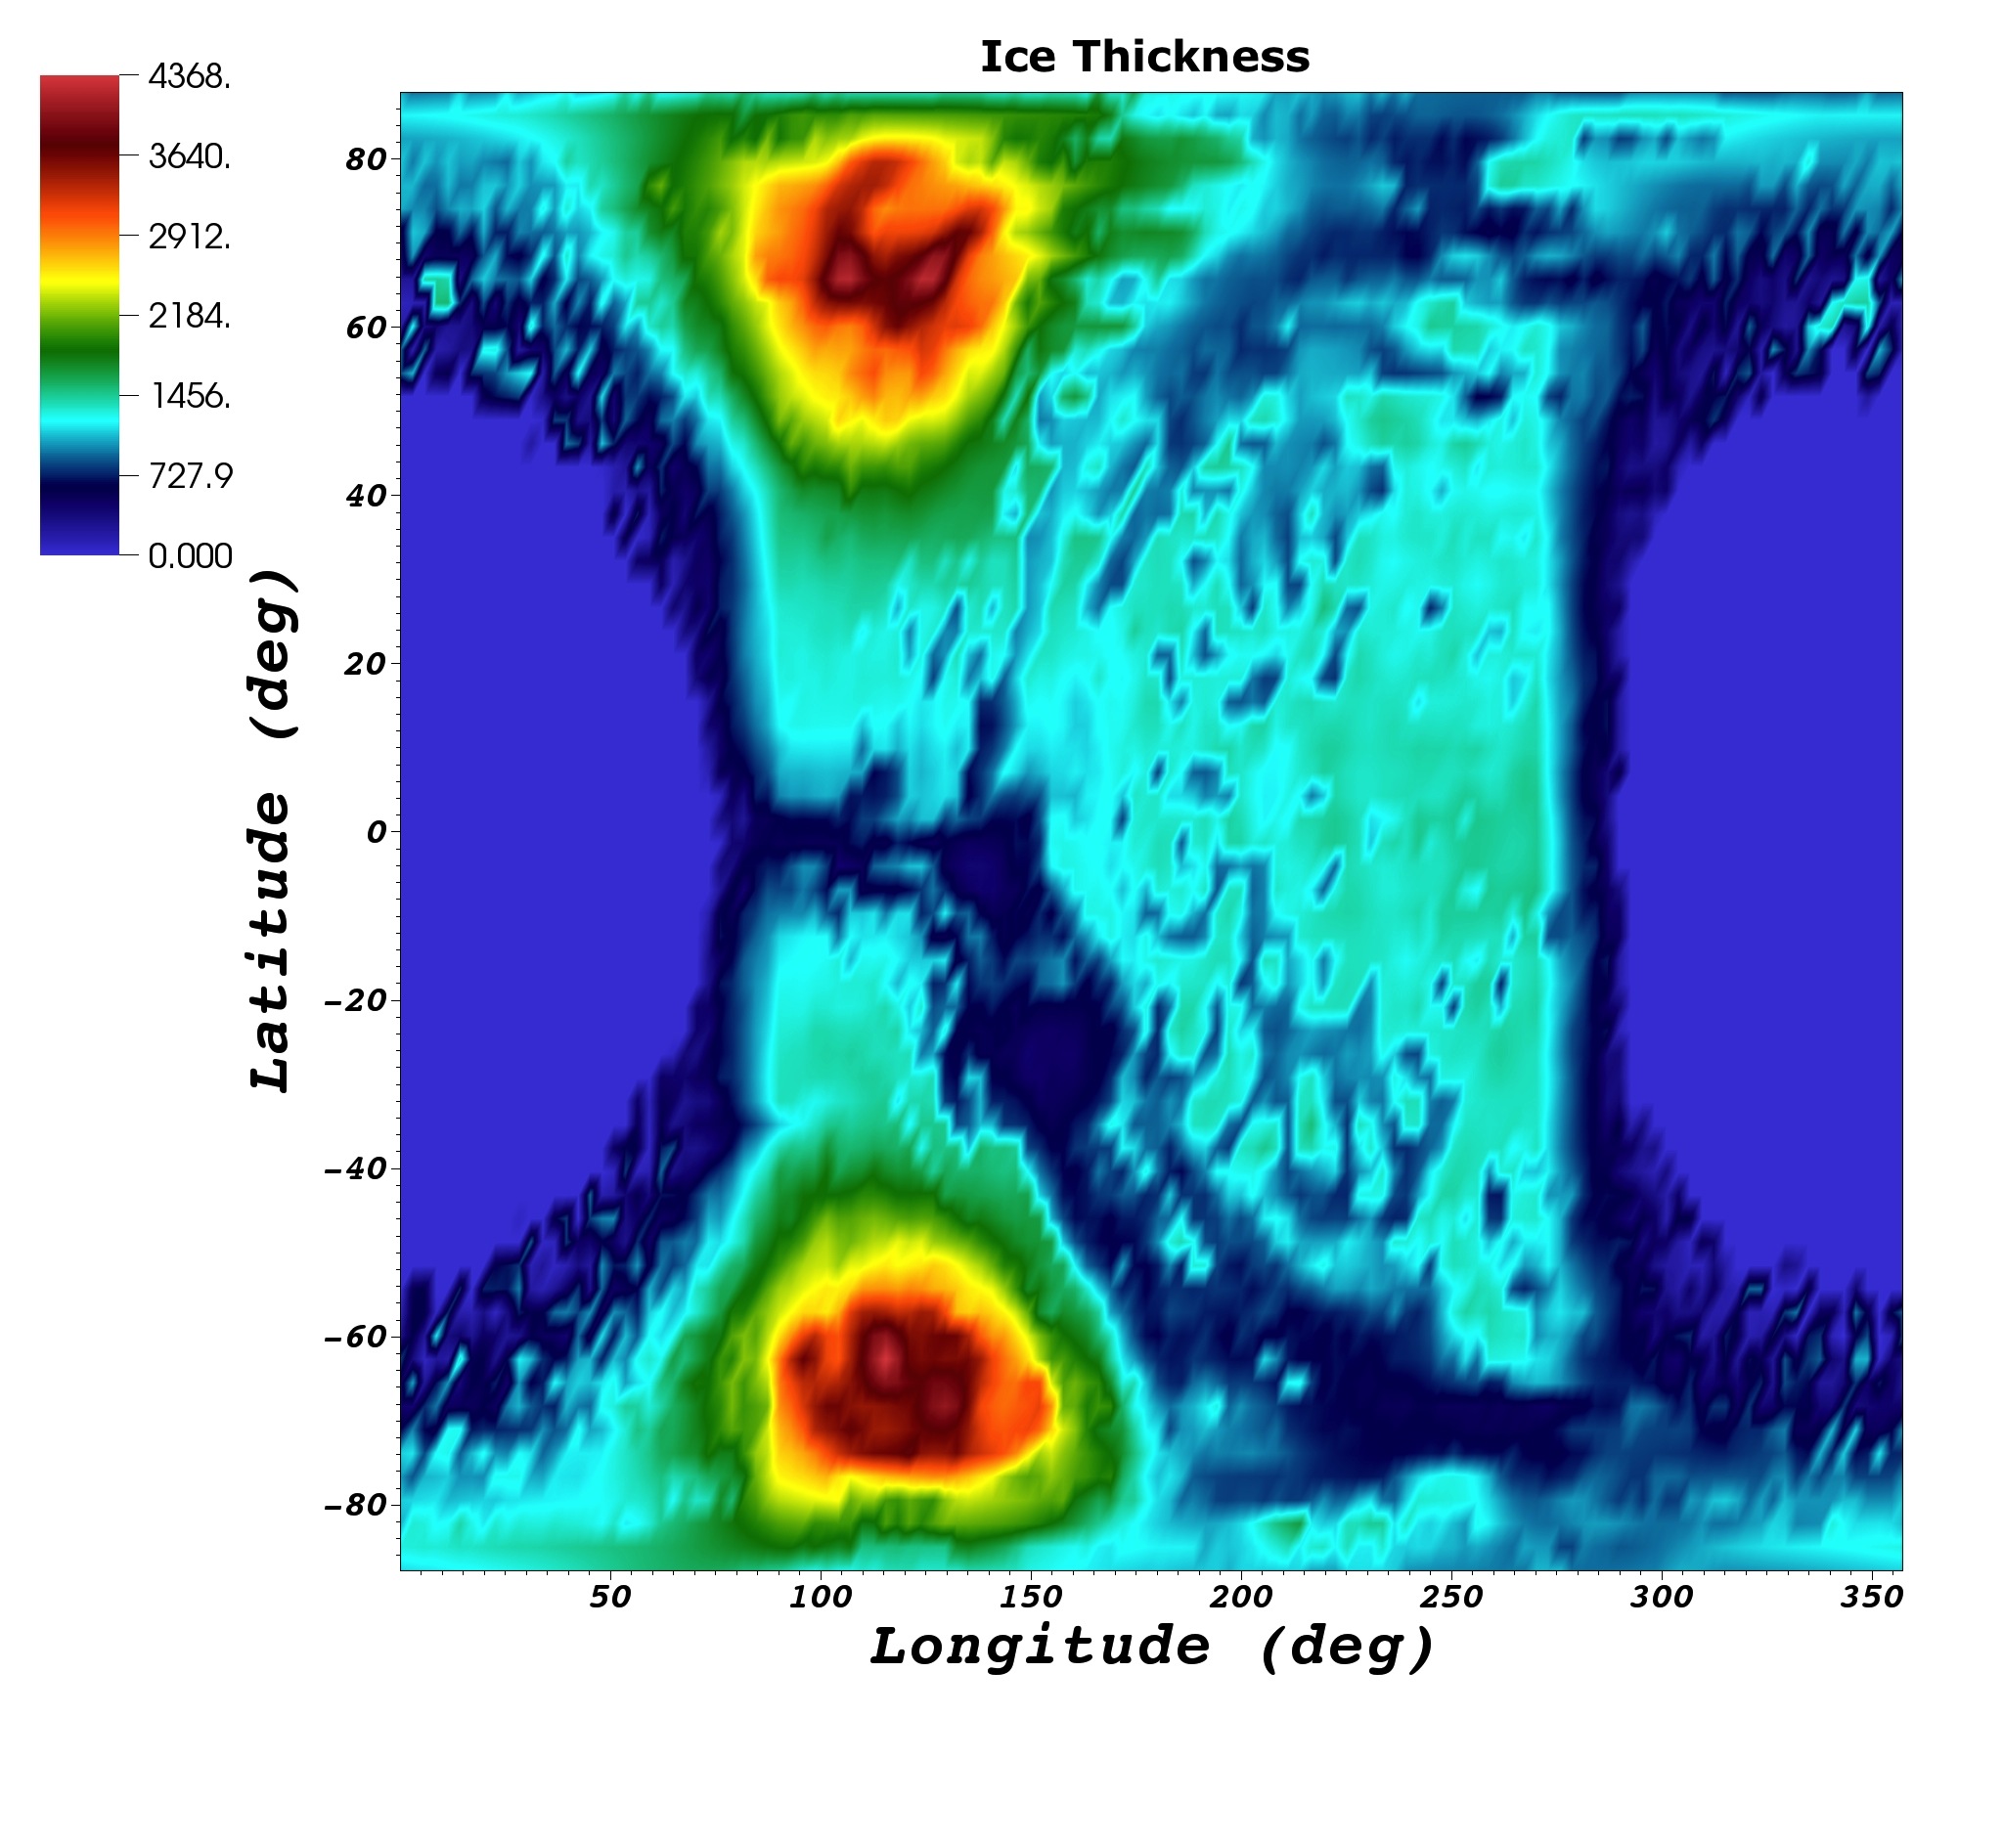
It is therefore straightforward to translate a surface temperature map into a map of maximum ice thickness before melting occurs, according to Eq. (5). An example is shown in Fig. 4 for the Aquaplanet model, assuming Earth’s geothermal flux for . This map shows that the melting constraint on the ice thickness is stringent. Most of the nightside ice has a maximum depth – km before melting occurs, with a colder region of a few thousand km in extent allowing for thicker ice (up to km depth). A first, conservative limit on the amount of ice that can be trapped on the nightside of a tidally-locked planet can thus be obtained by considering that this thermodynamic melting constraint provides an effective limit to ice accumulation. Since most of the nightside exhibits surface temperatures which may not permit ice thickness in excess of – km without melting, the considerably larger values of ice thickness (- km) that would otherwise accumulate according to steady-state ice sheet models may not be realized in practice, because basal melting would prevent such large ice buildup. In this interpretation, the actual ice thickness may be close to marginal basal melting since steady-state mass balance, as described by simple isothermal ice sheet models, would systematically have more ice accumulate, until basal melting limits this accumulation.
A weaker, alternative limit on the amount of ice trapped on the nightside of a tidally-locked planet can be obtained by considering the possibly important role of basal water flows on the energetics of the ice sheet. When basal melting occurs, it is natural for basal water to advect heat away from the regions where the ice is thickest, i.e. down the basal pressure gradient. Such a basal water flow, carrying heat away from melting regions, can reduce the heat flux effectively conducted through the overlying ice sheet (e.g., Cuffey & Paterson 2010), allowing thicker ice than was suggested by our use of the simple one-dimensional criterion in Eq. (5) (by virtue of being less than ). Although it is difficult to make quantitative predictions for this effect without a basal water flow model, a strong hypothesis sometimes adopted in multi-dimensional ice sheet modeling is to assume that basal water efficiently escapes from under the ice sheet, carrying away any excess heat needed for melting (e.g., Hulbe & MacAyeal 1999). In such a limit, the ice sheet thickness is no longer strongly limited by melting but it would instead be determined by the ice sheet mass balance through accumulation (as modeled by Eq (1) for instance).121212In this interpretation, one also implicitly assumes that the thick, wet-based ice does not experience sliding because it is trapped by thinner, frozen-base ice at the periphery of the ice sheet, and that any basal water escapes from under the ice sheet through sufficiently localized sub-glacial streams. Regular emptying of this ice reservoir through rapid sliding events could in principle occur, by analogy with ’Heinrich’ events for the Laurentide ice sheet during Earth’s last glacial period (e.g., MacAyeal 1993).
Although idealized, these two separate limits for ice thickness, which we refer to as the strong and weak melting constraints, are useful in bracketing the possible behaviors of ice on the nightside of a tidally-locked planet, when basal melting occurs. After integration, the ice distribution following the strong melting constraint, shown in Fig. 4, amounts to an equivalent depth of m spread over the entire globe. Similar averages131313For simplicity, I do not differentiate between land and ocean when making such averages. The role of continents is reconsidered in §4. for the other climates models listed in Table 1 range from to m. This range of values largely reflects how cold the nightside is in each model, with the lowest efficiency of heat advection to the nightside found in the model Earth.low (with a low atmospheric mass). By contrast, the ice distributions shown as solid and dotted lines in Fig. 3, which could in principle be realized according to the weak melting constraint, amount to equivalent depths (spread over the entire globe) of and m for ice sheets covering the entire nightside on an Earth-sized planet.
The amount of surface water on Earth (essentially in the oceans) corresponds to an average depth of m once spread over the globe (e.g., Charette & Smith 2010). Adopting the strong melting constraint, one concludes that the climate models listed in Table 1 could trap from a seventh up to almost a third of the Earth’s surface water on their nightsides, with the majority of models trapping about a quarter to a fifth. Following the alternative weak melting constraint, when efficient sub-glacial water-flows are present, one concludes that about -% of the Earth’s surface water could be trapped on the nightside of an Earth-sized planet.141414Such large amounts of nightside ice are likely overestimated because the corresponding ice sheet thickness, shown in Fig. 3, approaches the tropospheric height of the atmosphere, which would reduce snow precipitation on the nightside. To evaluate the magnitude of this effect, which will act to reduce the ice thickness, one will have to consistently include the orographic blueprint of a thick ice sheet in specially-designed climate models. In both cases, this is considerably more that the amount of water in ice form on Earth and large enough that water-deficient planets may be at risk of trapping most of their surface water on their nightside.
It is difficult, however, to make robust predictions for the total amount of water present on terrestrial planets on the basis of planet formation models. Simulations of in situ formation by Raymond et al. (2007) suggest that habitable zone planets around M-dwarfs could form with as little as two orders of magnitude less bulk water than Earth, which would likely result in significantly reduced amounts of surface water as well. On the other hand, Ogira & Ida (2009) argue that water could be abundantly present on terrestrial planets in the habitable zone of M-dwarfs if planetary migration efficiently brings in bodies from beyond the ice line. Depending on details of the protoplanetary disk structure and how it influences the planetary migration process, both scenarios could be at work in nature. M-dwarf planets could also lose much of their initial surface water inventory via atmospheric escape during the intense tidal heating phase that may precede their spin-orbit resonant capture (Barnes et al. 2013). I will adopt the simple view here that at least some terrestrial planets in the habitable zone of M-dwarfs could be quite deficient in surface water.
Therefore, among the population of habitable Earth-like planets around M-dwarfs, those who possess only a fraction of the Earth’s surface water inventory could trap the great majority of their water in the form of nightside ice. Although the dayside of such water-trapped worlds may end up being quite dry, it is worth emphasizing again that a closed hydrological cycle requires liquid water to remain present on the dayside to compensate for the return flow of ice from the nightside (see Fig 2 and discussion below). Evaluating exactly how much liquid water is present on the dayside of a water-trapped world is challenging151515For example, Leconte et al. (2013) have presented an idealized model for a water reservoir present at the edge of the icy region, without accounting for constraints on the nightside ice flow. and, as I shall briefly describe below, it is closely related to other long-term climate issues for such planets.
4 Discussion and Conclusion
Using a combination of climate and ice sheet models, I made the case for tidally-locked habitable planets around M-dwarfs being able to trap most of their surface water in the form of nightside ice, provided they are sufficiently volatile-deficient. Quantitatively, planets subjected to an Earth-equivalent insolation and possessing less than about a quarter the Earth’s surface water inventory could rapidly find themselves into a water-trapped configuration, following their capture into 1:1 spin-orbit resonance. The critical amount of surface water below which a water-trapped configuration can occur will probably vary with the magnitude of insolation received by such planets, although this issue cannot be easily disentangled from the atmospheric CO2 content and the climate being regulated by global-scale weathering, which has a potentially strong dependence on the continental distribution for tidally-locked planets (Edson et al. 2011).
Clearly, the main argument constructed in this work relies on a number of assumptions and approximations made in the climate and ice sheet models, which all deserve further scrutiny. For example, oceanic heat transport to the nightside, which is not accounted for in either type of models, could provide an extra heat source that may act to limit the ice thickness relative to the results discussed above.161616Under particular conditions, tidal dissipation could contribute an additional heat flux acting to limit the nightside ice layer thickness (e.g., Barnes et al. 2013; Leconte et al. 2013). In the limit where this transport is efficient, significant ice accumulation may only occur on the fraction of the planetary nightside that is covered by continents,171717I note that the literature on Earth’s True Polar Wander suggests that continental distribution and planetary moments of inertia are not strongly coupled attributes (e.g., Kirschvink et al. 1997, Raub et. al. 2007). This also suggests a lack of correlation between the continental distribution and the day/night hemispheres that end up being locked into 1:1 spin-orbit resonance by tides on a close-in planet. thus reducing the size of the ice trap. This is an example of how the detailed topography and ocean basin configuration on a water-trapped world can have a strong impact on its climate.
Another example of the important role played by the continental distribution and ocean basin configuration concerns the amount of residual liquid water left on the dayside of a water-trapped world. In the climate models discussed in §2, the ability to precipitate snow at the rates listed in Table 1 largely relies on evaporation over oceans and moisture transport to the nightside by the atmosphere. In a water-trapped configuration, as the dayside oceans gradually dry up, their evaporative surface will shrink in a way that depends on the detailed ocean basin configuration. The atmospheric moisture transport to the nightside may also be affected when a significant lowering of the dayside sea level occurs. If this were to result in substantially decreased nightside precipitation rates, the nightside ice sheet would tend to accumulate less ice than evaluated in §3 (see, e.g., scaling with in Eq. (3)). Eventually, the ice layer depth would not be limited by melting at the base but simply by mass balance at very small accumulation rates. This regime, which would require snow precipitation rates orders of magnitudes smaller than the values listed in Table 1, may happen on some water-trapped worlds but not others, when dayside oceans dry up. Regardless, this reasoning illustrates how a reliable evaluation of the amount of liquid water left on the dayside of a water-trapped world must rely on a closed hydrological cycle, i.e. one that accounts for two-way exchanges between the dayside and the nightside water reservoirs, in a manner more explicit than the isolated ice sheet models considered in §3.
The amount of residual liquid water on the dayside of water-trapped worlds will also depend on the efficiency of rock weathering at regulating the CO2 content of the atmosphere. Abe et al. (2011) argue that weathering will continue to operate on land planets but the efficiency of the process may differ from what it is on Earth, depending on the availability of surface water for different land regions.181818For example, desertification could occur in regions where evaporation dominates over precipitation, such as the dayside annular region away from the substellar point with negative net precipitation in Fig. 1. On a planet with dried-up dayside ocean basins, more rock will be exposed to the atmosphere but the opportunity for ocean weathering would also largely disappear, with unclear consequences for the global weathering rate (e.g., Abbot, Cowan & Ciesla 2012). Quantitatively, the models Earth.lowCO2 and Earth.highCO2 listed in Table 1 exhibit m differences in their ice equivalent thicknesses, relative to the model Earth1 with 360ppm of CO2. This makes it clear that even modest adjustments to the atmospheric CO2 content by weathering can have a significant impact on the residual dayside surface water inventory of a water-trapped world.
A related issue is the fate of the large CO2 reservoir stored in the ocean (about times that in the atmosphere on Earth). Although this reservoir may shrink in proportion to the total ocean mass on volatile deficient planets, if one assumes a fixed CO2 ocean concentration, it could still amount to a significant and sudden CO2 increase if released in the atmosphere when dayside oceans dry-up on a water-trapped world. This excess CO2 would presumably be weathered on long-enough timescales, so that the long-term climate would remain determined by detailed balance between the hydrological cycle and the carbon-silicate cycle.
The trapping of the majority of the surface water inventory in the form of nightside ice does not necessarily constitute a challenge to the habitability of water-trapped worlds. Abe et al. (2011) found more extended habitability limits for land planets than for aquaplanets and they illustrated how land planets are better at holding on to their water, which is lost through atmospheric escape, even if they start with less water than aquaplanets (see also Leconte et al. 2013; Zsom, Seager & de Wit 2013). Water-trapped worlds with dry daysides and frozen nightsides may thus offer similar advantages as land planets for habitability, in comparison with worlds where more abundant water is free to flow around the globe (first configuration shown in Fig. 2). A water-trapped configuration may, however, lead to more strongly localized habitable regions, depending on the availability and detailed distribution of surface water on the dayside. It would thus be interesting to determine to what extent water-trapped and water-free configurations can be discriminated from one another observationally. This may be challenging if the surface conditions are not directly accessible (e.g., Benneke & Seager 2012) and if the stratospheric water content probed by transmission spectroscopy is not too different between these two configurations (e.g., Fig. 12 of Joshi 2003).
References
- (1)
- (2) Abe, Y. et al. 2011, Astrobiology 11, 443
- (3)
- (4) Abbot, D. S., Cowan, N. B., Ciesla, F. J. 2012, ApJ 756, 178
- (5)
- (6) Abbot, D. S., Switzer, E. R. 2011, ApJ 735, L27
- (7)
- (8) Barnes, R. et al. 2013, Astrobiology 13, 225
- (9)
- (10) Benneke, B., Seager, S 2012, ApJ 753, 100
- (11)
- (12) Bueler, E. 2003, Construction of steady state solutions for isothermal shallow ice sheets. Technical Report 03-02, UAF DMS.
- (13) (http://www.cs.uaf.edu/bueler/steadyiso.pdf)
- (14)
- (15) Bueler, E., Brown, J., Lingle, C. 2007, Journal of Glaciology 53, 499
- (16)
- (17) Charbonneau, D., Deming, D. 2007, arxiv:0706.1047
- (18)
- (19) Charette, M. A., Smith, W. H. F. 2010, Oceanography 23, 112
- (20)
- (21) Correia, A. C. M., Laskar, J. 2011, Exoplanets, edited by S. Seager. Tucson, AZ: University of Arizona Press, p. 239
- (22)
- (23) Cuffey, K., Paterson, W. S. B. 2010, The Physics of Glaciers, 4th Ed. (Elsevier)
- (24) Dressing, C. D., Charbonneau, D. 2013, arxiv:1302.1647
- (25)
- (26) Edson, A. et al. 2011, Icarus 212, 1
- (27)
- (28) Edson, A. et al. 2012, Astrobiology 12, 562
- (29)
- (30) Fowler, A. 2011, Mathematical Geoscience (Springer)
- (31)
- (32) Fraedrich, K., Jansen, H.,Kirk, E., Luksch, U., Lunkeit, F. 2005, Meteorol. Z. 14, 299-304.
- (33)
- (34) Fressin, F. et al. 2013, ApJ 766, 81
- (35)
- (36) Heath, M. J., Doyle, L. R., Joshi, M. M., Haberle, R. M. 2009, Origins of Life and Evolution of the Biosphere 29, 405
- (37)
- (38) Heng, K., Menou, K. & Phillipps, P. J. 2011, MNRAS 413, 2380
- (39)
- (40) Joshi, M. M., Haberle, R. M. & Reynolds, R. T. 1997, Icarus 129, 450
- (41)
- (42) Joshi, M. 2003, Astrobiology 3, 415
- (43)
- (44) Joshi, M. M., Haberle, R. M. 2012, Astrobiology 12, 3
- (45)
- (46) Hulbe, C. L., MacAyeal 1999, J. Geophys. Res. 104(B11), 25394
- (47)
- (48) Kite, E. S., Gaidos, E., Manga, M. 2011, ApJ 743, 41
- (49)
- (50) Kirschvink, J. L., Ripperdan, R. L., Evans, D. A. 1997, Science 277, 541
- (51)
- (52) Kopparapu, R. K. 2013, ApJ 767, L8
- (53)
- (54) Leconte, J. et al. 2013, arxiv 1303.7079
- (55)
- (56) Lissauer, J. J. 2007, ApJ 660, L149
- (57)
- (58) Lucarini, V. et al. 2013, arxiv:1303.5937
- (59)
- (60) MacAyeal, D. 1993, Paleoceanography, 8(6), 775
- (61)
- (62) Merlis, T. M., Schneider, T. 2010, James 2, 13
- (63)
- (64) Montgomery, R., Laughlin, G. 2009 Icarus 202, 1
- (65)
- (66) Morton, T. D., Swift, J. J. 2013, arxiv:1303.3013
- (67)
- (68) Ogihara, M., Ida, S. 2009, ApJ 699, 824
- (69)
- (70) Pierrehumbert, R. T. 2011, ApJ 726, L8
- (71)
- (72) Raub, T. D., Kirschvink, J.L., Evans. D. A. D. 2007 Treatise on Geophysics, V. 5, Ch. 14, p. 565
- (73)
- (74) Raymond, S. N., Scalo, J., Meadows, V. S. 2007, ApJ 669, 606
- (75)
- (76) Rodr guez, A., Callegari, N., Michtchenko, T. A., Hussmann, H. 2012, MNRAS 427, 2239
- (77)
- (78) Rojas-Ayala, B. et al. 2013, Astronomische Nachrichten 334, 155
- (79)
- (80) Scambos, T. et al. 2009, Earth And Planetary Science Letters, 280(1-4), 51
- (81)
- (82) Seager, S., Deming, D. 2010, ARA&A 48, 631
- (83)
- (84) Showman, A. P., Cho, J. Y.-K., Menou, K. 2011, Exoplanets, edited by S. Seager. Tucson, AZ: University of Arizona Press, p. 419
- (85)
- (86) Tziperman, E. et al. 2012, J. Geophys. Res. 117, C05016
- (87)
- (88) Valencia, D., O’Connell, R. J., Sasselov, D. 2006, Icarus 181, 545
- (89)
- (90) Wordsworth, R. D. et al. 2011, ApJ 733, L48
- (91)
- (92) Zsom, A., Seager, S., de Wit, J. 2013, arxiv:1304.3714
- (93)
| Model | Key Parameters | Nightside Snow | Equivalent Ice |
|---|---|---|---|
| Precipitation (mm/day) | Thickness (m) | ||
| Earth1 | h, Stellar longitude = deg | 0.12 | 470 |
| Earth2 | h, Stellar longitude = deg | 0.11 | 440 |
| Earth3 | h, Stellar longitude = deg | 0.26 | 400 |
| Earth.lowP | Earth1 except bar | 0.27 | 770 |
| Earth.lowCO2 | Earth1 except ppm | 0.10 | 600 |
| Earth.highCO2 | Earth1 except ppm | 0.16 | 320 |
| Earth.fast | Earth1 except h | 0.29 | 340 |
| Earth.slow | Earth1 except h | 0.009 | 490 |
| SuperEarth | Earth1 except m s-2, km | 0.07 | 400 |
| Aquaplanet | Earth1 without continents | 0.06 | 560 |
