Magnetic force microscopy study of the switching field distribution of low density arrays of single domain magnetic nanowires
Abstract
In the present work, we report on the in situ magnetic force microscopy (MFM) study of the magnetization reversal in two-dimensional arrays of ferromagnetic Ni80Fe20 and Co55Fe45 nanowires (NW) with different diameters (40, 50, 70 and 100 nm) deposited inside low porosity () nanoporous polycarbonate membranes. In such arrays, the nanowires are sufficiently isolated from each other so that long range dipolar interactions can be neglected. The MFM experiments performed for different magnetization states at the same spot of the samples are analysed to determine the switching field distribution (SFD). The magnetization curves obtained from the MFM images are relatively square shaped. The SFD widths are narrower compared to those obtained for high density arrays. The weak broadening of the curves may be ascribed to the NW intrinsic SFD. The influence of diameter and composition of the ferromagnetic NW is also investigated.
I Introduction
Ordered arrays of isolated magnetic nanostructures are of considerable interest for replacing continuous film magnetic recording media for ultrahigh density beyond 1 Tbit/in2. In such patterned media, each artificially fabricated magnetic nanostructure is capable of storing an individual bit. In order to make patterned media technologically viable a strict control of the switching field distribution (SFD) is essential [1, 2]. In recent years, there have been a considerable number of studies regarding the formation of arrays of single domain magnetic nanowires (NW) embedded in nanoporous templates by electro deposition [3-8]. The large aspect ratio of these nanowires ensures perpendicular nanostructured media due to shape anisotropy. Although the SFD can be obtained from a DC demagnetization remanence curve averaged over a large nanowire array, magnetic force microscopy (MFM) has been found to be an interesting approach to probe locally the magnetization reversal process and to obtain local hysteresis loops [9-12]. In some conditions, the MFM may also be used to locally manipulate the magnetization in arrays of ferromagnetic NW [13]. Also, interesting two dimensional labyrinth pattern of magnetic domain structure in the demagnetized state was demonstrated using MFM measurements in hexagonal lattices formed in anodized aluminum oxide (AAO) templates [9-12].
The SFD has two components that should be addressed separately [12, 14, 15]: an intrinsic part and a dipolar contribution arising from the magnetostatic interaction of a nanowire with its neighbours. In the latter case, the reversal field of a nanowire depends on the magnetic state of its neighbours. Besides, there are many causes for intrinsic SFD that may arise from local variations of the nanowire magnetic properties and disparity in nanowire sizes and edge effects. Such variations manifest themselves as a distribution of the switching fields associated to the magnetization reversal process of nanowires. From previous studies performed on dense arrays of single domain nanowires embedded in AAO templates, it appears that the SFD is quite large, up to 5-8 kOe [3, 12, 16], resulting from the large dipolar magnetic interaction that dominates the behaviour of hysteresis loops. Discrimination between intrinsic and dipolar contributions is not straightforward and requires dipole-dipole interaction models to estimate the intrinsic SFD [12, 17].
In this work, we present a fundamental MFM study to evaluate the intrinsic SFD in arrays of bistable Ni80Fe20 and Co55Fe45 NW deposited in low porosity polycarbonate (PC) membranes with controlled diameters in the range 40-100 nm. All NW can be considered as infinite long cylinders. It is shown that the intrinsic SFD, extracted directly from the MFM measurements without involving the complicated calculations, is considerably reduced. In addition, the non-uniformity in wire diameter manifest itself as an increase of the intrinsic SFD as the diameter is reduced.
II Experimental procedures
II.1 Fabrication of arrays of magnetic nanowires
The arrays of Ni80Fe20 and Co55Fe45 NW have been fabricated by electrodeposition in track-etched PC membranes of porosity (P) less than . For this study, membranes with pore diameters () of 40, 50, 70 and 100 nm have been used. The experimental procedure for obtaining the nanoporous PC membranes used in this study is detailed elsewhere [18]. From scanning electron microscopy (SEM) measurements (not shown here), the diameter distribution of the membrane pores has a standard deviation nm.
Prior to the electrodeposition, a gold layer was evaporated on one side of the membrane in order to cover the pores and use it as a cathode. For proper adhesion of the gold layer, a thin layer of Cr (10 nm) was first deposited on the PC membranes. Ni80Fe20 NW were grown at a constant potential of V from an electrolyte containing NiSO4.6H2O (131 g/L), FeSO4.6H2O (5.56 g/L) and H3BO3 (24.7 g/L). The Co55Fe45 NW were deposited at a constant potential of V from a CoSO4.7H2O (80 g/L), FeSO4.6H2O (40 g/L), H3BO3 (30 g/L) electrolyte at room temperature. The high aspect ratio NW presented in this study have a mean length () of around 4 µm with a standard deviation of µm measured using SEM. Furthermore, previous studies showed that Ni80Fe20 and Co55Fe45 NW synthesized in such conditions present a polycrystalline cubic structure with no preferred texture along the NW axis, so that the magnetocrystalline anisotropy can be neglected [11, 19, 20, 21]. The effective packing density , defined as the total area of the top end of the NW divided by the total area of the surface of membrane under consideration : and the mean inter-wire distances , for the first four neighbouring wires, have been measured from MFM images.
II.2 MFM experiments
A smooth surface, where all the nanowire tips are close to the surface at one side, has been obtained by removing the Au and Cr layers using a chemical etching procedure. MFM experiments were then performed under ambient conditions using an Agilent 5500 microscope (Agilent Technologies) equipped with 100 µm closed-loop scanner. The MFM probes, Bruker MESP-HM with a force constant around 2.8 N.m-1 and a resonance frequency of about 75 kHz were used for this study. The analyses were realised in amplitude-modulation (AM-AFM) using a double pass procedure. First, the topography of one line was recorded in standard intermittent-contact mode. Then, the probe was lifted up a few tens of nanometres and the same line was scanned at constant probe-surface distance; the phase signal proportional to the magnetic interaction was simultaneously recorded.
The setup of the instrument was modified with a custom-built electromagnet for performing in situ MFM experiments allowing the analysis of the same spots of the samples after applying various magnetic fields parallel to the NW direction. Before inserting the sample inside the setup, the NW array magnetization was saturated along their axis (z) under a magnetic field of kOe while the MFM probe tip was saturated in the opposite direction (). For the MFM images, phase-lag has been measured which is inversely proportional to the force gradient as shown in the equation below.
is the cantilever quality factor and its stiffness. Therefore, attractive forces with a positive gradient lead to a negative phase-lag (dark contrast) and repulsive forces with a negative gradient lead to a positive phase-lag (bright contrast). The different MFM-images presented in this work were obtained at zero fields, in the remnant states, after applying increasing reverse magnetic fields along the NW’s axis. In addition to the MFM experiments, magnetization curves were obtained using an alternating gradient field magnetometer (AGFM). The FEMM package [21] has been used in order to estimate the dipolar field created by an isolated and uniformly magnetized NW.
III Results and discussion
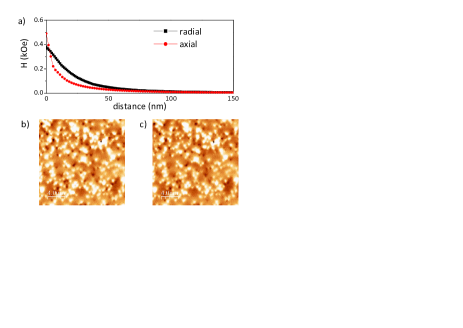
The between nanowires was found to be larger than 600 nm (measured between the first four neighboring wires). Figure 1a presents the dipolar field created by a uniformly magnetized and isolated NW ( µm, nm) using the Ni80Fe20 saturation magnetization value: emu.cm-3. It illustrates that for 600 nm the dipolar interactions between NW can be neglected. As a consequence, the magnetic state in the remnant state and under an applied magnetic field should be the same. This is demonstrated by the MFM images of a Co55Fe45 nanowire array (0 nm) in a positive 600 Oe field (Figure 1b) and as the field was lowered to zero (Figure 1c). It can be observed that both images are similar demonstrating that the low packing density of the NW array indeed leads to weak dipolar interactions between NWs, and that measurements done at a field and at zero applied field after applying a field are same.
Figures 2a-b present typical MFM images obtained for the array of Co55Fe45 NW ( nm) and Ni80Fe20 NW ( nm). The first image (top left) corresponds to a situation where all the NW are uniformly magnetized in a field Oe along +Oz while the tip is magnetized along . Then, a series of magnetic fields opposite to the sample initial saturation field were applied. The successive switching of the NW started after the application of around 360 Oe and 310 Oe until the application of around 1200 Oe and 585 Oe for Co55Fe45 and Ni80Fe20 NW, respectively. The spot sizes (black or white) are larger than the nominal diameters of the wires because MFM measures the dispersive stray field emanating from the wires and not the exact wire dimensions.

These images first demonstrate the bistable behaviour of the nanowires. The MFM investigations show the magnetization at the top of the NW and the presence of only two magnetization states indicates that they are bistable and single domain. Indeed, the bright and the dark contrasts of the NW are the result of their magnetization antiparallel or parallel to the magnetization of the probe, respectively, as explained above. Furthermore, the coercivity of the probe used is 400 Oe whereas the moment is emu so its stray field is not influencing the magnetization reversal of the arrays without applying external magnetic field. From the MFM images, it was confirmed that only two remnant states are stable inside each NW corresponding to single domain NW with “up” (along ) and “down” (along ) magnetisation directions. Consequently, the local hysteresis curve was calculated by counting the number of NW with “up states” and “down states”. Thus, the normalized magnetization can be written as [12]:
Where and correspond to the number of NW in up and down states in the image; is the saturation magnetization and is the magnetization at field ; note that the coercive field is the field at which . Figure 2c presents a comparison between the MFM-magnetization curve (red dots) and the magnetization curve from AGFM (continuous line) measured for the array of Ni80Fe20 NW ( 70 nm).
Actually, the measurements performed by a magnetometer are sensitive to the entire volume of the NW whereas the MFM measurements are not sensitive to it since it is a surface imaging technique. From the good agreement between both kinds of measurements, it can be assumed that the scanned area ( µm2) is large enough to ensure that the effect of NW volume distribution is taken into account. In addition, MFM allows mapping the local magnetization curves for the NW arrays with very low packing density where the volume magnetic moment is too weak to be measured by bulk magnetometry.
From the images presented in Figures 2a-b, we observe that the magnetization reversal of the NW is nearly random. This supports the assumption of weak dipolar interactions. Indeed, in AAO arrays of NW [9, 19] exhibiting strong dipolar interactions, the switching of one NW is strongly influenced by the magnetization state of its neighbours. In addition, the demagnetized state of AAO NW arrays presents a labyrinth domain pattern, as expected for a hexagonal array to maintain neighbouring bits with antiparallel magnetization and to minimize the inter NW dipolar field energy [9]. The demagnetized state of the present arrays corresponds roughly of black (resp. white) spots, randomly distributed (not shown here) which is consistent with an array presenting negligible dipolar interactions.
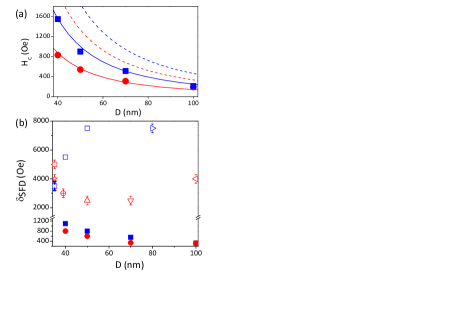
The coercive field measured by MFM is reported in Figure 3a: it increases with decreasing for the two sets of NW arrays. This variation can be well fitted using a law (solid lines in Figure 3a). Magnetization reversal analytical models of an infinite cylinder have been used to qualitatively explain this dependence [28]. It is found that the dependence of on the diameter of the nanowires in the curling model, as given by , where is the exchange stiffness and the radius of the NW is in qualitative agreement with the experimental observations. However, the values found with this model are approximately two times larger than the experimental ones. Such difference has already been found in previous studies where the -dependence of the coercive field of non-interacting Ni NWs embedded in PC membranes has been experimentally determined and compared to micromagnetic simulations and analytical models [29]. Shape deviations from the ideal cylinder [30] like structural defects at the extremity of the NW can play the role of nucleation sites for the magnetization reversal and may be the origin of these differences. However, from the -dependence of the coercive field, it can be concluded that in these arrays of NW, the magnetization reversal follows the curling mode.
The SFD is linked with the number of switched NW after each increment of the applied magnetic field. The SFD width () which corresponds to the field range between the magnetization reversal of the first NW and that of the last one is also found to be -dependent (see Figure 3b). The obtained from densely packed NW arrays are reported in Figure 3b for comparison. These values are at least 3 times larger than the ones obtained in this study [3,9,11, 14, 16,20, 22- 27]. In the dense arrays, the dipolar interactions are strong and lead to a broadening of [9], whereas, in the present study is essentially due to intrinsic effects and no complex calculation is required to discriminate between the intrinsic and dipolar contributions to the switching field distribution. Wang et al. [11] reported the intrinsic SFD in an array of Co NW ( 30 nm) embedded in AAO membranes by evaluating and subtracting the total dipolar field present in this array. Even after subtracting the effect of this dipolar field, an intrinsic SFD width of about 4 kOe was estimated (i. e. about one order of magnitude larger than in the present study) which confirms the complexity of such an analysis. The deviation of from an ideal Dirac function may be due to parameters such as the distributions of diameter and length, the non-uniformity of the shape, inhomogeneities in the microstructure and chemical composition of the NW.
To explain the variation of the with (see Figure 3b), the size distribution of the nanopore diameter which can be fitted by a Gaussian law with a standard deviation of nm has been taken into account. Assuming that can be written as where, is the contribution of the diameter distribution and refers to the contribution of other factors such as non-uniform NW lengths and tips and inhomogeneities in the microstructure and chemical composition. The two major contributions and can be determined separately. For calculating , the product of diameter distribution and the fits obtained from the experimental evolutions of with (Figure 3a), from MFM measurements, have been used.
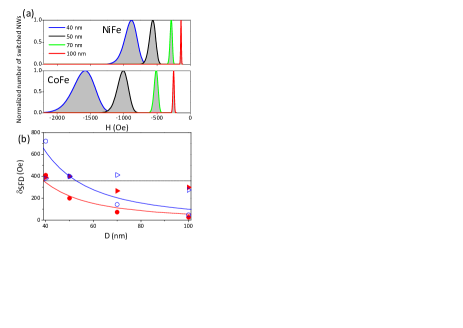
Figure 4a presents the calculated in this way while Figure 4b shows that increases with decreasing and is well fitted using a law. Note that the appears to be almost independent of for the two NW arrays (triangles in Figure 4b) and is around the value of 350 Oe, which is quite low for our NW arrays in comparison with AAO NW arrays. This means that the significant contribution to the total SFD of AAO NW arrays and also of bit patterned media [30] originates from non-intrinsic dipolar interaction effects. The measured in the present study is essentially intrinsic. One may think that the broader for smaller diameters could be the consequence of an increased packing density and hence stronger dipolar interactions. Nevertheless, in the arrays under study, slightly enhances with increasing whereas is decreasing showing that influence of the on was more prominent for small . If dipolar interactions were present, this would have led to the broadening of when increases which is not the case in present measurements.
IV Conclusion
The magnetization reversal process in arrays of Ni80Fe20 and Co55Fe45 ferromagnetic NW embedded into low porosity nanoporous polycarbonate membranes has been studied systematically by in situ magnetic force microscopy. The fabricated NWs have high aspect ratio and negligible magnetocrystalline anisotropy, so the magnetization has been found to be parallel to the NW axis displaying bistable magnetic behaviour. By analysing the numbers of NWs with magnetization up and down, local magnetization curves were obtained which agree well with bulk magnetization measurements from AGFM. The images taken under continuous magnetic field and in the remnant state were compared and found to be identical demonstrating that for these low density arrays the remnant state is identical to the in-field state due to the weak dipolar interaction. The influence of the diameter on the magnetization reversal and the SFD is shown. Regardless of the NW diameter, narrow SFD widths ( ) are observed compared to the ones generally obtained for densely packed NW arrays in AAO membranes (a SFD width of 300 Oe was obtained for the 100 nm samples). Moreover, an increase of with decreasing diameter is observed and is qualitatively explained by considering the size distribution of the template nanopores.
Acknowledgements.
The authors thank E. Ferain for providing the PC templates and Pascal Van Velthem for technical assistance. J. De La Torre and Armando Encinas thanks CONACYT for financial support through grants No. 166089, 177896, 105568 and 162651. M.R. Tabasum and B. Nysten acknowledge financial support of the Belgian government in the framework of the “Interuniversity Attraction Poles” program (IUAP7/6-FS2). M.R Tabasum is Assistant Professor on leave from department of industrial and manufacturing engineering RCET-UET Lahore.References
- (1) S. N. Piramanayagam and K. Srinivasan, J. Magn. Mag. Mater. 321, 485 (2009)
- (2) J. W. Lau and J. M. Shaw, J. Phys. D: Appl. Phys. 44, 303001 (2011)
- (3) P. S. Fodor, G. M. Tsoi, and L. E. Wenger, J. Appl. Phys. 93, 7438 (2003)
- (4) T. G. Sorop, K. Nielsch, P. Goring, M. Kroll, W. Blau, R. B. Wehrspohn, U. Gosele and L. J. de Jongh, J. Magn. Magn. Mater. 272-276, 1656 (2004)
- (5) L. Piraux, A. Encinas, L. Vila, S. Mátéfi-Tempfli, M. Mátéfi-Tempfli, M. Darques, F. Elhoussine and S. Michotte, J. Nanosci. Nanotechnol. 5, 372 (2005)
- (6) M. Vazquez, K. Pirota, J. Torrejon, D. Navas and M. Hernandez-Velez, J. Magn. Magn. Mater. 294, 174 (2005)
- (7) L.-P. Carignan, C. Lacroix, A. Ouimet, M. Ciureanu, A. Yelon and D. Menard, J. Appl. Phys. 102, 023905 (2007)
- (8) J. De La Torre Medina, L. Piraux and A. Encinas, App. Phys. Lett. 96, 042504 (2010)
- (9) K. Nielsch, R. B. Wehrspohn, J. Barthel, J. Kirschner, U. Gosele, S. F. Fischer and H. Kronmüller, Appl. Phys. Lett. 79, 1360 (2001)
- (10) T. G. Sorop, C. Untiedt, F. Luis, M. Kröll, M. Raºa, and L. J. de Jongh, Phys. Rev. B 67, 014402 (2003)
- (11) T. Wang, Y. Wang, Y. Fu, T. Hasegawa, H. Oshima, K. Itoh, K. Nishio, H. Masuda, F. S. Li, H. Saito and S. Ishio, Nanotechnol. 19, 455703 (2009)
- (12) K. Nielsch, R. B. Wehrspohn, J. Barthel, J. Kirschner, S. F. Fischer, H. Kronmüller, T. Schweinböck, D. Weiss, U. Gösele, J. Magn. Magn. Mater. 249, 234 (2002)
- (13) M. A. Kayali and W. M. Saslow, Phys. Rev. B 70, 174404 (2004)
- (14) O. Hellwig, A. Berger, T. Thomson, E. Dobisz, Z. Z. Bandic, H. Yang, D. S. Kercher and E. E. Fullerton, Appl. Phys. Lett. 90, 162516 (2007)
- (15) H. R. Khan and K. Petrikowskia, Mat. Science and Engineer. C 19, 345 (2002)
- (16) A. N. Dobrynin, M. T. S. Barthem and D. Givord, Appl. Phys. Lett. 95, 052511 (2009)
- (17) E. Ferain and R. Legras, Nucl. Instrum. Methods B 208, 115 (2003)
- (18) A. Asenjo, M. Jaafar, D. Navas and M. Vazquez J. Appl. Phys. 100, 023909 (2006)
- (19) D. Navas, A. Asenjo, M. Jaafar, K. R. Pirota, M. Hernández-Vélez, R. Sanza, W. Leeb, K. Nielsch, F. Batallána, M. Vázquez, J. Magn. Magn. Mater. 290, 191(2005)
- (20) S. Aravamudhan, J. Singleton, P. A. Goddard and S. Bhansali, J. Phys. D: Appl. Phys. 42, 115008 (2009)
- (21) D. C. Meeker, Finite Element Method Magnetics ( http://www.femm.info )
- (22) M. S. Salem, P. Sergelius, R. Zierold, J. M. M. Moreno, D. Gorlitz and K. Nielsch. J. Mater. Chem. 22, 8549 (2012)
- (23) Q. Liu, J. Wang, Z. Yan and D. Xue, Phys. Rev. B 72, 144412 (2005)
- (24) J. Xu and K. Wang, Journal of Wuhan University of Technology-Mater. Sci. Ed., 23, 472 (2008)
- (25) S.-G. Cho, B. Yoo, K. H. Kim and J. Kim, IEEE Trans. Magn. 46, 420 (2010)
- (26) X. Kou, X. Fan, H. Zhu and J. Q. Xiao, Appl. Phys. Lett. 94, 112509 (2009)
- (27) R. Skomski, H. Zeng, M. Zheng, and D. J. Sellmyer, Phys. Rev. B 62, 3900 (2000)
- (28) R. Ferré, K. Ounadjela, J. M. George, L. Piraux and S. Dubois, Phys. Rev. B 56, 14066 (1997)
- (29) F. Ott, T. Maurer, G. Chaboussant, Y. Soumare, J.-Y. Piquemal and G. Viau, J. Appl. Phys. 105, 013915 (2009)
- (30) Y. J. Chen, T. L. Huang, J. Z. Shi, J. Deng, J. Ding, W. M. Li, S. H. Leong, B.Y. Zong, Hnin Yu Yu Ko, S. B. Hu, J. M. Zhao, J. Magn. Magn. Mater. 324, 264 (2012)